by Scott Muniz | Aug 19, 2020 | Uncategorized
This article is contributed. See the original author and article here.
Thanks to Jayantha Das, who shared some of the common command we use in SQL Server on Linux Pacemaker Maker cluster. This blog contains the pacemaker settings that we can modify. Unless explicitly required it is recommended that we don’t modify the values as it can cause problem in the functionality of availability groups.
We can run “sudo pcs config” to list critical cluster configuration settings
Master: ag_cluster-master
Meta Attrs: failure-timeout=30s notify=true
Resource: ag_cluster (class=ocf provider=mssql type=ag)
Attributes: ag_name=ag1
Operations: start interval=0s timeout=60 (ag_cluster-start-interval-0s)
stop interval=0s timeout=10 (ag_cluster-stop-interval-0s)
promote interval=0s timeout=60 (ag_cluster-promote-interval-0s)
demote interval=0s timeout=10 (ag_cluster-demote-interval-0s)
monitor interval=10 timeout=60 (ag_cluster-monitor-interval-10)
monitor interval=11 role=Master timeout=60 (ag_cluster-monitor-interval-11)
monitor interval=12 role=Slave timeout=60 (ag_cluster-monitor-interval-12)
Resource: virtualip (class=ocf provider=heartbeat type=IPaddr2)
Attributes: ip=xx.xx.xx.xx
Operations: start interval=0s timeout=20s (virtualip-start-interval-0s)
stop interval=0s timeout=20s (virtualip-stop-interval-0s)
monitor interval=10s timeout=20s (virtualip-monitor-interval-10s)
Interval
Interval for the above operations mean how frequently (in seconds) to perform the operation. A value of 0 means never. A positive value defines a recurring action, which is typically used with monitor.
Timeout
Timeout for the above operation means how long to wait before declaring the action has failed
Role
Role for the above operations (like the one in the monitor) mean run the operation only on node(s) that the cluster thinks should be in the specified role. This only makes sense for recurring monitor operations. Allowed (case-sensitive) values: Stopped, Started, and in the case of multi-state resources, Slave and Master.
The usual monitor actions are insufficient to monitor a multi-state resource, because pacemaker needs to verify not only that the resource is active, but also that its actual role matches its intended one.
For example,
Define two monitoring actions: the usual one will cover the slave role, and an additional one with role=”master” will cover the master role. In the case of Availability Groups the master is the primary and Slave indicates the secondary node.
<op id=“public-ip-slave-check” name=“monitor” interval=“60”/><op id=“public-ip-master-check” name=“monitor” interval=“61” role=“Master”/>
It is crucial that every monitor operation has a different interval! Pacemaker currently differentiates between operations only by resource and interval; so if (for example) a master/slave resource had the same monitor interval for both roles, Pacemaker would ignore the role when checking the status — which would cause unexpected return codes, and therefore unnecessary complications.
Connection timeout can be found in the corosync logs
monitor: 2019/09/26 13:48:55 ag-helper invoked with hostname [localhost]; port [1433]; ag-name [ag1]; credentials-file [/var/opt/mssql/secrets/passwd]; application-name [monitor-ag_cluster-monitor]; connection-timeout [30];
The SQL query timeout is same as the connection timeout.
Following table list the some of the critical parameters and brief description and how to use it.
|
NAME
|
Description
|
How to use it
|
|
cluster-recheck-interval
|
Polling interval for time-based changes to options, resource parameters and constraints.
A Pacemaker cluster is an event-driven system. As such, it won’t recalculate the best place for resources to run unless something (like a resource failure or configuration change) happens. If time-based rules are needed, the cluster-recheck-interval cluster option (which defaults to 15 minutes) is essential.This tells the cluster to periodically recalculate the ideal state of the cluster. For example, starting a resource between a certain period of time.
|
sudo pcs property set cluster-recheck-interval=2min
|
|
corosync totem token timeout
|
This is to make sure corosync is resilent against intermittent network glitches; the default is 1000 ms, or 1 second for a 2 node cluster, increasing by 650ms for each additional member; To use a value other than the default, add or edit the token line in /etc/corosync/corosync.conf e.g. totem { token: 5000}
|
cat /etc/corosync/corosync.conf
totem {
version: 2
cluster_name: pcmk
secauth: off
transport: udpu
token: 10000
}
|
|
start-failure-is-fatal
|
Indicates whether a failure to start a resource on a particular node prevents further start attempts on that node. When set to false, the cluster will decide whether to try starting on the same node again based on the resource’s current failure count and migration threshold.
|
sudo pcs property set start-failure-is-fatal=true
|
|
failure-timeout
|
cluster-recheck-interval indicates the polling interval at which the cluster checks for changes in the resource parameters, constraints or other cluster options. If a replica goes down, the cluster tries to restart the replica at an interval that is bound by the failure-timeout value and the cluster-recheck-interval value. For example, if failure-timeout is set to 60 seconds and cluster-recheck-interval is set to 120 seconds, the restart is tried at an interval that is greater than 60 seconds but less than 120 seconds. We recommend that you set failure-timeout to 60s and cluster-recheck-interval to a value that is greater than 60 seconds. Setting cluster-recheck-interval to a small value is not recommended.
|
sudo pcs resource update resource_name meta failure-timeout=60s
|
|
monitor_policy
|
Monitoring policy options are:
1) SERVER_UNRESPONSIVE_OR_DOWN: Fail if the SQL Server instance is unresponsive (unable to establish a connection) or down (the process is not running)
2) SERVER_CRITICAL_ERROR: Fail if sp_server_diagnostics detects a critical system error
3) SERVER_MODERATE_ERROR: Fail if sp_server_diagnostics detects a critical system or resource error
5) SERVER_ANY_QUALIFIED_ERROR: Fail if sp_server_diagnostics detects any qualified error
pcs resource update C2PODDAG monitor_policy=1
|
sudo pcs resource update resource_name monitor_policy=2
This shows up as health-threshold [2]; in corosync logs
|
|
Connection_timeout
|
This is the timeout of the connection request to the sql server by the pacemaker. The timeout can be set using the pcs command.
|
sudo pcs resource update resource_name connection_timeout=90
|
|
demote action timeout (s)
|
Demote action demotes relevant resources that are running in master mode to slave mode. The timeout can be set using the pcs command.
|
sudo pcs resource update resource_name op demote timeout=20
|
|
promote action timeout (s)
|
Promote action promotes relevant resource to the master mode. The timeout can be set using the pcs command.
|
sudo pcs resource update resource_name op promote timeout=60
|
|
start action timeout (s)
|
Start action starts the resource. The timeout can be set using the pcs command.
|
sudo pcs resource update resource_name op start timeout=60
|
|
stop action timeout (s)
|
Stop action stops the resource. The timeout can be set using the pcs command.
|
sudo pcs resource update resource_name op stop timeout=60
|
|
monitor action timeout (s)
|
Monitor action checks the resource’s state.
|
sudo pcs resource update resource_name op monitor interval=11 role=Master timeout=11
Monitor timeout should be greater than the connection timeout.
|
by Scott Muniz | Aug 19, 2020 | Uncategorized
This article is contributed. See the original author and article here.
Following article describe how to configure Active Directory authentication on SQL Server running in Red Hat operating system using Red Hat Enterprise Linux Identity Management
Tutorial: Configuring Red Hat Enterprise Linux to allow Active Directory users to login to Microsoft SQL Server 2019 leveraging a trust-level setup between Red Hat Enterprise Linux Identity Management and Microsoft Active Directory.
https://access.redhat.com/articles/4094741
Recently we found on SQL Server managed by Red Hat Enterprise Linux Identity Management, if we execute a high privileged command like create user first time it succeeds, if we try to add the user second time it fails with following error.
1>create login test102 with password=’test102′,check_policy=off
2>go
1>create login test103 with password=’test103′,check_policy=off
2>go
Msg 15404, Level 16, State 22, Server sql-idm, Line 1
Could not obtain information about Windows NT group/user ‘acnetsqladmin’, error code 0x80090304.
1> quit
Redhat has acknowledged the issue and a fix is released in Red Hat 8.2
by Scott Muniz | Aug 19, 2020 | Azure, Microsoft, Technology, Uncategorized
This article is contributed. See the original author and article here.
This blog post continues the series about Azure Security Center threat protection for SQL IaaS VMs. As you learnt in this blog post, Azure Security Center protects SQL servers hosted on either Azure VMs, Azure Arc and on-premises. This post will focus on SQL running on-premises and how to leverage ASC threat protection for SQL in this type of scenario.
SQL Server running on-premises
If your SQL server is installed in a Windows machine, located on-premises Windows and without Azure Arc, you really have two options for connecting it to Azure:
- Deploy Azure Arc
- Connect Windows machines to Azure Security Center without Azure Arc using Log Analytics agent.
Deploying Azure Arc
You can connect any Windows machine to Security Center, however, Azure Arc provides deeper integration across all your Azure environment. If you set up Azure Arc, you will see the SQL Server – Azure Arc page in the portal and your security alerts will appear on a dedicated Security tab on that page. The first and recommended option is to set up Azure Arc on the host. Please refer to this blog post for SQL VMs hosted on Azure Arc.
Connect Windows machines to Azure Security Center without Azure Arc
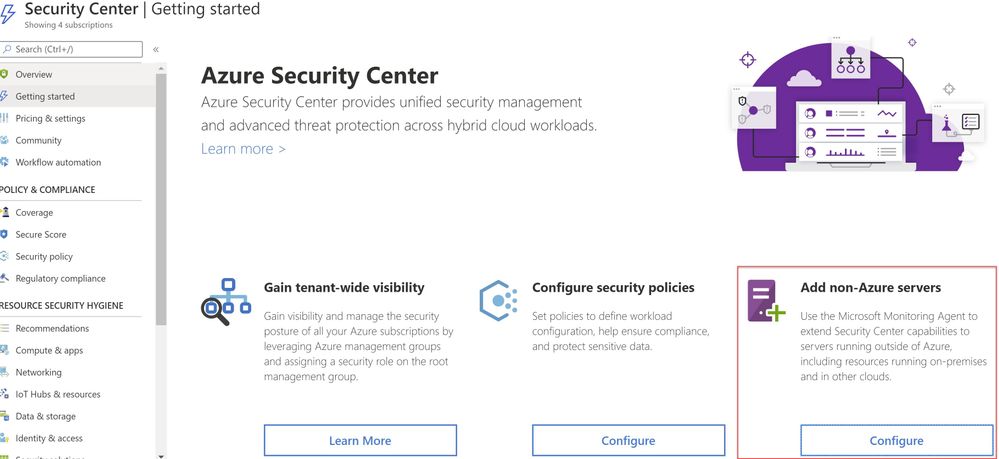
Security Center can monitor the security posture of non-Azure computers, but you need to first onboard these resources. If you choose to connect a SQL Server running on a Windows machine without using Azure Arc, you can use the option Add non-Azure servers from the Getting started blade or from the Compute blade as shown in ‘Image 1 & 2’.
 Image 1: Add Non-Azure Servers
 Image 2: Onboard servers to Security Center
You will be redirected to Direct Agent page from where you can install appropriate Windows Agent.
TIP: You can connect any on-premises machine to Azure Security center by manually installing Log Analytics agent to extend the Security Center capabilities to servers running outside of Azure be it in on-premises or in other clouds. Just make sure the on-premises machine (In our scenario, SQL server) is connected to the relevant log analytics workspace. You can check this by navigating to Log Analytics workspace > Advanced settings > Connected sources > Choose either Windows/Linux server, as shown in ‘Image 3’.
 Image 3: Confirmation of Connected Sources
Once you have the Log Analytics agent installed, Azure Security Center will start scanning the machines and flag prioritized list of recommendations accordingly, if not configured according to security best practices.
Note: for Step-by-Step instructions to onboard a non-azure computer, please refer to this article.
Validating SQL threat detection
When Azure Security Center identifies the pre-attack you should be able to view the alert in the Security alerts section as shown in ‘Image 4’
Note: Make sure you have non-azure environment selected from the Filter.
 Image 4: Security Alerts snapshot
Conclusion
Alerts are designed to be self-contained, with detailed remediation steps and investigation information in each one. You can investigate further by using Azure Security Center and Azure Sentinel capabilities for a broader view:
- Enable SQL Server’s auditing feature for further investigations. If you are an Azure Sentinel user, you can upload the SQL auditing logs from the Windows Security Log events to Sentinel and enjoy a rich investigation experience. Learn more about SQL Server Auditing.
- To improve your security posture, use Security Center’s recommendations for the host machine indicated in each alert. This will reduce the risks of future attacks.
What are you waiting for? Go ahead, leverage Azure Security Center to protect your SQL IaaS VMs.
Special thanks to:
Yuri Diogenes, Senior PM, CxE Security – ASC Team for reviewing this post.
by Scott Muniz | Aug 19, 2020 | Uncategorized
This article is contributed. See the original author and article here.
Natural Language Queries is a feature in Ideas in Excel, powered by Machine Learning and Natural Language Processing that makes data analysis simpler, faster, and more approachable.
Natural Language Queries Now Generally Available
Thank you for providing valuable feedback on how to improve Natural Language Queries! We’re excited to announce that the Natural Language Queries feature introduced at Ignite last November is now generally available in Windows, Mac, and Excel for the web.
After Ignite, we have added more refreshable PivotTable answers and we have introduced answers supported by formulas. We have also made many quality improvements such as the ability to understand questions in relation to date/time columns (‘by year‘, ‘by month’).
Let’s see it in action
Simply click a cell in a data range, and then click the Ideas button on the Home tab. Ideas will analyze your data and provide high-level summaries, trends, and patterns.
If you are interested in more specific information, enter a question in the query box at the top of the pane, and press Enter. Ideas will provide answers that you can insert into the workbook in the form of charts, tables, PivotTables and formula answers.
For example, if you have sales data with people names, you can ask ‘Who had the highest sales in 2018?’ or ‘What products have sales higher than 20,000?’. You can also specify how you want your answer, for instance, you can ask ‘Show me sales by product as table’ or add ‘sorted by product’ to your question.
If you are interested in exploring your data, or just want to know what is possible, Ideas also provides personalized suggested questions which you can access by clicking on the query box.
 GIF showing Natural Language Queries in Ideas in Excel.
Following Microsoft’s Responsible AI principles, Ideas strikes through any words from the question that it can’t understand. It also provides a description of the answer so that you can check whether it’s exactly what you were looking for. If it isn’t, please rephrase your question… and send us feedback.
We are always improving, and you can help us get better: please try Natural Language Queries out and send us your feedback through the Help tab.
Availability Notes
Natural Language Queries in Ideas is available to Microsoft 365 subscribers in English. If you are an Microsoft 365 subscriber, make sure you have the latest version of Office. To learn more about the different update channels for Office, see: Overview of update channels for Microsoft 365 Apps.
Your Feedback Helps Us Improve Our Product:
Let us know your thoughts on Natural Language Queries! Send us ideas and suggestions via UserVoice.
To learn more,
by Scott Muniz | Aug 19, 2020 | Uncategorized
This article is contributed. See the original author and article here.
Today, we are announcing the private preview for the classification improvements and would like you to join the preview and give us your valuable feedback.
Our team has been working on an exciting new update to the M365 S+C classification. The set of upcoming features would help you improve accuracy of your policies across M365 S+C solutions and increase coverage. We have improved accuracy of the out-of-the-box Sensitive information types, introduced confidence levels to simplify policy creation and added new capabilities to customize SITs which will allow you to fine-tune your SITs to reduce False positives & False negatives. In addition, we are adding new Sensitive information types that will allow you to increase your policy coverage.
Introducing Confidence levels
We are upgrading confidence levels by replacing number-based confidence system with three discrete confidence levels – high confidence, medium confidence & low confidence. Confidence levels (high, medium, low) reflect how much supporting evidence was detected along with the primary element. The more supporting evidence an item contains, the higher the confidence that a matched item contains the sensitive info you’re looking for. For example, matches with a high confidence level will contain more supporting evidence in proximity of the primary element and would lead to lower false positives but higher false negatives. Whereas matches with a low confidence level would contain little to no supporting evidence in proximity and thus would lead to zero to low false negatives but higher false positives.
Improved Accuracy
We have made platform & definitional changes to help reduce False positives & False negatives. These improvements impact 80% of our Out-of-the-box sensitive information types. In early testing within Microsoft & with few of our design partners, we have seen a reduction in false positive rate from 30-60% to below 10% in some cases for the SIT pattern with the highest confidence level.
Copy & edit OOB SITs & other Custom SIT improvements!
We are addressing one of the top asks to allow copy & edit of out of the box sensitive type to fine-tune SITs based on your tenant needs to reduce false positives & false negatives. In addition, we have significantly improved the user experience & capabilities of creating a custom SIT. We have added two new power features to the custom SIT flow along with other improvements – Validators & additional checks. Validators will allow you to define your own regex and use validators like Luhn check. Additional checks will enable scenarios like excluding samples such as 4111111111111111 from credit card matches, define starting or ending characters, include/exclude prefix, etc. With the new set of advancements, you will be able to customize the SITs as per your requirements to further reduce False positives or false negatives.
100+ new & enhanced SITs
We have added 98 new SITs and enhanced definitions for 27 existing SITs. You can refer the list of new & enhanced SITs at the bottom of this email.
Sign up for preview program
If you are interested in start using any of the above features, you can join the preview program by filling the consent form & we’ll add you to our MIP&C Preview team on Teams.
Who can join?
These improvements will be rolling out to all M365 S+C solutions. However, in the initial preview phase, we will be enabling them for Communication compliance and DLP for SharePoint, OneDrive, Teams and Exchange. So, if you have active policies for any of these solutions, you can participate in the preview program.
Preview timelines
The preview program will start in early-September and the features will light up in a phased manner. In the first phase you will have access to all the new & enhanced SITs, Improved accuracy and Confidence levels. Soon after, in the second phase, you will have access to Copy & edit OOB SITs & other Custom SIT improvements.
What is the expectation from you?
Create policies for sensitive information types you are interested in protecting and analyze the results to calculate the False positive & false negative rates. If you are seeing a false positive rate higher than 10% for the high confidence pattern or noticing false negatives, report it to us on the Class Depth Teams channel or write us an email at ClassDepthPreview@microsoft.com. We will help you bring them down by fixing issues on our side or by proposing customizations to your SITs.

Recent Comments