by Contributed | Sep 28, 2020 | Azure, Technology, Uncategorized
This article is contributed. See the original author and article here.
We just made building video analytics solutions simpler from edge to cloud with a new Azure IoT Central application template. This application template integrates Azure Live Video analytics video inferencing pipeline and OpenVINO™ AI Inference server by Intel® to build an end to end solution in a few hrs.
The number of IP cameras is projected to reach 1 billion (globally) by 2021. Traditionally, these types of cameras are used for security and surveillance. With the advent of video AI, businesses increasingly want to use their cameras to extract insights that help improve their profitability and automate (or semi-automate) their business processes. Such video analytics applied to live video streams help businesses react to real-time events and derive new business insights by observing trends over time.
Building a video analytics solution involves multiple complicated phases. This is relatively elaborate instrumentation that requires significant technical expertise and time. These solutions typically start with setting up new cameras or leveraging existing IP cameras for video traffic. IP cameras are versatile devices that support comprehensive configuration and management based on ONVIF standards. Once the IP cameras are set up, you need to ingest the video feeds, process the video, and prepare frames for analysis using inference servers that use specific AI models. These inference servers must be highly performant so that the solution can scale to dozens of cameras at any facility. The results from video analytics need to be collected and stored along with the relevant video for business applications to consume.
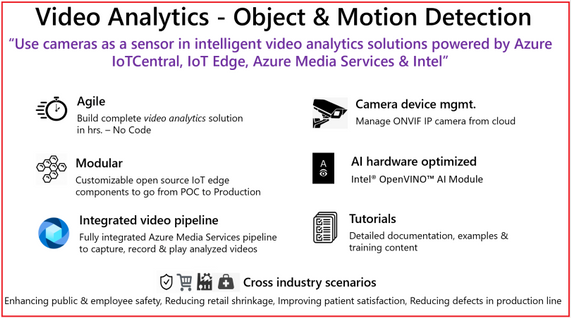
Using the new Azure IoT Central application template you can design, define, deploy, scale, and manage a live video analytics solution within hours. Video analytics template supports object and motion detection scenarios with key value propositions, as shown in the following illustration.

Figure 1. Customer & Partner value proposition from Video Analytics – Object and Motion detection app template
In our mission to democratize video analytics, Microsoft and Intel collaborated to build end-to-end video analytics solutions using IoT Central. These solutions leverage:
-
Live Video Analytics on IoT Edge (LVA) to capture, record, and analyze live video. LVA is a platform for building AI-based video solutions and applications that include AI applications to live video. You can generate real-time business insights from live video streams, process data near the source to minimize latency and bandwidth requirements and apply the AI models of your choice. LVA provides a flexible programming model to design live video workflows and defines an extensibility model for integrating with inference servers. This frees you up to focus development efforts on the business outcome rather than setting up and operating a complex, live video pipeline.
- For real-time analysis of live video feeds, the video pipeline leverages OpenVINO™ Model Server (OVMS), an inference server that’s highly optimized for AI vision workloads and developed for Intel® architectures. OVMS is powered by OpenVINO™ toolkit, a high-performance inference engine optimized for Intel® hardware on the Edge. An extension has been added to OVMS for easy exchange of video frames and inference results between the inference server and LVA, thus empowering you to run any OpenVINO™ toolkit supported model, and select from the wide variety of acceleration mechanisms provided by Intel® hardware. These include CPUs (Atom, Core, Xeon), FPGAs, VPUs.
-
Azure IoT Central is a platform for rapidly building enterprise-grade IoT applications on a secure, reliable, and scalable infrastructure. IoT Central simplifies the initial setup of your IoT solution and reduces the management burden, operational costs, and overhead of a typical IoT project. This enables you to apply your resources and unique domain expertise to solving customer needs and creating business value, rather than needing to tackle the mechanics of operating, managing, securing, and scaling a global IoT solution.
The IoT Central application template brings the goodness of Azure IoT Central, Live Video Analytics, and Intel components integration to enable building scalable solutions in a few hrs. as described in tutorials

Figure 2. Block diagram of Video Analytics – Object and Motion Detection app template
The app template stitches the following components,
-
Cloud Services – IoT Central Video Analytics Application Template to stich the end-end solution & Azure Media Services for video snippet storage
-
Edge Modules – Video processing pipeline (Live Video Analytics), hardware optimized OpenVINO™ AI Inference server by Intel, IoT Central gateway module to for protocol & identify translation of RTSP & Camera, RTSP Server (Live 555) for pre-recorded video strams
-
Connecting & managing IP Camera, RTSP streams and AI module configuration
The IoT Central application template natively provides device operators view for object and motion detection scenarios, as shown in the following illustration.

Figure 3. Dashboard from IoT Central template for Video Analytics – Object & Motion Detection
The dashboard in the new Video Analytics – Object & Motion Detection template for IoT Central is shown above. The template requires,
-
IP cameras (any IP cameras that support RTSP on the ONVIF conformant products page devices that conform with profiles G, S, or T), or You can leverage simulated video stream that we ship as part of this template for demonstrations.
-
Linux server powered by your choice of Intel® acceleration technology (CPUs such as Atom, Core, Xeon, or FPGAs, or VPUs)
-
Azure subscription to host relevant cloud services.
Don’t forget to check out the IoT Show episode for application template details.
ASK: Try out our comprehensive tutorial that will walk you through the creation of a Video Analytics solution in just a few hours.
Get started today
- You can use the new Video Analytics for Object & Motion Detection template to build and deploy your live video analytics solution.
- You can build Video Analytics solution within hours by leveraging Azure IoT Central, Live Video Analytics, and Intel.
- You can learn more about Live Video Analytics on IoT Edge here, and try out some of the other video analytics scenarios via the quickstarts and tutorials here. These show you how you can leverage open source AI models such as those in the Open Model Zoo repository or YOLOv3, or custom models that you have built, to analyze live video.
- You can learn more about the OpenVINO™ Inference server by Intel® in Azure marketplace and its underlying technologies here. You can access developer kits to learn how to accelerate edge workloads using Intel®-based accelerators CPUs, iGPUs, VPUs and FPGAs. You can select from a wide range of AI Models from Open Model Zoo
by Contributed | Sep 28, 2020 | Azure, Technology, Uncategorized
This article is contributed. See the original author and article here.
Written in collaboration with @Chris Boehm and @aprakash13
Introduction
Readers of this post will hopefully be familiar with both Azure Sentinel and Azure WAF. The idea we will be discussing is how to take the log data generated by WAF and do something useful with it in Sentinel, such as visualize patterns, detect potentially malicious activities, and respond to threats. If configured and tuned correctly (a topic for another post), Azure WAF will prevent attacks against your web applications. However, leaving WAF alone to do its job is not enough; security teams need to analyze the data to determine where improvements can be made and where extra action may be required on the part of response teams.
Send WAF Data to Sentinel
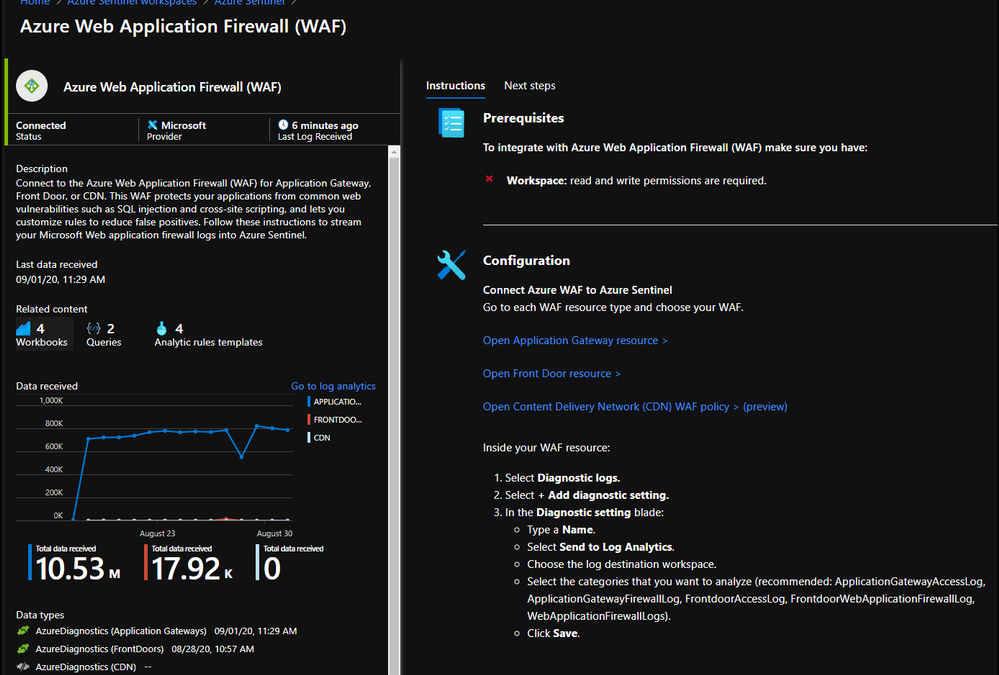
The first step to integrating these tools is to send WAF logs and other relevant data, such as access logs and metrics, to Sentinel. This process can be initiated using the built-in Sentinel Data Connector for Azure WAF:

Once you have connected your WAF data sources to Azure Sentinel, you can visualize and monitor the data using Workbooks, which provide versatility in creating custom dashboards. Looking inside the Azure Sentinel Workbooks tab, look up the default Azure WAF Workbook template to get you started with all WAF data types.

When starting out with the Microsoft WAF Workbook, you’ll be faced with a few data filter options:
In the short annotation below, you’ll be taken through a few preconfigured filters, two different subscriptions (across two different tenants), while having preselected two different workspaces. The annotation is going to walk through a SQL Injection attack that was detected and how you can filter down the information by time or by event data. Like an IPAddress or Tracking ID provided by the diagnostic logs.
If you’re unfamiliar with a workbook, the design is a top to bottom filter experience. If you filter the top of the workbook, it’ll filter everything below with the selected filters above. You’ll see some filters that were not selected, example being “Blocked or Matched” within the logs, or the Blocked Request URI Addresses. Both could have been selected and filtered across the workbook.

Hunting Using WAF Data
The core idea of Azure Sentinel is that relevant security regarding your hunting or investigation is produced in multiple locations/logs and being able to analyze them from a single point makes it easier to spot trends and see patterns that are out of the ordinary. The logs from our Azure WAF device is one critical part of this puzzle. As more and more companies move their applications to the cloud their Web Application security posture has become super relevant in their overall security framework. Through the WAF logs, we can analyze the application traffic and combine it with other data feeds to uncover various attack patterns that an organization needs to be aware of.
However, to be able to effectively use the telemetry from WAF, a general understanding of the WAF logs is critical. It is very hard to focus on the hunting mission, be productive and effective if we don’t understand the data. WAF data is collected in Azure Sentinel under the AzureDiagnostics table. Depending on whether the Azure WAF policy is applied to web applications hosted on Application Gateway or Azure Front Doors the category under which the logs are collected are a little different.
While we don’t cover this thoroughly in this post, WAF Policies can be applied to CDN; more information here. When applied to CDN, the relevant logs are under the category:
- WebApplicationFirewallLogs (set on the WAF Policy)
- AzureCdnAccessLog (set on the CDN Profile)
There are subtle and nuanced differences between both these log types (Application Gateway vs Front Door) however in general, when we talk about the Access Logs, they give us an idea about Application’s access patterns. The firewall logs on the other hand logs any request that matches a WAF rule through either detection or prevention mode of the WAF policy. These logs include a bunch of interesting information like the caller’s IP, port, requested URL, UserAgent and bytes in and out. The Azure Sentinel GitHub repository is a great source of inspiration for the kind of hunting and detection queries that one can build with some of these fields. However, let us go through a couple of examples of what we can do with this data.
One of the techniques that a lot of threat hunters have in their arsenal is count based hunting i.e. they aggregate the event data and look for events that crosses a particular threshold. For example, in the WAF data we could probably look for a number of sessions originating from a particular client IP address in a given interval of time. Once the number of connections exceeds a particular threshold value, an alert could be triggered for further investigation.
However, since each environment is different, we will have to modify the threshold value accordingly. Additionally, IP based session tracking have their own challenges and false positives due to various dynamic factors like Proxy/NAT etc. that we would have to be mindful of for these type of queries.
let Threshold = 200;  //Adjust the threshold to a suitable value based on Environment, Time Period.

let AllData =  AzureDiagnostics

| where TimeGenerated >= ago(1d)

| where Category in ("FrontdoorWebApplicationFirewallLog", "FrontdoorAccessLog", "ApplicationGatewayFirewallLog", "ApplicationGatewayAccessLog")

| extend ClientIPAddress = iff( Category in ("FrontdoorWebApplicationFirewallLog", "ApplicationGatewayAccessLog"), clientIP_s, clientIp_s);

let SuspiciousIP = AzureDiagnostics

| where TimeGenerated >= ago(1d)

| where Category in ( "ApplicationGatewayFirewallLog", "ApplicationGatewayAccessLog", "FrontdoorWebApplicationFirewallLog", "FrontdoorAccessLog")

| extend ClientIPAddress = iff( Category in ("FrontdoorWebApplicationFirewallLog", "ApplicationGatewayAccessLog"), clientIP_s, clientIp_s)

| extend SessionTrackingID = iff( Category in ("FrontdoorWebApplicationFirewallLog", "FrontdoorAccessLog"), trackingReference_s, transactionId_g)

| distinct  ClientIPAddress, SessionTrackingID

| summarize count() by ClientIPAddress

| where count_ > Threshold

| distinct ClientIPAddress;

SuspiciousIP

| join kind = inner ( AllData) on ClientIPAddress

| extend SessionTrackingID = iff( Category in ("FrontdoorWebApplicationFirewallLog", "FrontdoorAccessLog"), trackingReference_s, transactionId_g)

| summarize makeset(requestUri_s), makeset(requestQuery_s), makeset(SessionTrackingID), makeset(clientPort_d),  SessionCount = count() by ClientIPAddress, _ResourceId

| extend HostCustomEntity =  _ResourceId, IPCustomEntity = ClientIPAddress
Another way to leverage the WAF data could be through Indicators of Compromise (IoCs) matching. IoCs are data that associates observations such as URLs, file hashes or IP addresses with known threat activity such as phishing, botnets, or malware. Many organizations aggregate threat indicators feed from a variety of sources, curate the data and then apply it to their available logs. They could match these IoCs with their WAF logs as well. For more details check out this great blog post that talks about how you can import threat intelligence (TI) data into Azure Sentinel. Once the TI data is imported in Azure Sentinel you can view it in the ThreatIntelligenceIndicator table in Logs. Below is a quick example of how you can match the WAF data with the TI data to see if there is any traffic that is originating from a Bot Network or from an IP that is known to be bad.
let dt_lookBack  = 1h;

let ioc_lookBack = 14d;

ThreatIntelligenceIndicator

| where TimeGenerated >= ago(ioc_lookBack) and ExpirationDateTime > now()

| where Active == true

// Picking up only IOC's that contain the entities we want

| where isnotempty(NetworkIP) or isnotempty(EmailSourceIpAddress) or isnotempty(NetworkDestinationIP) or isnotempty(NetworkSourceIP)

// As there is potentially more than 1 indicator type for matching IP, taking NetworkIP first, then others if that is empty.

// Taking the first non-empty value based on potential IOC match availability

| extend TI_ipEntity = iff(isnotempty(NetworkIP), NetworkIP, NetworkDestinationIP)

| extend TI_ipEntity = iff(isempty(TI_ipEntity) and isnotempty(NetworkSourceIP), NetworkSourceIP, TI_ipEntity)

| extend TI_ipEntity = iff(isempty(TI_ipEntity) and isnotempty(EmailSourceIpAddress), EmailSourceIpAddress, TI_ipEntity)

| join (

AzureDiagnostics | where TimeGenerated >= ago(dt_lookBack)

| where Category in ( 'ApplicationGatewayFirewallLog', 'FrontdoorWebApplicationFirewallLog', 'ApplicationGatewayAccessLog', 'FrontdoorAccessLog')

| where isnotempty(clientIP_s) or isnotempty(clientIp_s)

| extend ClientIPAddress = iff( Category in ("FrontdoorWebApplicationFirewallLog", "ApplicationGatewayAccessLog"), clientIP_s, clientIp_s)

| extend WAF_TimeGenerated = TimeGenerated

)

on $left.TI_ipEntity == $right.ClientIPAddress

| project TimeGenerated, ClientIPAddress, Description, ActivityGroupNames, IndicatorId, ThreatType, ExpirationDateTime, ConfidenceScore,_ResourceId, WAF_TimeGenerated, Category, ResourceGroup, SubscriptionId, ResourceType,OperationName, requestUri_s, ruleName_s, host_s, clientPort_d,details_data_s, details_matches_s, Message, ruleSetType_s, policyScope_s

| extend IPCustomEntity = ClientIPAddress, HostCustomEntity = _ResourceId, timestamp = WAF_TimeGenerated, URLCustomEntity = requestUri_s
Threat hunters could even leverage KQL advanced modelling capabilities on WAF logs to find anomalies. For example, they could do the Time Series analysis on the WAF data. Time Series is a series of data points indexed (or listed or graphed) in time order. By analyzing time series data over an extended period, we can identify time-based patterns (e.g. seasonality, trend etc.) in the data and extract meaningful statistics which can help in flagging outliers. The different Thresholds would have to be adjusted depending on the environment.
Below is an example query demonstrating Time Series IP anomaly.
let percentotalthreshold = 25;

let timeframe = 1h;

let starttime = 14d;

let endtime = 1d;

let scorethreshold = 5;

let baselinethreshold = 10;

let TimeSeriesData =  AzureDiagnostics

  | where Category in ( "ApplicationGatewayFirewallLog", "ApplicationGatewayAccessLog", "FrontdoorWebApplicationFirewallLog", "FrontdoorAccessLog") and action_s in ( "Log", "Matched", "Detcted")

  | where isnotempty(clientIP_s) or isnotempty(clientIp_s)

  | extend ClientIPAddress = iff( Category in ("FrontdoorWebApplicationFirewallLog", "ApplicationGatewayAccessLog"), clientIP_s, clientIp_s)

  | where TimeGenerated between ((ago(starttime))..(ago(endtime)))

  | project TimeGenerated, ClientIPAddress

  | make-series Total=count() on TimeGenerated from (ago(starttime)) to (ago(endtime)) step timeframe by ClientIPAddress;

let TimeSeriesAlerts=TimeSeriesData

  | extend (anomalies, score, baseline) = series_decompose_anomalies(Total, scorethreshold, 1, 'linefit')

  | mv-expand Total to typeof(double), TimeGenerated to typeof(datetime), anomalies to typeof(double),score to typeof(double), baseline to typeof(long)

  | where anomalies > 0 | extend score = round(score,2), AnomalyHour = TimeGenerated

  | project ClientIPAddress, AnomalyHour, TimeGenerated, Total, baseline, anomalies, score

  | where baseline > baselinethreshold;

  TimeSeriesAlerts

  | join (

      AzureDiagnostics

      | extend ClientIPAddress = iff( Category in ("FrontdoorWebApplicationFirewallLog", "ApplicationGatewayAccessLog"), clientIP_s, clientIp_s)

  | where isnotempty(ClientIPAddress)

  | where TimeGenerated  > ago(endtime)

  | summarize HourlyCount = count(), TimeGeneratedMax = arg_max(TimeGenerated, *), ClientIPlist = make_set(clientIP_s), Portlist = make_set(clientPort_d) by clientIP_s, TimeGeneratedHour= bin(TimeGenerated, 1h)

  | extend AnomalyHour = TimeGeneratedHour

  ) on ClientIPAddress

  | extend PercentTotal = round((HourlyCount / Total) * 100, 3)

  | where PercentTotal > percentotalthreshold

  | project  AnomalyHour, TimeGeneratedMax, ClientIPAddress, ClientIPlist, Portlist, HourlyCount, PercentTotal, Total, baseline, score, anomalies, requestUri_s, trackingReference_s, _ResourceId, SubscriptionId, ruleName_s, hostname_s, policy_s, action_s

  | summarize HourlyCount=sum(HourlyCount), StartTimeUtc=min(TimeGeneratedMax), EndTimeUtc=max(TimeGeneratedMax), SourceIPlist = make_set(ClientIPAddress), Portlist = make_set(Portlist) by ClientIPAddress , AnomalyHour, Total, baseline, score, anomalies, requestUri_s, trackingReference_s, _ResourceId, SubscriptionId, ruleName_s, hostname_s, policy_s, action_s

  | extend HostCustomEntity =  _ResourceId, IPCustomEntity = ClientIPAddress
Generate Incidents using Azure Sentinel Analytics
Azure Sentinel uses the concept of Analytics to accomplish Incident creation, alerting, and eventually automated response. The main piece of any Analytic rule is the KQL query that powers it. If the query returns data (over a configured threshold), an alert will fire. To use this in practice, you need to craft a query that returns results worthy of an alert.
The logic used can be complex, possibly adapted from the hunting logic outlined above, or fairly basic like the example below. It can be difficult to know what combination of WAF events warrant attention from analysts or even an automated response. We will assume the WAF has been tuned to eliminate most false positives, and that rule matches are usually indicative of malicious behavior.
The Analytic Rule we will look at serves the purpose of detecting repeated attacks from the same source IP address. We simply look for WAF rule matches, which amount to traffic being blocked with WAF in Prevention Mode, and count how many there have been from the same IP in the last 5 minutes. The thinking is that if a single source is repeatedly triggering blocks, they must be up to no good.
AzureDiagnostics

| where Category == "FrontdoorWebApplicationFirewallLog"

| where action_s == "Block"

| summarize StartTime = min(TimeGenerated), EndTime = max(TimeGenerated), count() by clientIP_s, host_s, _ResourceId

| where count_ >= 3

| extend clientIP_s, host_s, count_, _ResourceId

| extend IPCustomEntity = clientIP_s

| extend URLCustomEntity = host_s

| extend HostCustomEntity = _ResourceId
Notice that we are using entity mapping for the resource ID of the Front Door that blocked the requests; this becomes important when creating response actions with Playbooks. The full details of our example analytic can be seen in the screen capture below:

With this Analytic active, any source IP address that generates 3 or more rule matches in 5 minutes will generate an alert and incident. A playbook will also be automatically triggered, which is covered in the next section.
Respond to Incidents with Playbooks
A Sentinel Playbook is what is used to execute actions in response to Incidents. Playbooks are mostly the same as Logic Apps, which are mostly the same as Power Automate. Sentinel Playbooks always start with the Sentinel trigger, which will pass dynamic content into the Logic App pipeline. Specifically, we are looking for the Resource ID of the Front Door (the Playbook also supports Application Gateway) in order to look up the information needed to perform the remediation actions.
From the example in the Analytics section, we have detected multiple WAF rule matches from the same IP address, and we want to block any further action this attacker attempts. Of course the attacker could just keep attempting to exploit the application from different IP addresses, as they often do, but automatically blocking each IP is a low effort method to make the payoff as difficult as possible.
The end goal of this Playbook is to create or modify a custom rule in a WAF Policy to block requests from a certain IP address. This is accomplished using the Azure REST API using the following broad steps:
- Set variables and parse entities from the Incident
- Check WAF type – Front Door or App Gateway
- Get the associated WAF Policy
- Read existing custom rules and store in an array
- If an existing rule called “SentinelBlockIP” exists, add the attacking IP to the rule
- If no rule exists yet, create a custom rule blocking the attacking IP
- Re-assemble the WAF Policy JSON with the new or updated custom rule
- Initiate a PUT request against the Azure REST API to update the WAF Policy
Here is what the Playbook looks like:

This playbook can be deployed from our GitHub repository.
To see everything we covered in this post and more in video format, check it out here.
It is our hope that you now have the tools and skills needed to take log data from Azure WAF and use it in Azure Sentinel to detect, investigate, and automatically respond to threats against your web applications.


Recent Comments