by Scott Muniz | Sep 22, 2020 | Uncategorized
This article is contributed. See the original author and article here.
Microsoft is launching the new Power Platform developer role to focus on implementing Power Platform solutions, and we need beta participants.
Do you design, develop, secure, and troubleshoot Power Platform solutions? Do you implement components of a solution that include application enhancements, custom user experience, system integrations, data conversions, custom process automation, and custom visualizations? Do you have strong applied knowledge of Power Platform services, including in-depth understanding of capabilities, boundaries, and constraints? If so, this beta exam is for you!
The new Microsoft Certified: Power Platform Developer Associate certification has one exam that is currently in beta: Exam PL-200: Microsoft Power Platform Developer.
To receive the 80% discount*, use code PL400Isin when prompted for payment.
This is NOT a private access code. You can use this code to register for and take the exam on or before 10/26/2020.
*The first 300 people who register can take these exams for an 80% discount! (Why beta exams are no longer free.) The seats are offered on a first-come, first-served basis. You must register for the exam on or before 10/26/2020. Take the exam as soon as possible, so we can leverage your comments, feedback, and exam data in our evaluation of the quality of the questions.
Preparing for Beta Exams
Taking a beta exam is your chance to have a voice in the questions we include on the exam when it goes live. The rescore process starts on the day that exams go live, and final scores are released approximately 10 days later. For updates on when the rescore is complete, follow me on Twitter (@libertymunson). For questions about the timing of beta exam scoring and live exam release, see the blog posts The Path from Beta Exam to Live Exam and More Tips About Beta Exams.
Remember, the number of spots is limited, so when they’re gone, they’re gone. You should also be aware that there are some countries where the beta code will not work (including Turkey, Pakistan, India, and China). You will not be able to take the beta exam in those countries.
Also keep in mind that these exams are in beta, which means that you will not be scored immediately. You will receive your final score and passing status after your exam is live.
Related announcements
Announcing three new Microsoft Certifications for Business Applications
Skill up and stand out, with new role-based training and certification!
New role-based certification and training is here, and we’re just getting started!
Catching up: continuing our journey with new role-based certifications and training
by Scott Muniz | Sep 22, 2020 | Azure, Technology, Uncategorized
This article is contributed. See the original author and article here.
Hosting SSRS databases in Azure SQL Managed Instance
This article outlines the spectrum of options available for migrating your solutions based on the SQL Server Reporting Services (SSRS) to Microsoft cloud, with focus on the newly-introduced support for hosting SSRS databases in Azure SQL Managed Instance.
Modernizing at your own pace
In times of uncertainty, it’s important to have a flexibility to take approach that makes the most sense for your business. Some organizations slow down to operate more cost-effectively and play as safe as possible, while others lean into new opportunities that didn’t exist before.
Same goes for the appetite for modernization while migrating to Microsoft cloud: you may decide to simply lift and shift your solutions, and still benefit instantaneously from certain capabilities available in cloud only, or you can aim for migrating to cloud native SaaS and PaaS solutions that may require adopting new concepts, but also may be way more rewarding in terms of the modernization, out-of-the-box capabilities offered, and new scenarios unlocked.
SQL Server vs. SQL Server database engine
Azure SQL as a family of managed, secure, and intelligent SQL database services is a good example of flexibility offered when migrating your solutions to Azure. The entire Azure SQL family is built upon the same SQL Server database engine, so your skills and experience transfer easily to the cloud. Still, you are in control of the level of change you want to introduce, by choosing one of the available database services – SQL Server on Azure Virtual Machine, SQL Managed Instance, or SQL Database.
However, your solutions may be leveraging SQL Server capabilities beyond its database engine as a core component. Let’s name a few most used ones:
Integration Services (SSIS) – platform for building data integration and transformation solutions,
Analysis Services (SSAS) – analytical data engine with tabular and multidimensional mode,
Reporting Services (SSRS) – tools and services for creating and managing paginated reports.
For each of these powerful and widely adopted SQL Server capabilities there is a choice of options for migration to Microsoft cloud: you can always opt for the simple lift-and-shift approach and host them on the SQL Server on Azure Virtual Machine, resembling the layout from your on-premises environment, or you can decide to leverage equivalent cloud native offerings.
When it comes to hosting SQL Server Reporting Services (SSRS) in the Microsoft cloud, there are two main options:
- Moving your SSRS paginated reports to the Power Bi Premium service
- Deploying SQL Server Reporting Services virtual machine
The second option has a couple of variations, and to be able to differentiate between the variations we should note that SSRS consists of two components: report server which is a stateless engine of the SSRS, and report server databases storing metadata and temporary report results.
SSRS uses two databases to separate persistent data storage from temporary storage requirements. The databases are created together during the installation of SSRS and bound by name. By default, the database names are ReportServer and ReportServerTempDB, respectively.
Earlier mentioned variations pertain to where report server databases are being hosted, and we’ll explain the difference as we go through the options.
Moving your SSRS paginated reports to the Power Bi Premium service
SSRS paginated reports are optimized for printing or PDF generation, providing you with the ability to produce highly formatted, pixel-perfect layouts. Typical use case for paginated reports are operational reports like sales invoice, or profit and loss statement.
In contrast, typical Power BI report is optimized for exploration and interactivity – you can easily slice and dice data, discover relationships and patterns, in other words it’s ideal for analytical reports.
Obviously, both types of reports remain important and having both types in one place, sharing the infrastructure of Power BI service, including the search, monitoring and auditing capabilities provides a great benefit. You can also drill through from the Power BI report to a paginated report, embed paginated report, or share its content through a Power BI app. Check the Paginated reports in Power BI FAQ for more details.
To migrate your existing paginated reports in the Report Definition Language (RDL), you can use RDL Migration Tool written by Microsoft and available on GitHub. More detailed guidance on the entire migration process is provided in the Migrate SQL Server Reporting Services reports to Power BI article.
There are currently few limitations that you may need to circumvent to be able to migrate your SSRS reports to Power BI. Also, note that publishing paginated reports in Power BI requires Premium subscription.
Deploying SSRS on SQL Server on Azure Virtual Machine
If you are rather interested in a quick lift and shift of your existing SSRS solution, you can simply deploy SSRS on Azure Virtual Machine, just like on any (virtual) machine on premises. Here you have a full freedom of choice among the supported version of Reporting Services, so you can even use the same version that you are using on premises.
You can reuse the same Azure Virtual Machine for SQL Server database engine to store report server databases. Choosing a local instance is useful if you have sufficient system resources or if you want to save on software licenses. On the other hand, running the report server databases on another instance of SQL Server can improve performance.
While SQL Server on Azure Virtual Machine offers some automated manageability features like automatic backups and security patching, note that other aspects like configuring and maintaining high availability through Always On Availability Groups are not provided by the platform.
(New) Hosting report server databases in Azure SQL Managed Instance
This leads us to the variation that you may find useful if you are fan of fully managed database services, eliminating need for managing the database engine manually. With this approach, your stateless report server installed on Azure Virtual Machine connects to report server databases hosted on Azure SQL Managed Instance. High availability of databases here comes out of the box, with 99.99% availability SLA. You can leverage auto-failover groups as a disaster recovery solution for the most critical solutions, or geo-restore capability for less critical ones. You can also use point-in-time restore (PITR) functionality to recover from accidental report changes.
If your SSRS reports are pulling the data from databases hosted on Azure SQL Managed Instance, it’s reasonable to host report server databases on the same instance, thus minimizing the database engine footprint.
SQL Server 2019 Reporting Services come with native support for hosting report server databases in Azure SQL Managed Instance – just point your SSRS to the instance during the setup, or re-point the existing installation using SSRS Configuration Manager. You can also restore a backup of your report server database from on-premises SQL Server on Azure SQL Managed Instance.
If you’d rather keep the older supported version of SSRS that you are using on premises, you can still host report server databases on Azure SQL Managed Instance. You should just configure the instance before installing legacy version of SSRS on Azure Virtual Machine. Configuration steps are very simple and ensure that some of the commands issued during the installation process by legacy versions of SSRS, that has been eliminated in SSRS 2019, are safely ignored by SQL Managed Instance:
-- Turn the advanced configuration options on:
sp_configure 'show advanced options', 1 ;
GO
RECONFIGURE;
GO

-- Enable suppression of error messages for recovery model change:
sp_configure 'suppress recovery model errors', 1 ;
GO
RECONFIGURE;
GO
Visit Suppress recovery model errors server configuration option to learn more about this configuration option.
Conclusion
There are multiple options to choose among when deciding on the approach for moving your SSRS solution(s) to Microsoft cloud. Options cover the entire spectrum from Infrastructure-as-a-Service (IaaS) solutions offering completely the same experience as with on-premises SQL Server enriched with some management automation options, through leveraging Platform-as-a-Service (PaaS) solution for hosting report server databases on Azure SQL Managed Instance (newly-introduced option), all the way to Software-as-a-Service (SaaS) solution with SSRS paginated reports in Power BI service. This flexibility allows you to modernize at the pace that makes the most sense for your business.
by Scott Muniz | Sep 22, 2020 | Uncategorized
This article is contributed. See the original author and article here.
Get Help with Teams Issues Faster Using Logs
We all run into various technical issues from time. When we do, we want to get help fast! One way to help ensure your support ticket gets resolved quickly and effectively is to include the debug logs from within Microsoft Teams.
Support engineers rely on debug logs to help identify issues with significantly more speed and accuracy. Having these logs on hand to include with a support request will allow Microsoft to pinpoint where a problem may exist and troubleshoot it more effectively.
We know that student data privacy is a top priority. The information included in debug logs does not include sensitive student data. Only data related to logins, connection requests, and call quality are provided to engineers for the explicit use of troubleshooting issues within Teams.
Exporting debug logs within Teams is easy. Depending on the device you are working with, use the following keyboard combinations to download a debug log:
|
Windows
|
Mac OSX
|
Linux
|
|
Ctrl + Alt + Shift + 1
|
Option + Command + Shift+1
|
Ctrl + Alt + Shift + 1
|
The debug logs are automatically downloaded to the following folders:
|
Windows
|
Mac OSX
|
Linux
|
Browser
|
|
%userprofile%Downloads
|
Downloads
|
~/Downloads
|
Follow browser prompts for location.
|
For mobile devices, include the model of the device with your ticket and the version of Teams you are using. To find these details within teams go to More > Settings > About.
Our goal is to provide you with the quickest support possible. Providing logs with your support requests is one of the best ways to ensure tickets are handled as speedily as possible.
Happy learning!
by Scott Muniz | Sep 22, 2020 | Uncategorized
This article is contributed. See the original author and article here.
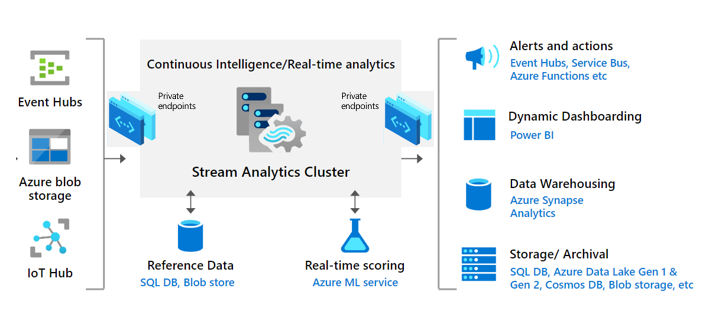
Stream Analytics allows you to easily build a real-time analytics pipeline on Azure within minutes. Our customers love the zero-code integrations with other Azure services and the ability to easily write complex analytics logic using simple SQL language. We have heard it loud and clear that our customers want to secure their streaming jobs to securely connect to their resources on Azure.
Today, we are excited to announce the public preview of Stream Analytics cluster – a new single-tenant (Dedicated) SKU with support for Azure Virtual Network (VNet). This SKU is ideal for customers with medium to large streaming workloads and strong enterprise security requirements.

Stream Analytics cluster’s capacity is measured in Streaming Units (SUs) which represents the amount of CPU and memory resources allocated to your cluster. The cost and value of a Streaming Unit is the same across existing Standard and Dedicated SKUs. The minimum size of a cluster is 36 SUs and the same cluster can be shared by various Stream Analytics jobs running across your development, test and production subscriptions within your organization.
The core of this offering is the same engine that powers Stream Analytics jobs running in a multi-tenant environment. The single tenant, dedicated cluster provides the following benefits:
- Single tenant hosting with no noise from other tenants – your resources are truly “isolated” and perform better to handle any burst in traffic.
- Scale your cluster between 36 to 216 SUs as your streaming usage increases over time. Larger sizes will be offered in the future.
- VNet support that allows your Stream Analytics jobs to connect to your resources securely using private endpoints.
- Ability to author C# user-defined functions and custom deserializers in any region of your choice.
- Zero maintenance cost allowing you to focus your effort on building real time analytics solutions.

Network isolation behind the scenes
Stream Analytics provides a fully managed experience to connect ASA jobs to your resources using private link. creating a cluster, it takes 2 simple steps to securely connect streaming jobs to your resource (inputs/outputs):
- In your Stream Analytics cluster, create a private endpoint for input/output resource (e.g., Event Hubs)
- Go to the input/output resource (e.g., Event Hubs) and approve the private endpoint connection request from the cluster.
Stream Analytics clusters VNet support by taking care of all the heavy lifting behind the scenes. When you create a Stream Analytics cluster, all the necessary resources for you cluster are created inside a VNet that is dedicated to you. When you create a private endpoint in your Stream Analytics cluster, we create and manage that private endpoint resource to provide a seamless experience.
Managed Identity authentication for Event Hubs inputs and outputs
We are eager to solve the security needs of customers who may not have a large streaming workload to justify an entire Stream Analytics cluster. To address this, we will soon be rolling out support for Managed Identity authentication to Event Hub inputs/outputs. This will allow you to connect ASA jobs to Event Hubs that are behind a firewall or a VNet – as long as you have enabled “Allow trusted services” networking settings on the Event Hub side.
This does not provide blanket approval for any ASA job to access your Event Hubs as you must grant access to each of you ASA jobs individually thereby maintaining a secure link between the resources. This approach of using Managed Identity authentication along with enabling “allow trusted services” is already supported for Azure Blob stream inputs & outputs, Azure Blob reference data input, Azure Data Lake Storage Gen2 output and will be extended to support other
Getting started
Stream Analytics clusters (preview) will be rolled out to West Central US by this week and quickly followed by all other regions worldwide. We hope you take full advantage of this functionality and are excited to see what you build with Stream Analytics.
The Azure Stream Analytics team is highly committed to listening to your feedback. We welcome you to join the conversation and make your voice heard via our UserVoice. You can stay up-to-date on the latest announcements by following us on Twitter @AzureStreaming. If you have any questions or run into any issues accessing the public preview, you can also reach out to us at askasa [at] microsoft [dot] com .
by Scott Muniz | Sep 22, 2020 | Uncategorized
This article is contributed. See the original author and article here.
This installment is part of a broader series to keep you up to date with the latest features in Azure Sentinel. The installments will be bite-sized to enable you to easily digest the new content.
Threat intelligence indicators represent data describing known existing or potential threats to systems and users. Threat intelligence addresses many of the challenges Security Operation Centers (SOCs) are faced with today; as a result, successful SOCs are leveraging threat intelligence to improve efficiency in their threat detection, investigation, and response. Here is an example use case of how SOCs use threat intelligence to protect their organizations’ environment. Threat intelligence data provides alert enrichment with additional valuable context such as Severity information, associated Threat Types, and Confidence scores. With such critical information, SOC analysts can make faster and more data-backed decisions in alert validation and prioritization, which helps expedite the incident triage, reduce false positives, and improve the incident analysis.
If your organization works with threat intelligence indicators, having a centralized location to efficiently manage your threat intelligence data is crucial to the success of your threat intelligence research and integration experience. To address this need, we are delighted to announce that the threat intelligence menu item is now available in the Azure Sentinel portal! The menu item serves as a single pane of glass for your SOC personnel to view, create, edit, search, sort, and filter your threat intelligence data.
How to enable and use the new threat intelligence menu item
In your Azure Sentinel portal, navigate to the Threat Management menu, and select Threat Intelligence (Preview). Below are examples of some of the capabilities you can leverage the threat intelligence menu item today.
View indicators
The threat intelligence menu item enables you to conveniently view and access both your custom threat intelligence indicators that you have already created via the User Interface and imported threat intelligence data from external data sources without writing Log Analytics query.
 View indicators
Add and delete a new indicator
Previously, to send threat intelligence data into your Azure Sentinel workspace, you would need to utilize the Threat Intelligence Platform (TIP) and TAXII Server data connectors. With the new threat intelligence menu item, you can now also create your own custom threat intelligence indicators directly on the Azure Sentinel User Interface. This can be done easily using the “Add new” button on the hero banner of the threat intelligence menu item.
Deleting an indicator is just as easy as one click using the “Delete” button on the same User Interface.
 Add and delete an indicator
Tag an indicator
Tagging is used to categorize and group threat indicators together. Here is an actual example of how you can use tagging. Suppose you are investigating a potential attack and find that the indicator is part of that particular incident, then you can add the incident ID in your desired nomenclature, for example, IncidentID : 1234 to the indicator in Tags. You can later go back to search for all the indicators associated with the incident using the same tag.
 Tag an indicator
Edit an indicator
If an indicator is created on the Azure Sentinel User Interface using the “Add new” button, it can be edited at any point in time. To distinguish indicators based on where they are imported from, you can use the Source column on the threat intelligence menu item.
If a threat indicator has the Source column as SecurityGraph then it is imported using the threat intelligence – Platforms data connector.
If the Source column is Azure Sentinel then the indicator is created on the Sentinel User Interface using the “Add new” button on the threat intelligence menu item.
If the Source column is the friendly name of TAXII Server that you have connected via Sentinel, then it is imported using the threat intelligence – TAXII data connector.
Only indicators that have Source as Azure Sentinel can be edited due to security reasons.
 Edit an indicator
Search, Sort, and Filter indicators
With the new threat intelligence menu item, you can easily search for your specific indicators by their Name, Tags, Values, and Description.
The menu item also enables you to sort the indicators by different columns. Currently you can sort them by Name, Source, and Confidence field.
Additionally, filtering indicators can also be done on the Azure Sentinel User Interface by Type, Source, Confidence, Valid Until, and Threat Type.
 Search, sort, filter indicators
Guides and feedback
The “Guides & Feedback” panel provides guidance on how to maximize the use of the threat intelligence. It also gives you the opportunity to share your ideas and experience with our core engineering team and vote/add your ideas on the Azure Sentinel user voice platform.
 Guides & feedback
These are just a few highlights of the threat intelligence menu item. For a full list of the functionalities and the step-by-step instruction on how to use a certain feature on there, please refer to the documentation.
Get started today!
We encourage you to use the new threat intelligence menu item to improve efficiency in managing your threat intelligence data in your environment.
Try it out, and let us know what you think!
You can also contribute new connectors, workbooks, analytics and more in Azure Sentinel. Get started now by joining the Azure Sentinel Threat Hunters GitHub community.

Recent Comments