How to align your Analytics with time windows in Azure Sentinel using KQL (Kusto Query Language)
This article is contributed. See the original author and article here.
Overview
Thanks to Ofer Shezaf, Kieran Bhardwaj and Younes Khaldi for the ideas and proof reading!
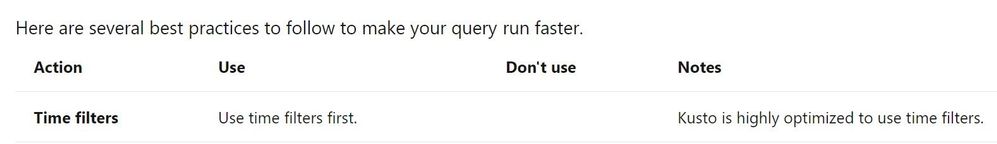
Many of the query examples you see in KQL (Kusto Query Language) Detections, Rules, Hunting and Workbooks use a time filter. In fact, the first recommendation in the best practices section is:

Source: https://docs.microsoft.com/en-us/azure/data-explorer/kusto/query/best-practices
Now I will show you some hopefully simple but useful query examples (and I’ll use the demo data we provide for free so you can try these).
Please click the links provided, all you need is a Microsoft account to grant you access to our extensive demo data.
You should also get familiar with the timespan literals: https://docs.microsoft.com/en-us/azure/data-explorer/kusto/query/scalar-data-types/timespan
Query Examples
1. This first example looks back one day in time (looking back over the last 24hrs, from the moment you run the query); you can use 24h instead of 1d if you prefer.
I prefer using 1d rather than 24hrs, typically I only use hours when I need a partial day i.e. 6h
This form of time span filter is one of the most common lines people add to a query.
Please read on for an explanation on why this may not be what you intended, and ways to improve.
Go to Log Analytics and run query
SecurityEvent
| where TimeGenerated > ago(1d)
2. You can also look between a range. Here I look back 7days from now (today at this current time).
Notice in the last line, I show the oldest record and the latest that are returned – I’ll do this for many of the examples just so you can see how the query is working, I wouldn’t normally expect you to use them in a real query – only to test or when you need to show that level of detail.
I’ll also have some more real life queries at the end of this article, but for now I’ll keep them basic and simple.
Go to Log Analytics and run query
SecurityEvent
| where TimeGenerated between (ago(7d) .. now() )
| summarize min(TimeGenerated), max(TimeGenerated)
Result:
| min_TimeGenerated | max_TimeGenerated |
|---|---|
| 2020-09-08T08:23:39.887Z | 2020-09-15T08:23:29.323Z |
The above is really just a longer way of writing the example in query 1 as it went to now() anyway. It does allow you however to amend it to this, where we look between 7 and 5 days ago.
SecurityEvent
| where TimeGenerated between (ago(7d) .. ago(5d) )
| summarize min(TimeGenerated), max(TimeGenerated)
Read on, in example 4 we will make these results more accurate/predictable.
3. During investigations you may have a date and time range in mind, or you wish to reduce the data volume returned.
Tip: You can use Top or Limit to help reduce the amount of returned data. Please look at the supplied help links for examples.
You can amend the query (#2) to provide an actual date / time.
Notice, this gets data from 1st July through to 30th July, but only until 9am (I added this to show you can do both date and time in the one syntax).
This is especially useful for looking maybe at your online business day or a known period that you are particularly interested in.
Go to Log Analytics and run query
SecurityEvent
| where TimeGenerated between ( datetime(2020-07-01) .. datetime(2020-07-30, 09:00) )
| summarize min(TimeGenerated), max(TimeGenerated)
4. Here is where I see issues with many queries, just like the queries above which are using now as a point in time to pivot on. i.e. Show the data from now until 1day ago.
This will mean that the returned data will change each time you run the query, which may give unpredictable or undesirable results.
I have seen many issues in the past due to this, questions are often asked on the forums, asking where the data has gone, as it “was there when I last ran the query” – this is often due to this form of syntax being used, now() or ago().
We can solve this with a powerful function called startofday(), and don’t worry there are other functions as well, read on for those!
Go to Log Analytics and run query
SecurityEvent
| where TimeGenerated > startofday(ago(1d))
| summarize min(TimeGenerated), max(TimeGenerated)
Result:
| min_TimeGenerated | max_TimeGenerated |
|---|---|
| 2020-09-14T00:00:00.103Z | 2020-09-15T08:37:10.497Z |
In this example using startofday, we are saying go from ‘the start of day’ (the first record found after mid-night) until the end time. So in this query startofday(ago(1d)) is a fixed point in time close to midnight one day ago, until now() – so you are seeing more that one days worth of data.
Tip: This can also make your charts look better, as you get a full day of data at each end of the y-axis.
5. We can now combine startofday() and with another function called endofday().
This query guarantees you have data between two fixed points. So you should always get the same results between query executions.
As you can see in the example it’s possible to mix and match hours and days, which may be useful in certain scenarios.
Go to Log Analytics and run query
SecurityEvent
| where TimeGenerated between ( startofday(ago(48hrs)) .. endofday(ago(1d)) )
| summarize min(TimeGenerated), max(TimeGenerated)
Result:
| min_TimeGenerated | max_TimeGenerated |
|---|---|
| 2020-09-13T00:00:00.043Z | 2020-09-14T23:59:59.62Z |
6. You can also use startofweek, startofmonth and startofyear in a similar way to the example in query #5.
The following example uses startofmonth. In this case no matter what entry you put in the ago(), the 1st day of the month is used. Again, you get a fixed point in time, the first day of the month (more of this in the extended examples at the end of the blog)
Go to Log Analytics and run query
SecurityEvent
| where TimeGenerated > startofmonth(ago(0d))
| summarize min(TimeGenerated), max(TimeGenerated)Note: The first day of the week is Sunday (day 0).
To adjust to Monday please use:
| where TimeGenerated > startofweek(ago(1d))+1d
Go to Log Analytics and run query
SecurityEvent
| where TimeGenerated > startofday(ago(1d))
| summarize arg_max(TimeGenerated, *)
In this query we get just the latest record for the time range selected. This is useful if you only need the latest (arg_max) or earliest (arg_min) records, and doesn’t retrieve a lot of unwanted data, the “*” in the second parameters returns us all the Columns, you could name a specific column(s) to return if you prefer, e.g: This example just show the Task and EventID column, rather than all available data.
SecurityEvent
| where TimeGenerated > startofday(ago(1d))
| summarize arg_max(TimeGenerated, Task, EventID)| TimeGenerated | Task | EventID |
|---|---|---|
| 2020-09-15T16:12:58.907Z | 12545 | 4634 |
8. There is no startofhour option, but we can use the bin scalar to help us with that, as this example shows.
Go to Log Analytics and run query
let searchTime = 1h;
SecurityEvent
| where TimeGenerated > ago(searchTime)
| extend startOfHour = bin(TimeGenerated,1h)
| where startOfHour > ago(searchTime)
| summarize min(TimeGenerated), max(TimeGenerated)
Result:
| min_TimeGenerated | max_TimeGenerated |
|---|---|
| 2020-09-15T16:00:00.39Z | 2020-09-15T16:15:49.42Z |
9. This is a common requested example, people often wish to show data between or outside a time range – maybe ‘business hours’. I have used between to allow a certain range, but you can also use !between to exclude a time range. This example will exclude rows of data between 22pm and 6am (as we set 07 .. 22) as the allowed hours in the query.
Go to Log Analytics and run query
Heartbeat
| where TimeGenerated > ago(1d)
| extend hour = datetime_part("hour", TimeGenerated)
| where hour between (07 .. 22)
| summarize LastCall = max(TimeGenerated) by Computer, ComputerEnvironment, hour
| where LastCall < ago(10m)
| order by hour asc
10. Now lets look at certain days of the week, in this case Monday (day 1) thru Friday (day 5)
Heartbeat
| where TimeGenerated > ago(30d)
| where dayofweek(TimeGenerated) in ('1.00:00:00','2.00:00:00','3.00:00:00','4.00:00:00','5.00:00:00')
| summarize count() by Computer, bin(TimeGenerated, 1d)
| order by TimeGenerated asc
or, I think this is easier to read
Go to Log Analytics and run query
Heartbeat
| where TimeGenerated > ago(30d)
| where dayofweek(TimeGenerated) between (1d .. 5d)
| summarize count(), make_set(dayofweek(TimeGenerated)) by Computer, bin(TimeGenerated, 1d)
| order by TimeGenerated asc
11. Lets now extend Query 10, we can also add a Column with the Name of the day, Monday, Tuesday etc… to make the report easier to read.
Heartbeat
| where TimeGenerated > ago(30d)
| where dayofweek(TimeGenerated) between (1d .. 5d)
| extend theDay = case(
                        dayofweek(TimeGenerated) == '0.00:00:00', "Sunday",
                        dayofweek(TimeGenerated) == '1.00:00:00', "Monday",
                        dayofweek(TimeGenerated) == '2.00:00:00', "Tuesday",
                        dayofweek(TimeGenerated) == '3.00:00:00', "Wednesday",
                        dayofweek(TimeGenerated) == '4.00:00:00', "Thursday",
                        dayofweek(TimeGenerated) == '5.00:00:00', "Friday",
                        dayofweek(TimeGenerated) == '6.00:00:00', "Saturday",
                        strcat("error: ", dayofweek(TimeGenerated))
                       )
| summarize by theDay
Go to Log Analytics and run query
| theDay |
|---|
| Tuesday |
| Monday |
| Friday |
| Wednesday |
| Thursday |
12. A common ask would be to remove the Weekend from the returned data, like this:
Go to Log Analytics and run query
// 0 = Sunday
// 6 = Saturday etc...
Heartbeat
| where TimeGenerated > ago(7d)
| where Computer startswith "DC01"
| where dayofweek(TimeGenerated) between  (1d .. 5d)
| summarize count() by Computer, bin(TimeGenerated, 1d)
| order by TimeGenerated asc
| render columnchart
Result: You can see the gap for the Weekend we excluded (in red), this assumes your Weekend is Saturday to Sunday, please amend if it isn’t.
Note: If desired you should amend the above query, removing this line (I used it to show the gap the weekend left):
| where TimeGenerated > ago(7d)

————————————————————————
Extended examples that you might really use.
Now we will use some of the above examples, in real queries:
1. Show unique counts of EventIds, per day over the last Week: Go to Log Analytics and run query
SecurityEvent
| where TimeGenerated between ( startofday(ago(7d)) .. startofday(now()) )
| summarize dcount(EventID) by bin(TimeGenerated,1d)
| render timechart title = "The unique count of EventIds - past 7days"

2. Show unique EventIds so far during the current month: Go to Log Analytics and run query
SecurityEvent
| where TimeGenerated between ( startofmonth(now()) .. now() )
| summarize dcount(EventID) by bin(TimeGenerated,1d)
| render timechart title = "The unique count of EventIds - Monthly View: Day 1 thru to Today"

3. Show unique EventIds so far this current month, excluding weekends (Saturday & Sunday). Go to Log Analytics and run query
You can adjust for a Friday to Saturday weekend, swap 1d .. 5d to 0d .. 4d
SecurityEvent
| where TimeGenerated between ( startofmonth(now()) .. now() )
| where dayofweek(TimeGenerated) between (1d .. 5d)
| summarize dcount(EventID) by bin(TimeGenerated,1d)
| render columnchart title = "The unique count of EventIds - Monthly View: Day 1 thru to Today (excluding Weekends)"

4. Show unique EventIds for the current Week, Week starting on Monday. Go to Log Analytics and run query
I used +1d to make the week start on Monday, as the default is Sunday (0d).
SecurityEvent
| where TimeGenerated > startofweek(now()) + 1d
| summarize dcount(EventID) by bin(TimeGenerated,1d)
| order by TimeGenerated asc
| render columnchart
| render columnchart title = "The unique count of EventIds - Week View: Monday thru to Today"
Summary
The above examples should give you some ideas on how to search (and visualize) your data using Time and Dates techniques. Did I miss any you use?


Recent Comments