
by Contributed | Sep 30, 2020 | Azure, Technology, Uncategorized
This article is contributed. See the original author and article here.
Many customers require the ability to audit what happens in their SOC environment for both internal and external compliance requirements . It is important to understand the who/what/when’s of activities within your Azure Sentinel instance. In this blog, we will explore how you can audit your organization’s SOC if you are using Azure Sentinel and how to get the visibility you need with regard to what activities are being performed within your Sentinel environment. The accompanying Workbook to this blog can be found here.
There are two tables we can use for auditing Sentinel activities:
- LAQueryLogs
- Azure Activity
In the following sections we will show you how to set up these tables and provide examples of the types of queries that you could run with this audit data.
LAQueryLogs table
The LAQueryLogs table containing log query audit logs provides telemetry about log queries run in Log Analytics, the underlying query engine of Sentinel. This includes information such as when a query was run, who ran it, what tool was used, the query text, and performance statistics describing the query’s execution.
Since this table isn’t enabled by default in your Log Analytics workspace you need to enable this in the Diagnostics settings of your workspace. Click here for more information on how to do this if you’re unfamiliar with the process. @Evgeny Ternovsky has written a blog post on this process that you can find here.
A full list of the audit data contained within these columns can be found here. Here are a few examples of the queries you could run on this table:
How many queries have run in the last week, on a per day basis:
LAQueryLogs
| where TimeGenerated > ago(7d)
| summarize events_count=count() by bin(TimeGenerated, 1d)
Number of queries where anything other than HTTP response request 200 OK is received (i.e. the query failed):
LAQueryLogs
| where ResponseCode != 200
| count
Show which users ran the most CPU intensive queries based on CPU used and length of query time:
LAQueryLogs
|summarize arg_max(StatsCPUTimeMs, *) by AADClientId
| extend User = AADEmail, QueryRunTime = StatsCPUTimeMs
| project User, QueryRunTime, QueryText
| order by QueryRunTime desc
Summarize who ran the most queries in the past week:
LAQueryLogs
| where TimeGenerated > ago(7d)
| summarize events_count=count() by AADEmail
| extend UserPrincipalName = AADEmail, Queries = events_count
| join kind= leftouter (
    SigninLogs)
    on UserPrincipalName
| project UserDisplayName, UserPrincipalName, Queries
| summarize arg_max(Queries, *) by UserPrincipalName
| sort by Queries desc
AzureActivity table
As in other parts of Azure, you can use the AzureActivity table in log analytics to query actions taken on your Sentinel workspace. To list all the Sentinel related Azure Activity logs in the last 24 hours, simply use this query:
AzureActivity
| where OperationNameValue contains "SecurityInsights"
| where TimeGenerated > ago(1d)
This will list all Sentinel-specific activities within the time frame. However, this is far too broad to use in a meaningful way so we can start to narrow this down some more. The next query will narrow this down to all the actions taken by a specific user in AD in the last 24 hours (remember, all users who have access to Azure Sentinel will have an Azure AD account):
AzureActivity
| where OperationNameValue contains "SecurityInsights"
| where Caller == "[AzureAD username]"
| where TimeGenerated > ago(1d)
Final example query – this query shows all the delete operations in your Sentinel workspace:
AzureActivity
| where OperationNameValue contains "SecurityInsights"
| where OperationName contains "Delete"
| where ActivityStatusValue contains "Succeeded"
| project TimeGenerated, Caller, OperationName
You can mix these up and add even more parameters to search the AzureActivities log to explore these logs even more, depending on what your organization needs to report on. Below is a selection of some of the actions you can search for in this table:
- Update Incidents/Alert Rules/Incident Comments/Cases/Data Connectors/Threat Intelligence/Bookmarks
- Create Case Comments/Incident Comments/Watchlists/Alert Rules
- Delete Bookmarks/Alert Rules/Threat Intelligence/Data Connectors/Incidents/Settings/Watchlists
- Check user authorization and license
Alerting on Sentinel activities
You may want to take this one step further and use Sentinel audit logs for proactive alerts in your environment. For example, if you have sensitive tables in your workspace that should not typically be queried, you could set up a detection to alert you to this:
LAQueryLogs
| where QueryText contains "[Name of sensitive table]"
| where TimeGenerated > ago(1d)
| extend User = AADEmail, Query = QueryText
| project User, Query
Sentinel audit activities Workbook
We have created a Workbook to assist you in monitoring activities in Sentinel. Please check it out here and if you have any improvements or have made your own version you’d like to share, please submit a PR to our GitHub repo!
With thanks to @Jeremy Tan @Javier Soriano, @Matt_Lowe and @Nicholas DiCola (SECURITY JEDI) for their feedback and inputs to this article.
by Contributed | Sep 29, 2020 | Uncategorized
This article is contributed. See the original author and article here.
Overview
Monitoring Windows Security Auditing logs is essential in helping SOC analysts to keep track of any unplanned changes in a computer’s system audit policy settings. If there is an indication of a suspicious anomalous activity, an investigation needs to be performed as soon as possible. Hence, the ability to analyze collected Windows Security Auditing logs efficiently in Azure Sentinel is crucial.
Windows Security Events can be collected in Azure Sentinel with Security Events Connector or Data Collection in Azure Security Center Standard Tier (If both Azure Sentinel and Azure Security Center are running in the same workspace).
In this blog post, you will learn how to use Parameterized Function to perform data enrichment and simplify your KQL query. We will use Windows Security Audit Policy Change events as our use case for data enrichment. You can refer to a list of Audit Policy Change Event IDs here if you are unfamiliar with these events.
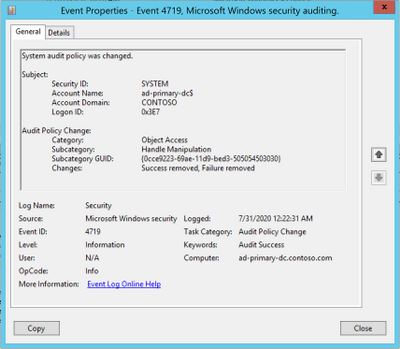
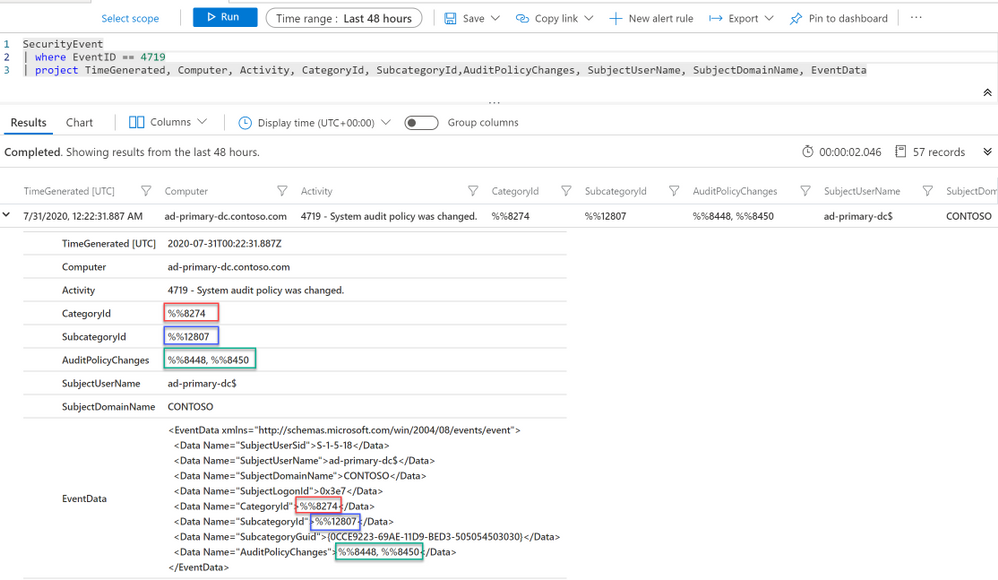
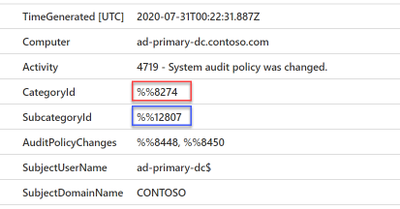
First, let me give you an overview of the use case that I am about to walkthrough: let’s take Event ID 4719 (“System audit policy was changed”) as an example. The following event 4719 is logged when the audit policy was changed.

Below is how the event data would look when you query for this event in your Sentinel workspace. As you can see, the Category, Subcategory and AuditPolicyChanges fields are captured in their IDs by design instead of the text values. This might be a challenge when you need to understand more about the event or perform a filter based the string value such as “Object Access”.
In the following sections of this blog, you will learn:
- What is a Parameterized Function?
- How to enrich Category, Subcategory and Changes fields with parameterized function when analyzing Windows Security Audit Policy Change events in Azure Sentinel.
The Plan
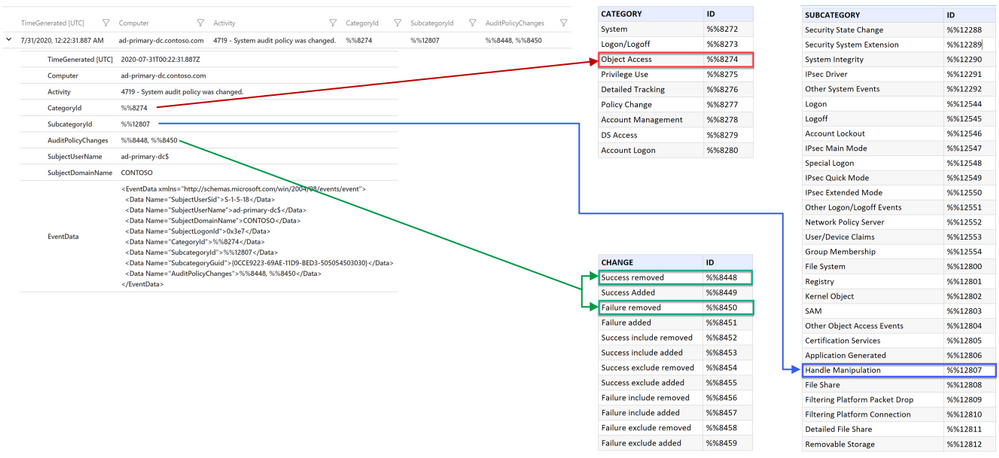
Here is the summary of what we are about to do. In the following diagram, I have lookup tables for Category, Subcategory and Changes with their values and IDs. The diagram illustrates how these IDs will be mapped to each individual table.
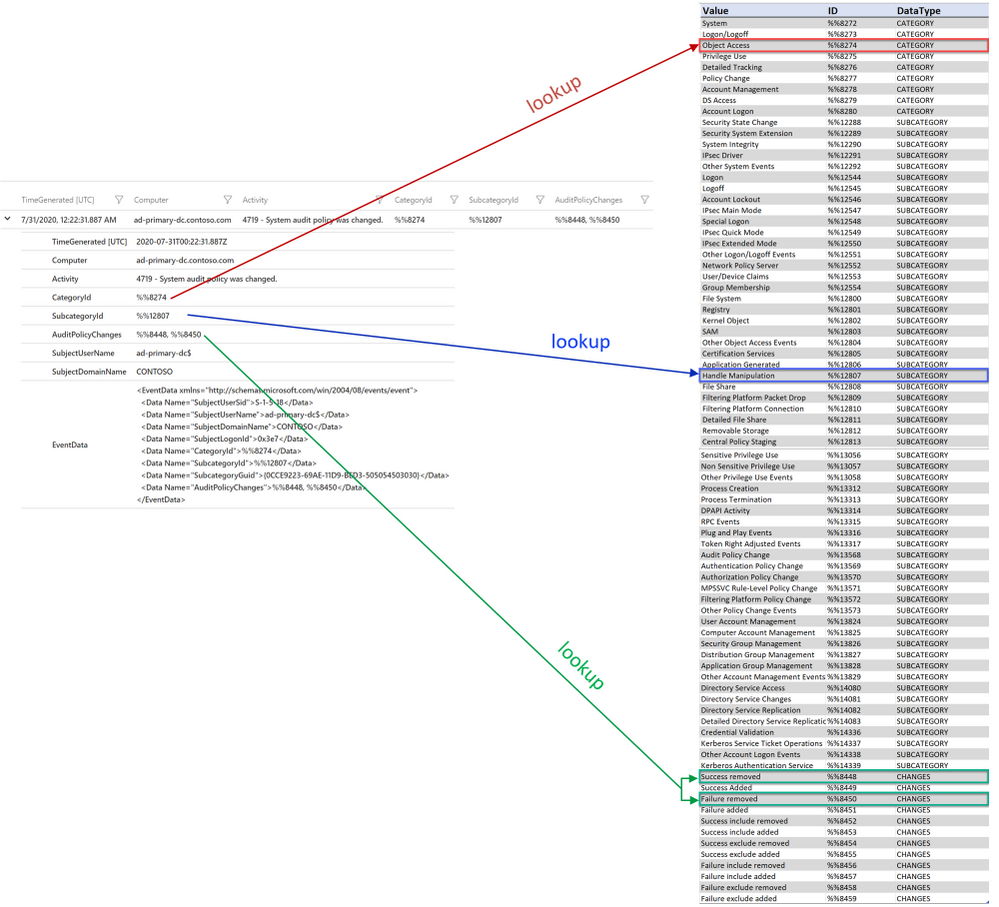
I will simplify the mapping process by consolidating all the values for Category, SubCategory and Changes in a single lookup table as shown in the diagram below. This will be the function body of our Parameterized Function which I will discuss in the next section. The function will return the corresponding value when provided with an ID.
What is a Parameterized Function?
Parameterized Function is an user-defined function that can be invoked through the function alias. It accepts zero or more input arguments and produces a single output (which can be scalar or tabular) based on the function body. However, Parameterized Function is not the same as the KQL function – a common feature in Log Analytics (you can refer to this blog post for example) as the KQL function doesn’t support input arguments.
Below is an example of a Parameterized Function with a single argument (ID). The function body is a dynamic table with a list of IDs and the corresponding values. The reason of using dynamic scalar data type is to allow scalar expression when passing a column value as the argument.
let myfunc = (ID:string){
dynamic(
{ “%%8272″:”System”,
“%%8273″:”Logon/Logoff”,
“%%8274″:”Object Access”,
“%%8275″:”Privilege Use”,
“%%8276″:”Detailed Tracking”,
“%%8277″:”Policy Change”,
“%%8278″:”Account Management”,
“%%8279″:”DS Access”,
“%%8280″:”Account Logon”
})[ID]};
Here is the example of how the function is being invoked. The function will return the lookup value of the provided ID:
SecurityEvent
| where EventID == 4719
| project TimeGenerated, Computer, CategoryId
| extend Category = myfunc(CategoryId)
| project-away CategoryId
However, Parameterized Function can only be created programmatically (creation in UI is not supported at the time of writing). Hence, I will provide sample PowerShell scripts to create Parameterized Functions in this blog.
Create the Parameterized Function
Here is the sample Powershell script to create the Parameterized Function for the lookup table of Category, Subcategory and Changes. Edit the Powershell script to provide the following information before executing it:
-
$ResourceGroup: Resource Group of your Azure Sentinel Workspace.
-
$WorkspaceName: Name of your Azure Sentinel Workspace.
-
$SubscriptionID: Subscription ID of the Azure Sentinel Workspace.
Run the script after you have updated the above details. The script will prompt for your Azure credentials and it should take less than a minute to complete. Below is the sample screenshot of how a successful creation looks like:
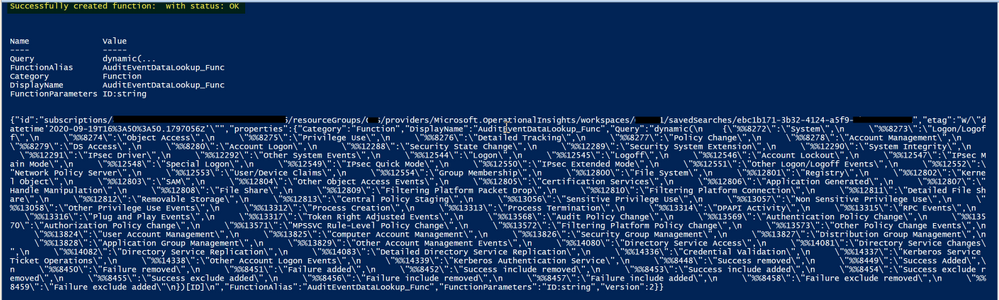
The script will create a Parameterized Function on your defined workspace with the name and alias of “AuditEventDataLookup_Func”.
Note that the Parameterized Function is not visible in the workspace UI, but you can use API to GET the function details or List all Saved Searches (including Parameterized functions) for your workspace.
Using Parameterized Function to enrich Category ID, Subcategory ID and Changes ID
Now, let’s begin enriching the Category and Subcategory fields using the function we just created. These two fields will only have a single value and they are more straight forward. We just need to invoke the function with CategoryId/SubcategoryId as the input argument.
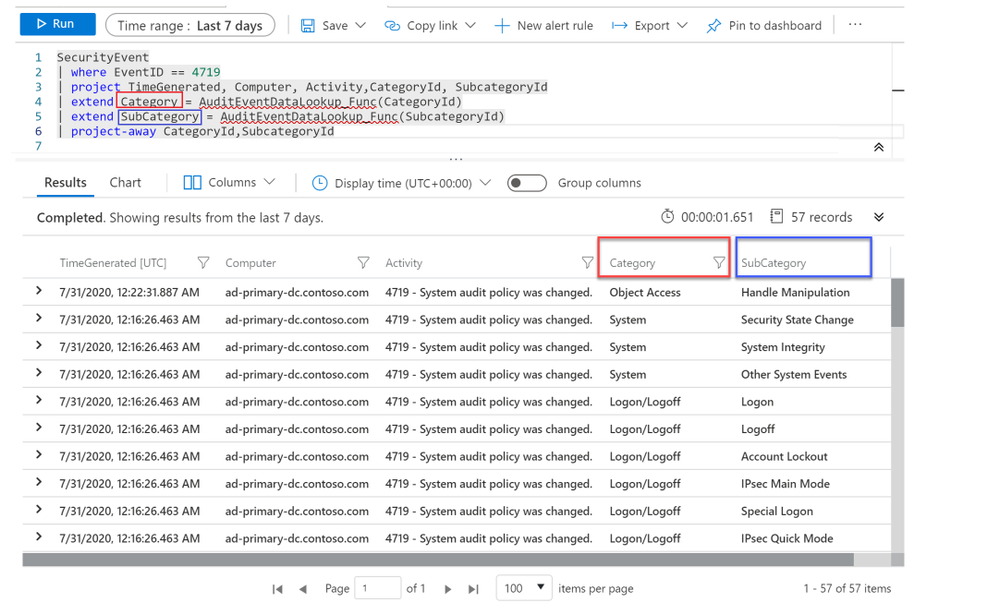
Below is the sample query:
SecurityEvent
| where EventID == 4719
| project TimeGenerated, Computer, Activity, CategoryId, SubcategoryId
| extend Category = AuditEventDataLookup_Func(CategoryId)
| extend SubCategory = AuditEventDataLookup_Func(SubcategoryId)
| project-away CategoryId, SubcategoryId
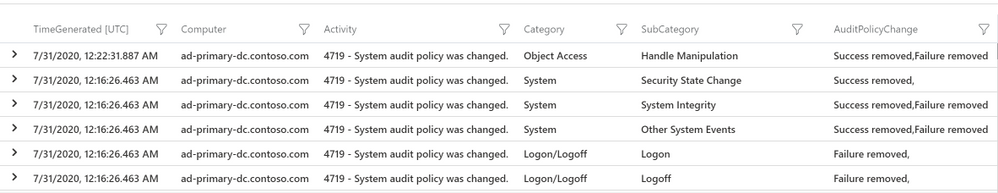
The query results are now showing Category and Subcategory names instead of IDs as shown in the image below:
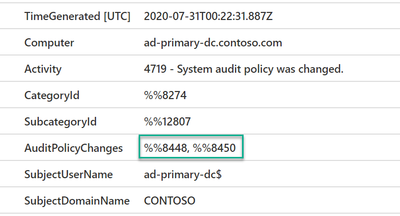
Next is the AuditPolicyChanges field. This field will either have one or two values separated by a comma as shown in the image below. Hence, we can’t pass the AuditPolicyChanges value directly to the function like what we did earlier because if the field contained two values, the function will not be able to find a match in the lookup table.
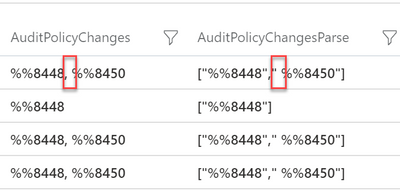
But this can be resolved with the help of a few KQL commands. First of all, we can use parse_csv() or split() command to get the string values from the comma-separated record. The returned values will be in a string array. Below is the sample query:
SecurityEvent
| where EventID == 4719
| extend Category = AuditEventDataLookup_Func(CategoryId)
| extend SubCategory = AuditEventDataLookup_Func(SubcategoryId)
| extend AuditPolicyChangesParse = parse_csv(AuditPolicyChanges)
Next, We will invoke the Parameterized function for each AuditPolicyChanges value using the array index (AuditPolicyChangesParse[0] and AuditPolicyChangesParse[1]). But be aware that there is a whitespace in the AuditPolicyChanges field after the comma as shown in the below image, which also appear after parsing. That means we need to remove the whitespace for the second value of AuditPolicyChanges when passing it to our function and we can do that by using the trim() command.
Below is the sample command line for removing the whitespace using trim(). Note that we are using strcat() to concatenate each AuditPolicyChange value returned by the function and separate them with a comma.
| extend AuditPolicyChange = strcat(AuditEventDataLookup_Func(AuditPolicyChangesParse[0]) ,“,”,
AuditEventDataLookup_Func(trim(” “,tostring(AuditPolicyChangesParse[1]))))
We have now resolved the scenario of enriching the AuditPolicyChange field which might consist of two values. But what if the AuditPolicyChange field only have a single value? Since we are using strcat() in the above query, the record will look like the below image if there is only a single value.
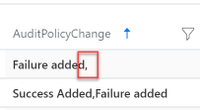
This will be an easy fix as we can use trim_end() to remove the comma at the end of the text (if any).
Below is how the command looks like:
| extend AuditPolicyChange = trim_end(“,”,strcat(AuditEventDataLookup_Func(AuditPolicyChangesParse[0]) ,“,”,
AuditEventDataLookup_Func(trim(” “,tostring(AuditPolicyChangesParse[1])))))
Below is the final query for your reference:
SecurityEvent
| where EventID == 4719
| extend Category = AuditEventDataLookup_Func(CategoryId)
| extend SubCategory = AuditEventDataLookup_Func(SubcategoryId)
| extend AuditPolicyChangesParse = parse_csv(AuditPolicyChanges)
| extend AuditPolicyChange = trim_end(",", strcat(AuditEventDataLookup_Func(AuditPolicyChangesParse[0]) ,",",AuditEventDataLookup_Func(trim(" ",tostring(AuditPolicyChangesParse[1])))))
| project TimeGenerated, Computer, Activity, Category, SubCategory, AuditPolicyChange
Nested Function
Now you have seen how the function works, there might be times where you need to create multiple functions for different purposes (such as enrichment, parsing, filtering and etc) and the ability to invoke another function within a function will be useful. Let me show you that in the next example.
Below is the query from the previous section and my use case is to simplify the query by configuring the yellow highlighted lines in a parameterized function called EnrichAuditEvents_Func. This function will take the table records (highlighted in blue) as the input argument (we will assign the table records to a Let() variable and passing it as an argument).
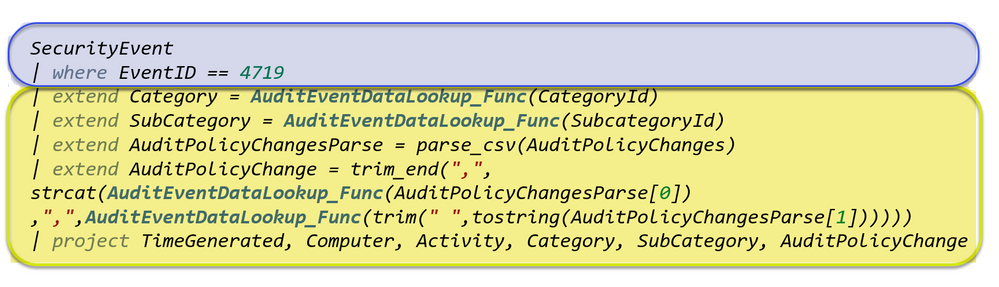
You can create the EnrichAuditEvents_Func function with the script here.
The function will return the same output results as we saw earlier, but the KQL query will be much simpler and shorter.
Below is how the final query looks like:
let AuditEvents = (SecurityEvent | where EventID == 4719);
EnrichAuditEvents_Func(AuditEvents)
Summary
In summary, you have seen how we can use the Parameterized Function to perform enrichment and simplify the KQL query. I hope you find this useful and this information will help you in analyzing Windows Security Audit events more efficiently.
Download Scripts:
AuditEventDataLookup_Func – Enrich Category, Subcategory and AuditPolicyChanges fields.
EnrichAuditEvents_Func – The nested function. Make sure you have deployed the above function before invoking this.
Special thanks to @Ofer_Shezaf , @Sarah_Young and @Alexander Sloutsky for your help.
by Contributed | Sep 29, 2020 | Azure, Technology, Uncategorized
This article is contributed. See the original author and article here.
Additional certificate updates for Azure Sphere
Microsoft is updating Azure services, including Azure Sphere, to use intermediate TLS certificates from a different set of Certificate Authorities (CAs). These updates are being phased in gradually, starting in August 2020 and completing by October 26, 2020. This change is being made because existing intermediate certificates do not comply with one of the CA/Browser Forum Baseline requirements. See Azure TLS Certificate Changes for a description of upcoming certificate changes across Azure products. Azure IoT TLS: Changes are coming! (…and why you should care) provides details about the reasons for the certificate changes and how they affect the use of Azure IoT.
How does this affect Azure Sphere?
On October 13, 2020 we will update the Azure Sphere Security Service SSL certificates. Please read on to determine whether this update will require any action on your part.
What customer actions are required for the SSL certificate updates?
On October 13, 2020 the SSL certificate for the Azure Sphere Public API will be updated to a new leaf certificate that links to the new DigiCert Global Root G2 certificate. This change will affect only the use of the Public API. It does not affect Azure Sphere applications that run on the device.
For most customers, no action is necessary in response to this change because Windows and Linux systems include the DigiCert Global Root G2 certificate in their system certificate stores. The new SSL certificate will automatically migrate to use the DigiCert Global Root G2 certificate.
However, if you “pin” any intermediate certificates or require a specific subject, name, or issuer (“SNI pinning”), you will need to update your validation process. To avoid losing connectivity to the Azure Sphere Public API, you must make this change before we update the certificate on October 13, 2020.
What about Azure Sphere apps that use IoT and other Azure services?
Additional certificate changes will occur soon that affect Azure IoT and other Azure services. The update to the SSL certificates for the Azure Sphere Public API is separate from those changes.
Azure IoT TLS: Changes are coming! (…and why you should care) describes the upcoming changes that will affect IoT Hub, IoT Central, DPS, and Azure Storage Services. These services are not changing their Trusted Root CAs; they are only changing their intermediate certificates. Azure Sphere on-device applications that use only the Azure IoT and Azure Sphere application libraries should not require any modifications. When future certificate changes are required, we will update the IoT C SDK in the Azure Sphere OS and thus make the updated certificates available to your apps.
If your Azure Sphere on-device applications communicate with other Azure services, however, and pin or supply certificates for those services, you might need to update your image package to include updated certificates. See Azure TLS Certificate Changes for information about which certificates are changing and what changes you need to make.
We continue to test common Azure Sphere scenarios as other teams at Microsoft perform certificate updates and will provide detailed information if additional customer action is required.
For more information:
If you encounter problems
For self-help technical inquiries, please visit Microsoft Q&A or Stack Overflow. If you require technical support and have a support plan, please submit a support ticket in Microsoft Azure Support or work with your Microsoft Technical Account Manager/Technical Specialist. If you would like to purchase a support plan, please explore the Azure support plans.


Recent Comments