by Contributed | Sep 29, 2020 | Azure, Technology, Uncategorized
This article is contributed. See the original author and article here.
Tom McElroy, Rob Mead – Microsoft Threat Intelligence Center
Thanks to Stefan Sellmer, Elia Florio, Ram Pliskin, Dotan Patrich & Yossi Weizman for making this blog possible.
On the 22nd September 2020 as part of IGNITE, we released a video demo showing how to use Microsoft 365 Defender and Azure Defender (AD) in combination with Azure Sentinel to investigate a web shell attack. Part of the attack took place against a web application hosted on Azure App Services, where the attacker gained access by using legitimate credentials.
This blog will use the same demo environment as the IGNITE demo, and will expand further on aspects related to Azure Defender, App Services and Azure Sentinel. Watching the IGNITE demo is not required to gain value from this blog.
This blog will cover:
- Enabling App Services diagnostic logging
- Finding App Services diagnostic logging in Azure Sentinel
- Enabling Azure Defender alerts in Azure Security Center
- Finding Azure Defender alerts in Azure Sentinel
- Expanding Azure Defender alerts with App Services diagnostic logging in Azure Sentinel using Kusto queries
Enabling App Services Diagnostic Logging
App Services diagnostic logging is primarily used to debug web applications; when diagnostic logging is enabled it provides up to 8 different log types depending on the host system. A complete list of log types and supported platforms can be found in a table toward the end of this page. Enabling diagnostic logging will incur additional storage costs.
Enabling this is simple, the animation below shows how to enable diagnostic logging for an App Service called “contoso-digital”. There are a few different locations for diagnostic logs to output to, in the video the “Send to Log Analytics” option is chosen, by selecting the Log Analytics instance where Azure Sentinel resides the data will be available through Azure Sentinel. With diagnostic logs enabled and configured, data will start flowing into Log Analytics and be available within Azure Sentinel. It may take up to 30 minutes for the first logs to appear.
This process will need to be completed for each App Service that you want to monitor.
 Enabling App Services diagnostic logging
Finding App Services Logs in Azure Sentinel
App Services logs can be found within the Log Management category of Azure Sentinel, each App Service log is stored in its own table prefixed with AppService.
In the image below, the tables for the App Service logs are highlighted in red. This blog will use AppServiceHTTPLogs which stores HTTP logs and AppServiceAuditLogs which stores authentication events for services such as FTP to expand ASC alerts, both logs are available on Windows or Linux hosts.
 App Services logs in Azure Sentinel
Querying AppServiceHTTPLogs provides information about requests that have been received by the server, with some basic information about the response, including the size and the HTTP status code returned. The image below shows some of the more useful fields for security analytics.
 App Services HTTP logs example output
Enabling Azure Defender alert in Azure Security Center
Azure Defender enables hybrid security management and threat protection. Azure Defender can continuously assess your resources for potential security breaches. In the context of the IGNITE demo and this blog, Azure Defender alerts are triggered when a malicious attacker uploads a web shell to the web app over FTP, the attacker uses legitimate credentials that have been stolen from the network. Another alert is triggered when the attacker spear phishes a user using a malicious script hosted on the compromised web app, this detection is possible due security alerts from Office 365 Defender being shared with Azure Defender.
To receive alerts: You must enable coverage of App Services, the below animation shows how to configure this.
 Enabling App Services coverage
With coverage enabled, Azure Defender will begin monitoring your App Services for potentially malicious activity and raise these alerts inside the Azure Security Center (ASC) dashboard.
During the IGNITE demo the attacker used compromised credentials to upload a web shell and then staged a malicious document for use in a spear phishing campaign. Azure Defender has two correlation detections, “PHP File in Upload folder” and “Phishing content hosted on Azure webApps”, which will find this activity. These detections are part of Azure Defender’s Cloud Smart Alert, a full list of security alerts that may be generated by Azure Defender can be found here.
Azure Defender alerts can be accessed from the Azure Security Center tab within Azure portal; once loaded, the overview screen will load as seen in the below image.
 Security Center overview
Azure Security Center contains information on a few different things, the focus of this blog is on Threat protection, shown at the bottom of the above image. Threat protection is where alerts that have been generated by Azure Defender are surfaced.
Clicking into threat protection will load current alerts. In this example, two alerts are shown; one which has detected a suspicious PHP file and another that has detected phishing activity.
 ASC Security Alerts overview
PHP File in Upload Folder Alert
This detection will trigger when a PHP file is uploaded to a common uploads folder, this will generally happen when an arbitrary file upload vulnerability has been used. Azure Defender correlation rules monitor web activity, if a request is observed to a PHP file within a common upload folder and alert is generated.
The image below shows the Azure Defender alert within Azure Security Center. The alert details where the suspicious file is on the app service, the IP address and user agent that was used to access the file, alongside information covering when the alert was triggered and a brief description of what the alert detects.
 PHP File in upload folder alert
Phishing content host on Azure webApps Alert
This detection uses correlation between Microsoft Defender for Office 365 and Azure Defender to detect suspicious activity and raise an alert. When a phishing attack takes place, Microsoft Defender for Office 365 will scan included links for potentially malicious activity. If a detection is made and the URL is hosted using Azure App Services then Microsoft Defender for Office 365 will share alert information with the owner of the App Service that has been utilised.
In the image below you can see the URL that was used in a phishing attack and details about when the activity occurred.
 Phishing content hosted on Azure webapps alert
Finding ASC alerts in Azure Sentinel
Alert information may not automatically flow into Azure Sentinel from Azure Defender. To allow alerts to flow into Azure Sentinel you must first enable the Azure Security Center connector. The below animation shows how to enable this connector in Azure Sentinel.
 Enabling the Azure Sentinel connector
With the connector enabled, alert information will begin to flow into Azure Sentinel and can be found in the SecurityAlert table. The Kusto query below will collect Azure Defender alerts from Azure Security Center.
SecurityAlert
| where TimeGenerated > ago(30d)
| where ProviderName == "Azure Security Center"

Expanding Azure Defender Alerts with App Services logging in Azure Sentinel
With App Services Diagnostic logging enabled, Azure Defender configured to monitor App Services for threats, and the Azure Security Center connector enabled in Azure Sentinel, the correct data is in Azure Sentinel to expand on security alerts.
PHP File in Upload Folder Expansion Queries
The Azure Defender alert provides details about the suspicious file, the Azure resource ID for the impacted app service, the IP address of the suspected attacker and the time that the alert was generated. This information has been passed through to Azure Sentinel. In this scenario the user interacting with the file in the alert is likely the attacker, so the following expansion queries will focus on extracting more about what the attack has accessed.
Azure Security Center passes Azure Defender information in a JSON object, this will need to be parsed to extract the information from the alert. The Kusto query below will collect the security alerts and parse out the entities provided.
let timeRange = 30d;
SecurityAlert
| where TimeGenerated > ago(timeRange)
//Collect ASC alerts for PHP file in upload folder
| where ProviderName == "Azure Security Center"
| where AlertName == "PHP file in upload folder"
//Parse the Alert attack entities
| extend AtkEntities = parse_json(ExtendedProperties)
| extend Entities = parse_json(Entities)
//The shell location
| extend AlertPage = iff(AtkEntities['Sample URIs'] != "", tostring(AtkEntities['Sample URIs']), tostring(Entities[0]['Url']))
//The attacker IP and User Agent
| extend AlertIP = AtkEntities['Sample Source IP Addresses']
| extend AlertUA = AtkEntities['Sample User Agents']
| project AlertName, AlertTimeGenerated=TimeGenerated, StartTime, EndTime, AlertPage, AlertIP, AlertUA, ResourceId
Executing this query will provide output like below.

It is now possible to establish the IP addresses that the attacker is using. The Azure Defender alert provides the first IP observed, however it is possible that the attacker is using more than a single IP address. With App Services diagnostic logging enabled a basic join on the AppServicesHTTPLogs allows for summarisation of IP addresses that have accessed the web shell. The below Kusto query expands the initial query to do this.
let timeRange = 30d;
SecurityAlert
| where TimeGenerated > ago(timeRange)
//Collect ASC alerts for PHP file in upload folder
| where ProviderName == "Azure Security Center"
| where AlertName == "PHP file in upload folder"
//Parse the Alert attack entities
| extend AtkEntities = parse_json(ExtendedProperties)
| extend Entities = parse_json(Entities)
//The shell location
| extend AlertPage = iff(AtkEntities['Sample URIs'] != "", tostring(AtkEntities['Sample URIs']), tostring(Entities[0]['Url']))
//The attacker IP and User Agent
| extend AlertIP = AtkEntities['Sample Source IP Addresses']
| extend AlertUA = AtkEntities['Sample User Agents']
| project AlertName, AlertTimeGenerated=TimeGenerated, StartTime, EndTime, AlertPage, AlertIP, AlertUA, ResourceId=tolower(ResourceId)
| extend ResourceId = replace(@"s", "", ResourceId)
//Join to the web logs for app services
| join (
AppServiceHTTPLogs
| where TimeGenerated > ago(timeRange)
| extend ResourceId=tolower(_ResourceId)
//Defeat scanning
| where ScStatus == 200
| where CsMethod == "POST"
| summarize make_set(TimeGenerated), make_set(UserAgent), Visits=count() by CIp, CsUriStem, ResourceId
) on $left.AlertPage == $right.CsUriStem, ResourceId
| project PotentialAttackerIP=CIp, UserAgents=set_UserAgent, AccessTimes=set_TimeGenerated, AlertPage, Visits
| order by Visits
The output of this query will show other IP addresses that have also accessed the web shell script. Web shells are often scanned for by other attackers or security researchers, especially if the web shell is available publicly and the name is left as default.
Most web shells utilise HTTP POST requests for authentication or to receive commands from the attacker; to reduce the noise produced by scanning, the query is limited to only find connections that received a successful response code (200) and were made using a HTTP POST request. The image below shows that in the demo environment the attacker has only used a single IP address.

Now that the attacker is identified and any additional IP addresses the attacker has used are known, an additional expansion query can be used to determine how the file was uploaded to the server.
The Kusto query below will collect information from AppServicesHTTPLogs and AppServiceAudit logs to determine if an FTP upload took place. App Services HTTP Logs are used to determine the first time the attacker accessed the web shell; the time provided in the Azure Defender alert is when the detection was made, and not necessarily when the web shell was first accessed. The query then uses a time window join against the App Service Audit logs to enable detection of an upload over FTP within 2 days either side of the first access to the web shell; this can be configured by changing the lookup window.
let lookupWindow = 4d;
let lookupBin = lookupWindow / 2.0;
let timeRange = 30d;
SecurityAlert
| where TimeGenerated > ago(timeRange)
//Collect ASC alerts for PHP file in upload folder
| where ProviderName == "Azure Security Center"
| where AlertName == "PHP file in upload folder"
//Parse the Alert attack entities
| extend AtkEntities = parse_json(ExtendedProperties)
| extend Entities = parse_json(Entities)
//The shell location
| extend AlertPage = iff(AtkEntities['Sample URIs'] != "", tostring(AtkEntities['Sample URIs']), tostring(Entities[0]['Url']))
//The attacker IP and User Agent
| extend AlertIP = AtkEntities['Sample Source IP Addresses']
| extend AlertUA = AtkEntities['Sample User Agents']
| project AlertName, AlertTimeGenerated=TimeGenerated, StartTime, EndTime, AlertPage, AlertIP, AlertUA, ResourceId=tolower(ResourceId)
| extend ResourceId = replace(@"s", "", ResourceId)
//Join to the web logs for app services to get the first access time
| join kind = leftouter (
AppServiceHTTPLogs
| where TimeGenerated > ago(timeRange)
| summarize make_list(CIp), make_list(TimeGenerated), make_list(UserAgent) by CsUriStem, CsHost, ResourceId=tolower(_ResourceId)
) on $left.AlertPage == $right.CsUriStem, ResourceId
| project AlertTime=AlertTimeGenerated, AlertName, AlertDomain=CsHost, AlertPage, AttackerIP=AlertIP, AttackerUA=AlertUA, ResourceId, list_CIp, list_UserAgent, list_TimeGenerated, HostCustomEntity=ResourceId, CsHost, CsUriStem
| mv-expand list_TimeGenerated, list_CIp, list_UserAgent
| extend TimeKey=bin(todatetime(list_TimeGenerated), lookupBin) | extend Start=list_TimeGenerated
//Order by time and then get the top result, this is the first access time
| order by TimeKey asc
| take 1
| join kind=inner (
//Now collect informtion from app services audit logs
AppServiceAuditLogs
| where TimeGenerated > ago(timeRange)
//Limit to the FTP protocol, this can be commented out to find AAD logins
| where Protocol == "FTP"
| extend ResourceId = tolower(_ResourceId)
| extend TimeKey = range(bin(TimeGenerated-lookupWindow, lookupBin), bin(TimeGenerated, lookupBin), lookupBin) | extend End=TimeGenerated
| mv-expand TimeKey to typeof(datetime)
) on TimeKey, ResourceId
| where End < AlertTime
| extend loginUser = pack(User, UserAddress)
| summarize LoginEvent=make_bag(loginUser) by AlertName, LoginTime=End, AlertHost=CsHost, AlertFile=CsUriStem, Protocol
| project-reorder Protocol, LoginTime, LoginEvent, AlertName, AlertHost, AlertFile
| order by LoginTime asc
Successful execution of the query will output results like those shown in the image below. The LoginEvent object provides the username and the IP address that was used by the attacker, in the demo environment the attacker IP used matches the IP in the alert and the App Service HTTP logs and has connected to the FTP server several times.

With this additional information it is possible to block any additional IP addresses the attacker has been using.
A final step that can be taken is to further expand the alert with information from AzureActivity. This table in Azure Sentinel contains entries from the Azure Activity log to provide insight into any subscription-level or management group level events that have occurred in Azure. Now the potential attacker IP addresses are known, the below Kusto query can be executed against Azure Activity to determine if any additional administrative actions have been taken.
let attackerIPs = dynamic(["xxx.xxx.xxx.xxx"]);
let timeRange = 30d;
AzureActivity
| where TimeGenerated > ago(timeRange)
| where CategoryValue =~ "Administrative"
| where CallerIpAddress has_any(attackerIPs)
| project TimeGenerated, CategoryValue, AttackerIP=CallerIpAddress, CompromisedAccount=Caller, AttackedResource=ResourceId, OperationName
If an Azure account has been compromised this query will surface results like those shown in the image below. The account owned by “GemmaG” has been accessed using the attackers IP address and should be disabled until the password can be changed and security verified.

Phishing content host on Azure Web Apps Expansion Queries
This Azure Defender alert provides information relating to a file on the server that has been used in a phishing campaign, it is likely that most users accessing the file are victims of a phishing attack. As with the previous alert, Azure Security Center provides Azure Defender alert information in a JSON object that needs parsing, the Kusto query below can be used to parse out the fields required for further expansion.
let timeRange = 30d;
SecurityAlert
| where TimeGenerated > ago(timeRange)
| where ProviderName == "Azure Security Center"
| where AlertName == "Phishing content hosted on Azure webApps"
| extend atkentities = parse_json(ExtendedProperties)
//The alert has the domain and the path concatenated, this will separate the path and domain for further queries
| extend phishingPageLocation = tostring(atkentities['URL'])
| extend Path = extract(@"(?:[.][a-z]{2,4}(?:[.][a-z]{2,4})?(/.+[.][a-z]{1,4}))(?:?|$)", 1, phishingPageLocation)
| extend Domain = extract(@"(^.+[.][a-z]{2,4}(?:[.][a-z]{2,4})?)/", 1, phishingPageLocation)
| extend Domain = replace(@"https?://", "", Domain)
| extend ResourceId = tolower(replace(@" ", "", ResourceId))
| project Domain, Path, ResourceId, AlertName, TimeGenerated
Below is example output for the query.

The Path column provides the URL path of the file that was detected in a phishing campaign; combining this with the ResourceId a join can be performed against AppServicesHTTPLogs, this provides insight into the clients that have visited the phishing page.
let timeRange = 30d;
SecurityAlert
| where TimeGenerated > ago(timeRange)
| where ProviderName == "Azure Security Center"
| where AlertName == "Phishing content hosted on Azure webApps"
| extend atkentities = parse_json(ExtendedProperties)
//The alert has the domain and the path concatenated, this will separate the path and domain for further queries
| extend phishingPageLocation = tostring(atkentities['URL'])
| extend URI = extract(@"(?:[.][a-z]{2,4}(?:[.][a-z]{2,4})?(/.+[.][a-z]{1,4}))(?:?|$)", 1, phishingPageLocation)
| extend Domain = extract(@"(^.+[.][a-z]{2,4}(?:[.][a-z]{2,4})?)/", 1, phishingPageLocation)
| extend Domain = replace(@"https?://", "", Domain)
| extend ResourceId = tolower(replace(@" ", "", ResourceId))
| project Domain, URI, ResourceId, AlertName, TimeGenerated
//Join with app service HTTP logs
| join (
AppServiceHTTPLogs
| extend ResourceId = tolower(_ResourceId)
| extend URI=CsUriStem
) on ResourceId, URI
The above query can now be expanded to identify different types of malicious activity. Links in phishing emails can perform a range of malicious actions. The user may be redirected to another web server for onward exploitation, the user may be presented with a phishing page to collect credentials or the actor may attempt to deliver a payload to the user.
When users are redirected to another server or resource it is common to see HTTP status codes used, these redirects use a 3xx HTTP status code. The most common status codes for this are: 301 resource moved permanently, and 302 resource moved temporarily. The line of Kusto below can be added to the previous Kusto query to identify these status codes.
| where ScStatus between(300 .. 399)
If the actor is attempting to collect credentials from the user then it is likely they are using a Phishing Kit. Most phishing kits use the HTTP POST method to send credentials from the user to the server, the following line of Kusto can be added to the query to identify POST requests which may indicate collection of credentials.
| where CsMethod == "POST"
In the demo scenario the actor is not attempting to redirect the user or use a phishing kit to collect credentials, it is likely that the actor is using the page to deploy a payload to the user.
Most payload delivery systems will contain logic to profile the potential victim to determine if they can be exploited, it is also common for actors to use allow lists and block lists to prevent security researchers collecting their payloads while ensuring they are delivered to unsuspecting victims.
Running the query above to extract alerts and perform a join on HTTP data shows the following results.

The users that have accessed the page have all received a 200 status code, indicating that the request was successfully responded to by the server. Looking at the data length of the response, stored in the column entitled ScBytes, two distinct byte size ranges can be seen. In this example scenario the actor is using basic allow listing to only deploy the payload to a certain user, with the payload being a 32MB document file. With information about the payload file size it is possible to expand the query to extract only entries where the payload was deployed.
let timeRange = 30d;
let min_payloadsize = 30000;
let max_payloadsize = 35000;
SecurityAlert
| where TimeGenerated > ago(timeRange)
| where ProviderName == "Azure Security Center"
| where AlertName == "Phishing content hosted on Azure webApps"
| extend atkentities = parse_json(ExtendedProperties)
| extend phishingPageLocation = tostring(atkentities['URL'])
| extend URI = extract(@"(?:[.][a-z]{2,4}(?:[.][a-z]{2,4})?(/.+[.][a-z]{1,4}))(?:?|$)", 1, phishingPageLocation)
| extend Domain = extract(@"(^.+[.][a-z]{2,4}(?:[.][a-z]{2,4})?)/", 1, phishingPageLocation)
| extend Domain = replace(@"https?://", "", Domain)
| extend ResourceId = tolower(replace(@" ", "", ResourceId))
| project Domain, URI, ResourceId, AlertName, TimeGenerated
| join (
AppServiceHTTPLogs
| where ScStatus == 200
| summarize make_list(CIp), make_list(TimeGenerated), make_list(UserAgent), make_list(ScBytes) by _ResourceId, CsUriStem
| project list_CIp, list_TimeGenerated, list_UserAgent, list_ScBytes, ResourceId = tolower(_ResourceId), URI=CsUriStem
) on ResourceId, URI
| project AlertName, AlertTimeGenerated=TimeGenerated, Domain, URI, ResourceId, list_CIp, list_TimeGenerated, list_UserAgent, list_ScBytes
| mv-expand list_CIp to typeof(string), list_TimeGenerated to typeof(string), list_UserAgent to typeof(string), list_ScBytes to typeof(int)
| project-rename VictimIP=list_CIp, VictimVisitTime=list_TimeGenerated, VictimUserAgent=list_UserAgent
| order by VictimVisitTime desc
| extend PayloadDelivered = iff(list_ScBytes > min_payloadsize and list_ScBytes < max_payloadsize, 1, 0)
| where PayloadDelivered == 1
| extend visitDetail = pack(VictimVisitTime, list_ScBytes)
| summarize VictimVisits=make_bag(visitDetail), make_set(VictimUserAgent) by AlertTimeGenerated, Domain, URI, ResourceId, AlertName, VictimIP
The results of this query are below.

As seen in the above image, the query provides the IP address of the victim, their user agent and the times that the phishing page was visited. This information can be used to identify potentially compromised client machines both within the organisation that owns the App Service and within external organisations that may have been phished by the actor abusing the legitimate domain.
Ingesting data from App Services diagnostic logging and combining it with Azure Defender alerts in Azure Sentinel has provided the ability to expand a single alert to identify both the potential attacker and client machines that may be victims.
Ingesting alerts from Azure Defender, and additional diagnostic data from Azure App Services, provided a method to enrich and investigate alerts in Azure Sentinel using data that otherwise would not have been available. Being able to merge logging from multiple Microsoft Security products enables a richer understanding of how an attack has unfolded.
The benefit of exposing security log data to the wider Microsoft Security ecosystem was further seen when alerts from Microsoft Defender Officer 365 alerts were seamlessly shared with Azure Defender to generate alerts based on an ongoing phishing campaign.
The principles applied when writing the above hunting queries can be expanded to create further detections and insights. The latest hunting and detection queries developed by the Azure Sentinel team can be found on the Azure Sentinel GitHub.
If you’d like to learn more about how Microsoft is developing techniques to detect web shells, check out the following:
Integrating Azure Web Application firewall with Azure sentinel: https://techcommunity.microsoft.com/t5/azure-network-security/integrating-azure-web-application-firewall-with-azure-sentinel/ba-p/1720306
Hunting for web shells using Azure Sentinel: https://techcommunity.microsoft.com/t5/azure-sentinel/web-shell-threat-hunting-with-azure-sentinel-and-microsoft/ba-p/1448065
Recent GADOLINIUM activity that utilised web shells: https://www.microsoft.com/security/blog/2020/09/24/gadolinium-detecting-empires-cloud/
More examples of major attacks utilising web shells: https://www.microsoft.com/security/blog/2020/02/04/ghost-in-the-shell-investigating-web-shell-attacks/
by Contributed | Sep 29, 2020 | Azure, Technology, Uncategorized
This article is contributed. See the original author and article here.
Organizations are increasingly moving to Microsoft Azure, and the recent rise in distributed workforces has accelerated the pace. Just a few years ago, most applications were lifted and shifted from on-premises to the cloud before companies started to favor deploying cloud-native applications. However, with the COVID-19 pandemic forcing more employees to work from home, the lift-and-shift approach to the cloud has once again gained momentum.
Tushar Richabadas, Senior Product Manager – Application Security, Barracuda, explains how Barracuda WAF-as-a-Service, available in the Microsoft Azure Marketplace, addresses some of the security issues caused by a rapid shift to the cloud from on-premises:
Companies are moving to the cloud faster than ever to accommodate the surge of employees working from home. Applications that were previously accessible only over a company’s intranet must now be accessible from the internet. However, security can often take a back seat when providing a distributed workforce with fast application access – causing problems later.
One such problem is possible security gaps. This necessitates products that secure deployments in the journey to the cloud. Starting from secure remote access to protecting against application attacks and DDoS, enterprises need solutions that are easy to deploy and fully automated for rapid deployments.
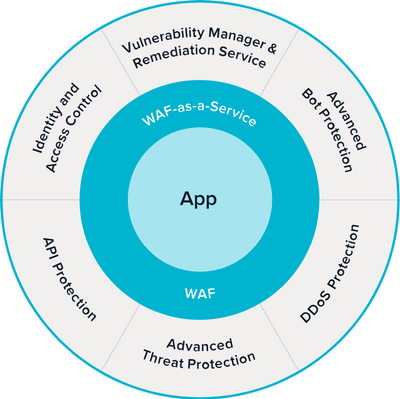
Barracuda CloudGen WAF for Azure and Barracuda WAF-as-a-Service protect web, mobile, and API applications against all application attacks, including zero-day attacks, DDoS attacks, and malicious bot attacks. Their Advanced Bot Protection capability uses Azure Machine Learning to identify and block advanced almost-human bots and account-takeover attempts.

Looking for a solution your organization will manage? Barracuda CloudGen WAF for Azure can offload authentication and help enforce two-factor authentication (2FA), single sign-on (SSO), and multi-domain SSO. It can also communicate with Azure Active Directory, Active Directory Federation Services, or any LDAP, RADIUS, SAML, or OpenID Connect solution to provide access control to applications.
If you have a distributed workforce that needs to access applications from geo-dispersed locations, Barracuda WAF-as-a-Service offers the same proven application security, but as a service hosted on Azure. Barracuda WAF-as-a-Service is deployed in every Azure region worldwide and allows users to add endpoints to the regions closest to their customers and/or workforce to provide fast and secure application access.
Barracuda solutions for Azure are built to work in a near-native manner. CloudGen WAF for Azure delivers complete application security and integrates closely with Azure services, including virtual machine scale sets, Azure Active Directory, log analytics, Event Hubs, and more. Barracuda WAF-as-a-Service is built on Azure and provides the same level of security, as a service.
As e-commerce and distributed workforces continue to grow around the world, ensure your organization provides customers and remote employees with secure, reliable access to the applications they need to keep business moving forward.
Learn more about Barracuda WAF-as-a-Service and see a product demo in this on-demand webinar featuring Keith Vidal, Director Business Program Management, Microsoft; Nitzan Miron VP Product Management, Application Security, Barracuda Networks; and Shab Jahan, Product Marketing Manager, Public Cloud, Barracuda Networks.


Recent Comments