by Contributed | Oct 29, 2020 | Technology
This article is contributed. See the original author and article here.
With so many external cyber threats facing Government agencies, it can be easy to overlook risks from insiders that may have malicious objectives or that may make unintentional but serious mistakes. Digital transformation and modernization of Government agencies have enabled new efficiencies and created an exponential increase in data that is stored and processed digitally. As an agency’s data becomes increasingly digital, many of the physical security and privacy risks associated with that data become digital as well. Cyber threats from entities outside of an organization are often well-known as a result of press attention and industry threat intelligence sharing; however, cyber threats from individuals inside an organization are less well-known despite being fairly common. A study by Delloitte found that 59% of employees who leave an organization take sensitive data with them and 25% of employees have used email to exfiltrate sensitive data from an organization.
What is an insider?
Let’s start with the definition of an insider – an insider is a person working within a group or organization, often privy to information unavailable to others. The key aspect of this definition with security implications is that there is an expectation that this person will have additional direct or indirect access to information that others would not. As a result, a simple “deny access” approach that might work as an outsider strategy cannot be applied to insiders. Third parties such as contractors, subcontractors, vendors, and suppliers are also considered insiders when they receive additional access to people, devices, or information. Once an individual is authorized to access the information or system, defensive tactics move beyond the realm of simple access management into managing risk from authorized users – a realm defined by monitoring usage and behavior. Continuous monitoring is essential, but telemetry alone will not result in successful mitigation of risks from insiders. The difference between legitimate and illegitimate activity often boils down to discerning intent and context more so than assessing the legitimacy of a single isolated event.
What are the risks?
Insider risks span a broad range of possibilities including theft, data spillage, security control violations, compliance violations, espionage, sabotage, and workplace harassment or violence. Sufficiently addressing these risks requires having the right people and processes in place empowered by the right technology to glean insights and assess the possible risks at scale. Analysts and investigators need to be able to prioritize investigations based upon an incident’s full context, impact, and intent. To make meaningful assessments quickly they need to have all relevant information available at their fingertips and receive only those cases that have a sufficiently high degree of confidence.
Zero Trust
Zero Trust is a strategy that has been gaining significant momentum in the public sector. One of the key assertions of a Zero Trust strategy is that a device or user should not be considered trusted just because it is operating on a trusted internal network. The same Zero Trust approach can also be applied to insider risks, by asserting that actions taken by insiders should not be considered trusted or “safe” just because of an individual’s position within an organization. Moving beyond reliance on simple allow/deny access controls towards continuous monitoring of activities and contextual risk is a proven Zero Trust methodology that can also advance insider risk reduction efforts. The additional telemetry and context in a Zero Trust implementation provide more opportunities to detect risky activity.
Using Predictive Analytics
Predictive analytics are essential to realizing a successful continuous monitoring program that can effectively mitigate risks from insider threats at scale. Taking a reactive or “forensic-only” approach by waiting until after the impact has been discovered opens an organization up to a massive and unnecessary level of risk. In contrast, a proactive approach can provide early warnings and mitigation opportunity prior to impact. A proactive approach becomes even more effective when it is made predictive through intentional planning and optimization for the most likely insider risk scenarios.
Step 1 – Gathering Intelligence
The first step towards predictive analytics is to research and obtain high quality threat intelligence which allows for refining the objectives of the continuous monitoring program and yields a high return on investment. Insider threat intelligence is not made up of network indicators or file hashes, but rather details of common tactics and techniques used by insiders. Insights from studying previous insider cases within your own agency or from a similar agency are especially useful for harvesting priority scenarios since past behavior can be a powerful indicator of future risk. In the absence of case studies, court records can also provide valuable insights into tactics and techniques used by insiders. Third–party threat intelligence from vendors is also a significant asset that can help surface global trends or tactics at an application/workload level. Carnegie Mellon University also maintains a publicly available set of insider threat resources. The outcome of this research activity should be the prioritization of specific scenarios that can reveal optimal detections of specific tactics and techniques based upon which ones are most likely to be used within your agency and those that would have the greatest impact if left undetected. For planning purposes, these scenarios should also be separated into the two major categories of intentional threats (malicious insider) and unintentional threats (insider who makes a mistake or is compromised by social engineering), to ensure adequate coverage for each.
Step 2 – Collecting Telemetry
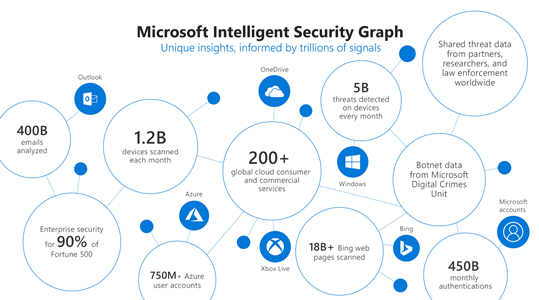
The second step is to ensure that the necessary telemetry is available to enable direct or indirect monitoring of the priority scenarios. Identifying the core priority scenarios during the first step should drive the planning done during this step to reduce cost and ensure that the data being collected is needed and once collected becomes fully utilized. At Microsoft we use telemetry from various logs, activities, entity relationships, and alerts to build the Microsoft Intelligent Security Graph that provides threat insights and informs detections in our products.

Step 3 – Targeting Detections
The third step is to implement detections for each activity in the priority insider risk scenarios using the telemetry gathered in step two. To minimize complexity and maintenance of these detections, make use of workload-specific or activity-specific detections from vendors wherever possible such as Microsoft 365 Security solutions to monitor threats and actions in productivity workloads. Achieving a breadth of detections for each activity in the chain of each scenario over time is as important as achieving high quality individual activity detections. Detections that are small in scope, testable, and explainable generally are the best.
Step 4 – Machine Learning
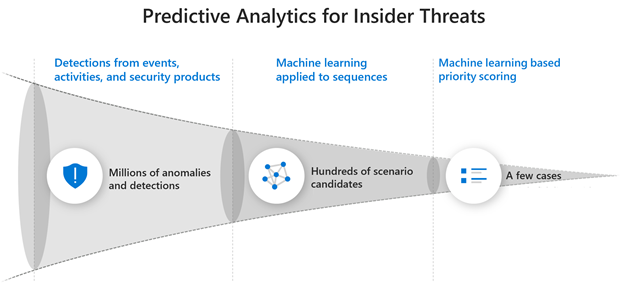
The fourth step is to leverage pre-built machine learning (ML) capabilities such as those in Insider Risk Management whenever possible that are already tuned for your prioritized scenarios. You can also Build-Your-Own ML with Azure Sentinel. Azure is uniquely suited for building your own cyber ML with Sentinel’s entity extraction, cloud scale query capabilities, long-term data retention, notebooks for research, and Azure’s just-in-time compute availability for model training. We have found that using machine learning models is a necessity to address insider risk challenges at scale. Successful detection of insider threats often requires much more data over a greater time period than the detection of external threats. Without machine learning, detections become too complex for maintainable rules, queries over large time periods become memory and compute intensive, and maintaining performance becomes costly. Effective ML solutions for insider risk extend beyond context correlation or anomaly detection and are trained on specific threats from priority scenarios across sequences of activities and behaviors to predict an individual’s intent. Microsoft utilizes a comprehensive ML lifecycle to constantly research, engineer, and tune many different types and combinations of models for insider risk. For large organizations it is impossible to rely on anomaly detections or event correlation alone to surface risks. Without a predictive analytics approach the number of possible cases per month can easily range from thousands to millions.
Culture and Balance
Strategies to address risks from insiders also need to be balanced appropriately such that they do not disrupt an agency’s mission, reduce worker productivity, or undermine trust in the organization. Telemetry should be pervasive but not invasive, appropriately considering both employee privacy and organizational risk. A successful program also requires collaboration across HR, legal, and privacy teams to determine how to best address the organization’s priority risk scenarios. Having a broad base of stakeholders can ensure that a positive culture is maintained in the organization and that investigations are handled in a manner that has been established with broad agreement and support.
More Information
To find out more about how Microsoft is addressing insider threats with predicative analytics read a post on Risk Management on our Microsoft AI blog or watch Microsoft CISO Bret Arsenault discuss our Insider Risk Management strategy in detail on the Microsoft Mechanics channel. You can also find out more about how to integrate additional ML detections into your investigation workflow using the capabilities of Azure Sentinel.
by Contributed | Oct 29, 2020 | Technology
This article is contributed. See the original author and article here.
By: Aasawari Navathe – Program Manager 2 | Microsoft Endpoint Manager – Intune
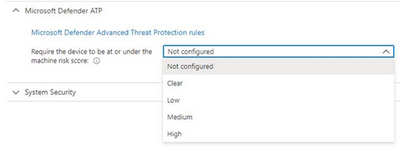
Microsoft Defender for Endpoint (formerly, Microsoft Defender ATP) risk evaluation settings for iOS compliance policies are now in Public Preview in the Microsoft Endpoint Manager admin center. We are excited to share this public preview, as several customers have been waiting for this capability. Customers can find the setting for Microsoft Defender for Endpoint when they make a new device compliance policy for iOS, where they can set devices to be marked as non-compliant if a specific machine risk score (Clear, Low, Medium, High) is not met.

App Availability
The Defender for iOS app is available in public preview via TestFlight. To install the app, end users can visit https://aka.ms/defenderios on their iOS devices. This link will open the TestFlight application on their device or prompt them to install TestFlight. On the TestFlight app, follow the onscreen instructions to install Microsoft Defender.
Connect iOS Devices to Defender
To complete the scenario, you need to make sure you have completed the proper connection for iOS devices between Microsoft Endpoint Manager and Microsoft Defender for Endpoint within your connector setup. Please note that both products must be licensed correctly for the scenario to work. To learn more, see the documentation here: Enforce compliance for Microsoft Defender ATP with Conditional Access in Intune and https://aka.ms/mdatpiosdocumentation.
Let us know if you have any additional questions on this by replying back to this post or tagging @IntuneSuppTeam out on Twitter.

by Contributed | Oct 29, 2020 | Technology
This article is contributed. See the original author and article here.
Introduction
In this document we will describe a method of setting up periodic niping monitoring within an SAP infrastructure driven by the Telegraf monitoring agent, and reported via the Azure Monitor facility.
Disclaimer
We do not guarantee that documented configurations are correct or the best way to implement a function – the intention of creating this document is to describe a configuration that AGCE team has created and customers have found useful.
Overview
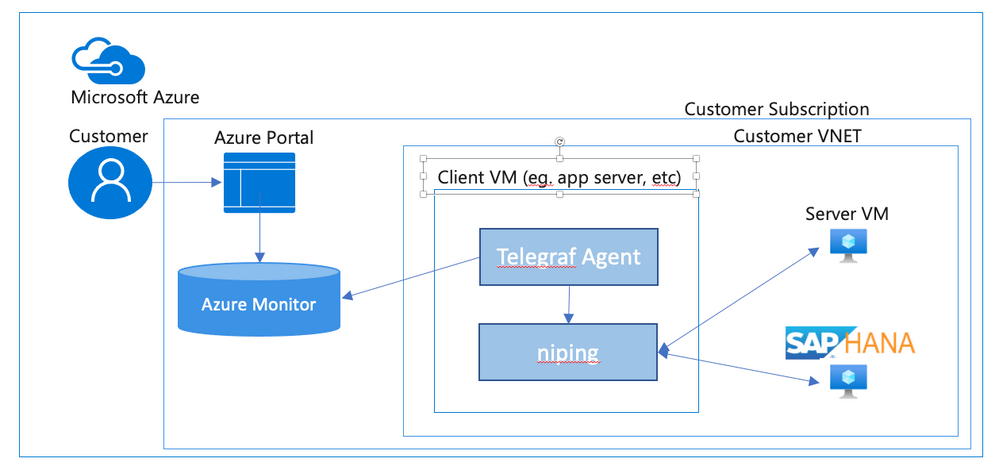
In an SAP environment it is useful to monitor various aspects of the VMs in the landscape, and to collect and alert on that monitored data. This is an example of setting up SAP niping to periodically report the inter-VM latency, specifically between the application servers and the ASCS, as well as between the application servers and the database. Here is a diagram of the configuration that we describe in this document:
SAP provides the niping application that is useful for network testing – there is a blog post describing the use of niping here. It can test latency, throughput and stability – in this document we will focus on its latency testing capability. niping is typically used for initial validation of an environment (i.e. not under any significant loading) and is not generally used continuously. However, this does provide a great example for this document, and a similar architecture can be used to monitor many other OS and SAP metrics. Please keep in mind that the measured latency between servers will vary based on the network load on the servers at the time.
In this solution we will use the InfluxData Telegraf agent described in Azure documentation. This agent runs on the monitored VMs and sends the collected data to Azure Monitor. If you don’t want to use telegraf you can collect the test data from niping and send the result to Azure monitor yourself. This would likely be done in a shell script scheduled with cron – however, this configuration won’t be described in this document.
Requirements for this configuration
This solution has the following technical requirements:
niping application from SAP for network latency testing.
telegraf monitoring agent for invoking niping and sending the data to the Azure Monitor database.
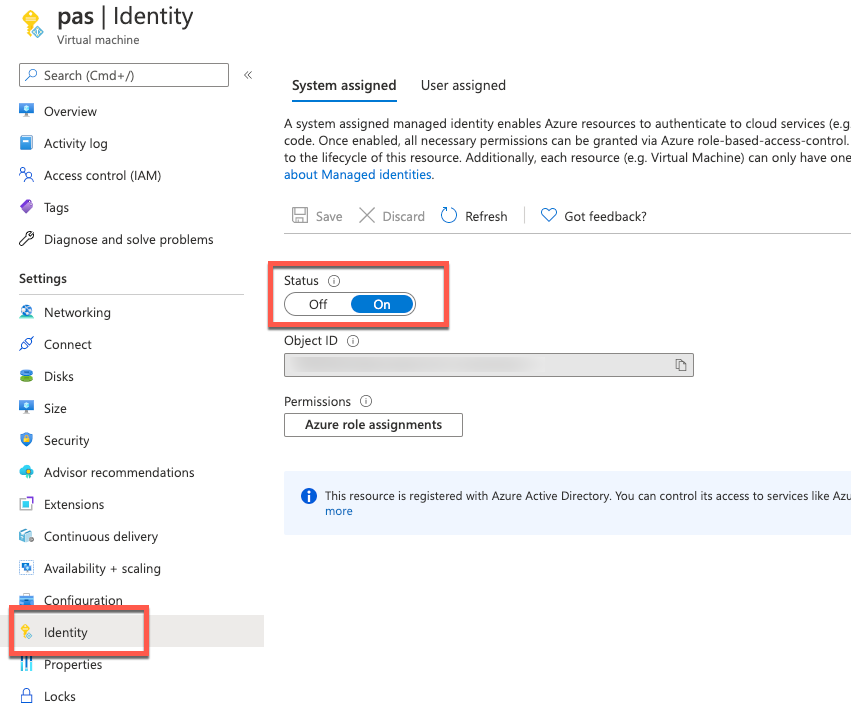
system assigned identity for the virtual machine
virtual machine must be able to make requests to the Azure API, which is “Internet facing”. This will typically require firewall access to any applicable firewalls or network appliances.
Installation & Configuration of NIPING on NIPING servers
The NIPING application is provided by SAP, as described in SAP Note 500235 Network Diagnosis with NIPING and is delivered in SAP kernel releases, as well as via SAPROUTER.
Download the latest version of the SAPROUTER SAR file, and place it onto all VMs to be tested. Use the sapcar program to unpack the SAR file, and place the niping program in a logical place. In this example, we will put all executable files in /usr/local/bin.
# ./sapcar -xf ./saprouter_710-80003478.sar

# cp niping /usr/local/bin
On all VMs that will be niping servers (i.e. the HANA database, and the ASCS), we need to create a system service that will run the niping service. Create the file /usr/lib/systemd/system/niping-server.service, with the following contents:
[Unit]                                                                                                                                                                     │

Description=SAP niping server                                                                                                                                              │

After=network.target                                                                                                                                                       │

                                                                                                                                                                           │

[Service]                                                                                                                                                                  │

Type=simple                                                                                                                                                                │

Restart=always                                                                                                                                                             │

ExecStart=/usr/local/bin/niping -s -I 0                                                                                                                                    │

ExecReload=/bin/kill -HUP $MAINPID                                                                                                                                         │

                                                                                                                                                                           │

[Install]                                                                                                                                                                  │

WantedBy=multi-user.target
Do the following commands to make the niping service start on reboot, and to start it immediately:
#systemctl enable niping-server

#systemctl start niping-server
You can now verify that the niping program is running by doing the following:
#ps -eaf | grep niping

root      49966      1  0 14:54 ?        00:00:00 /usr/local/bin/niping -s -I 0

root      49970  47606  0 14:54 pts/0    00:00:00 grep –color=auto niping
Installation of NIPING on other servers
On the other servers in the environment, simply install the NIPING program. Use the sapcar program to unpack the SAR file, and place the niping program in a logical place. In this example, we will put all executable files in /usr/local/bin.
# ./sapcar -xf ./saprouter_710-80003478.sar

# cp niping /usr/local/bin
To test the niping connectivity to one of the servers (eg. hana1), you can do the following:
# /usr/local/bin/niping -c -H hana1
Thu Oct  1 15:19:57 2020

connect to server o.k.

send and receive 10 messages (len 1000)
——- times —–

avg     0.883 ms

max     1.108 ms

min     0.725 ms

tr   2210.668 kB/s

excluding max and min:

av2     0.875 ms

tr2  2231.505 kB/s
Note for clustered instances
In Azure, we use an Azure basic or standard load balancer to provide a “floating IP” for backend instances in a cluster. When testing the niping latency, you may want to test the latency to either individual instances behind the load balancer (i.e. use the actual hostname or IP address), or use the floating ip address, which is the frontend address in the load balancer. If you want to do the latter, make sure that the load balancer has the HA Ports configuration enabled (for the Standard Load Balancer), or you have a load balancer rule for the port that niping uses (default 3298).
Creation of niping shell script
On the monitored instances, we will use a shell script to execute niping and process the output into a Comma Separated Value (CSV) format. Create a file /usr/local/bin/niping_csv.sh with the following text:
#!/bin/bash

# set -x

/usr/local/bin/niping -c -H $1 -B 10 -L 60  -D 15 | tail -n 8  | head -n 7 | grep -v excluding | awk ‘

{

    for (i=1; i<=NF; i++)  {

        a[NR,i] = $i

    }

}

NF>p { p = NF }

END {

    for(j=1; j<=p; j++) {

        str=a[1,j]

        for(i=2; i<=NR; i++){

            str=str”,”a[i,j];

        }

        print str

    }

}’ | head -n2
Then, make the shell script executable by performing chmod a+x /usr/local/bin/niping_csv.sh. You can test this by doing:
# /usr/local/bin/niping_csv.sh hana1

avg,max,min,tr,av2,tr2

1.217,5.405,0.833,16.053,1.151,16.967
This script runs niping with these parameters -c -H $1 -B 10 -L 60 -D 15, which are (in order)
-c run this as the client side of NIPING
-H $1 do niping tests against the host specified as the first parameter, we will pass this from the telegraf monitoring script
-B 10 use a 10 byte buffer size. This is appropriate for latency testing
-L 60 run 60 iterations of the test
-D 15 delay 15 milliseconds between iterations
Of course you can modify these parameters as you see fit for your testing scenario. The rest of the shell script takes the output from niping and formats it as a CSV (comma separated value) file for easy injestion into telegraf.
Installation of Telegraf monitoring agent
Before installation of telegraf, the monitored VMs must have credentials to upload data into Azure monitor. There are several ways to provide this identity (as described in the Telegraf source github repo), but the simplest way is to use the “system-assigned identity” in the VM, which we will configure next. Go to the Azure portal, view the VM, and navigate to the Identity tab, and ensure that your VM has a system-assigned identity set to On.
To install telegraf, refer to the Influxdata documentation. First install support for the go programming language. In SLES 12 SP3, you need to add the proper repo for go:
zypper addrepo https://download.opensuse.org/repositories/devel:languages:go/SLE_12_SP3/devel:languages:go.repo

zypper refresh

zypper install telegraf
Telegraf is configured via the file /etc/telegraf/telegraf.conf, which is installed with some default configurations. We are going to have a custom configuration though, that will invoke our shell script via the Telegraf “exec” input plugin. We’ll create this configuration with the following step:
telegraf –input-filter exec –output-filter azure_monitor config > azm-telegraf.conf
Then open the azm-telegraf.conf with your editor, and find the section starting with
###

#                            INPUT PLUGINS                                    #

###
Replace the text, starting with [[inputs.exec]] to the end of the file with the following:
[[inputs.exec]]

  commands = [

    “/usr/local/bin/niping_csv.sh hana1”

  ]
  timeout = “5s”

  name_suffix = “_niping_hana”

  data_format = “csv”

  csv_header_row_count = 1
Of course, replace “hana1” with the name or IP address of the server you are testing the latency to. You can find more information on the exec input handler in the telegraf documentation.
You can test this by running the following:
# telegraf –config ./azm-telegraf.conf –test

2020-10-02T00:47:26Z I! Starting Telegraf

> exec_niping_hana,host=pas av2=0.958,avg=0.961,max=1.315,min=0.776,tr=20.328,tr2=20.39 1601599648000000000
Copy and activate the telegraf.conf file to the configuration directory:
# sudo cp azm-telegraf.conf /etc/telegraf/telegraf.conf

# systemctl restart telegraf
At this point, telegraph should be regularly executing the niping program, converting its output to CSV, and uploading the resulting data to Azure Monitor. Check the /var/log/messages file to see if there are any errors, using grep telegraf /var/log/messages.
Configuration of the telegraf agent is via the /etc/telegraf/telegraf.conf file. Looking at that file, you should see something like this near the beginning:
[agent]

  ## Default data collection interval for all inputs

  interval = “10s”
This sets the telegraf agent to run every 10 seconds, and it will run the above shell script and niping every 10 seconds as well. You can adjust this interval within practical limits. More configuration options are documented in the telegraf github repo.
Plot your niping data in the Azure portal
Open the Azure Portal, and navigate to the Monitor tab, then select Metrics, and select the VM you installed telegraf on in the resource selector.
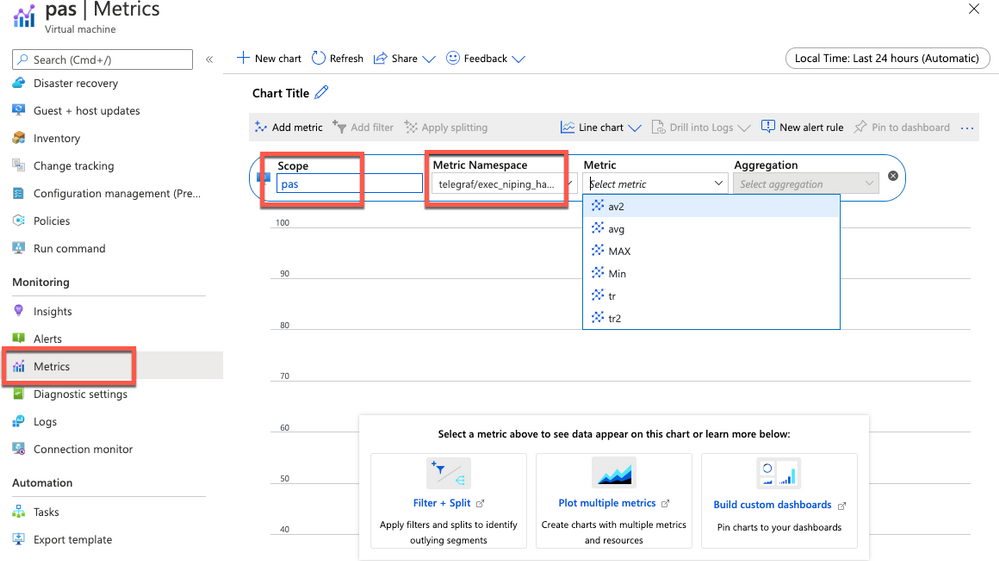
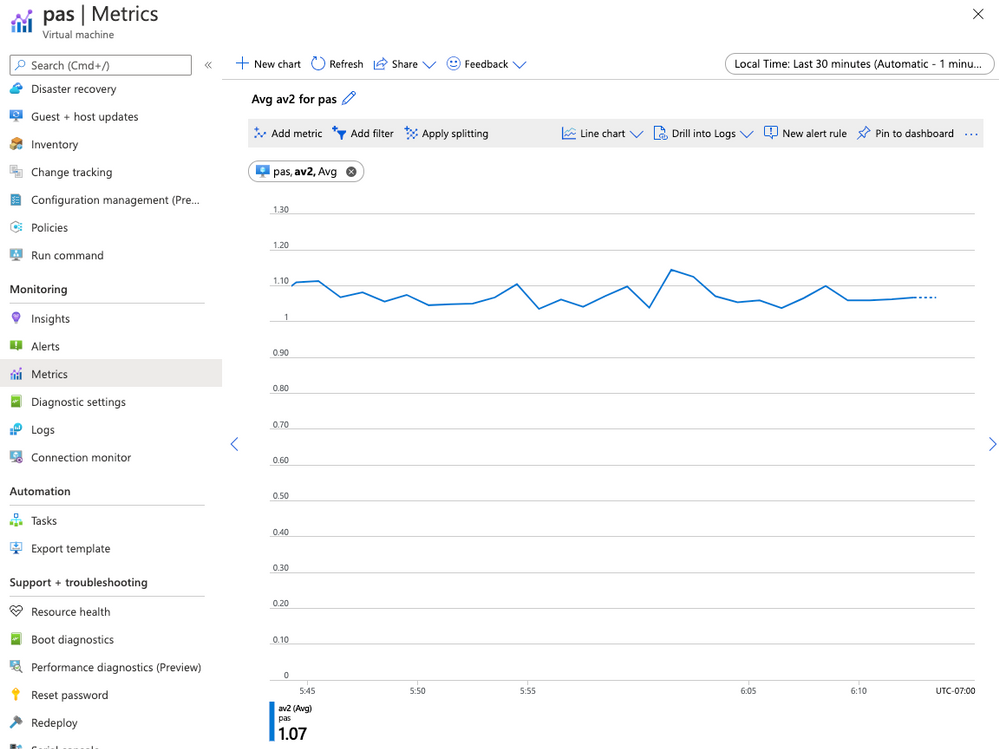
Select the Telegraf/execnipinghana namespace, and select the av2 metric.
Additional monitoring configuration
You can have multiple [[inputs.exec]] sections in the telegraf.conf file if you want to test niping against multiple servers (i.e. the database and the ASCS). You can also configure the niping to test latency through the floating IP/load balancer front end IP address for clustered instances if you would like to, as described in the note for clustered instances above.
There are also over 150 input plugins available in the Telegraf agent that you can find in the InfluxData list of supported plugins, and creative use of the exec plugin (as we’ve used above) can monitor virtually anything on the VM.
You can create alerts on the data you are collecting. For example, you could create an alert that fires whenever the average of the av2 metric goes over a certain value, using a rolling 5 minute average evaluated once per minute.

by Contributed | Oct 29, 2020 | Technology
This article is contributed. See the original author and article here.

Hi IT Pros,
I would like to continue the blog about Microsoft Defender for Identity with topic related to the daily operation of SecOp Team who traces all attacks against Identities stored in your on-prem Active Directory domain controllers.
Please review and give your feedback.
In Cyber Environment, where is an estimation of 81% breaches originated from compromised identities. Then, protecting the privileged accounts and monitoring their activities within Active Directory perimeter is of utmost importance.
The Microsoft Defender for Identity (Azure Advanced Threat Protection) service could serve for that main purpose and should be part of the Corporate ‘s defender strategy.
Daily operation of Microsoft Defender for Identity is key to identify the identity breaches and identity attacks.
Microsoft Defender for Identity Information integrated with Cloud App Security (CAS) service.
By default MD for Identity is integrated with CAS, account timeline, account activity, assessment information is displayed in Cloud App Security portal under the first column menu items named Dashboard, Investigation, Control and Alert.
The recommendation for CAS portal use includes the following:
- When using Microsoft Defender for Identity service together with Cloud app security service, closing alerts in one service will not automatically close them in the other service. You need to decide where to manage and remediate alerts to avoid duplicated efforts.
- Microsoft Defender for Identity alerts are displayed within the Cloud App Security Alerts queue. To view, filter alert by app: “Active Directory” as shown:

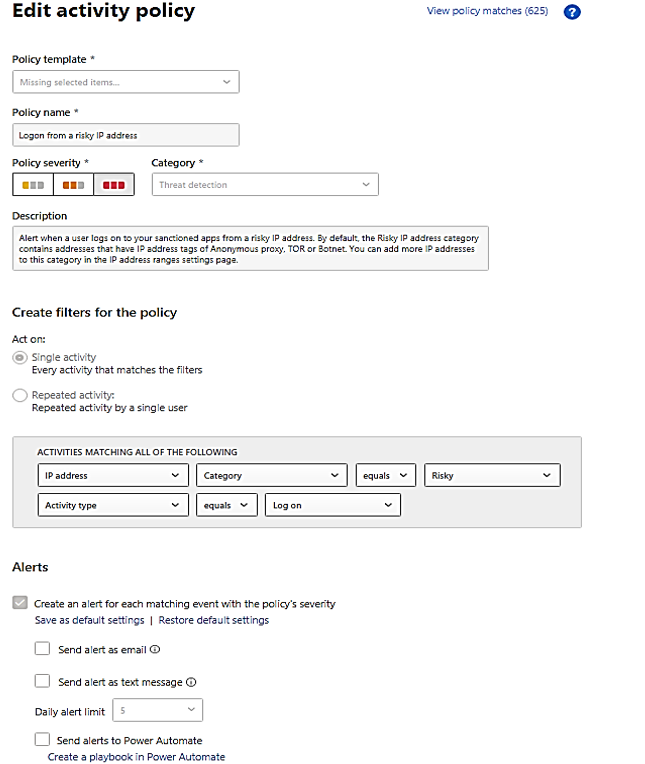
- Alert could be dismissed or resolved as “unread” as “adjust policy.”

A “Resolve” with action of adjusting policy and make change to policy:
- You could filter alerts by policy, there are about 72 built-in policies plus your custom policies. The identity policies or AD related policies are included in the following table:
Policy Name
|
Policy Description
|
Suspicious additions to sensitive groups
|
Attackers add users to highly privileged groups.
|
Suspected skeleton key attack (encryption downgrade)
|
Encryption downgrade is a method of weakening Kerberos so password hash could be obtained by hackers.
|
Suspected brute force attack (LDAP)
|
In a brute-force attack, an attacker attempts to authenticate with many different passwords for different accounts until a correct password is found.
|
Suspected brute force attack (Kerberos, NTLM)
|
Same as above
|
Network mapping reconnaissance (DNS)
|
Collect DNS server data which contains a map of all the computers, IP addresses, and services on your network.
|
Suspicious communication over DNS
|
Attackers on an effected computer may abuse the DNS protocol, which is often less monitored and is rarely blocked,
|
Unusual administrative activity (by user)
|
users perform multiple administrative activities in a single session with respect to the baseline learned,
|
Activity was performed by a terminated user.
|
A terminated user performs an activity in a sanctioned corporate application.
|
Impossible travel
|
activities are detected by the same user in different locations within a time period.
|
Activity from an infrequent country
|
activity is detected from a location that was not recently or never visited by the user or by any user in the organization.
|
Activity from anonymous IP addresses
|
identifies activity from an IP address that has been identified as an anonymous proxy IP address and it may be used for malicious intent.
|
Unusual, impersonated activity (by user)
|
users perform multiple impersonated activities in a single session with respect to the baseline learned,
|
Unusual file deletion activity (by user)
|
users perform multiple file deletion activities in a single session with respect to the baseline learned,
|
Multiple failed login attempts
|
users perform multiple failed login activities in a single session with respect to the baseline learned,
|
Multiple storage deletion activities
|
users perform multiple storage deletion or DB deletion activities in a single session with respect to the baseline learned.
|
Risky sign-in
|
Azure Active Directory (Azure AD) detects suspicious actions that are related to user accounts.
|
Suspected DC Shadow attack (domain controller promotion)
|
Attackers create a rogue DC and make AD replication it.
|
Suspected identity theft (pass-the-ticket)
|
lateral movement technique in which attackers steal a Kerberos ticket from one computer and use it to gain access to another computer.
|
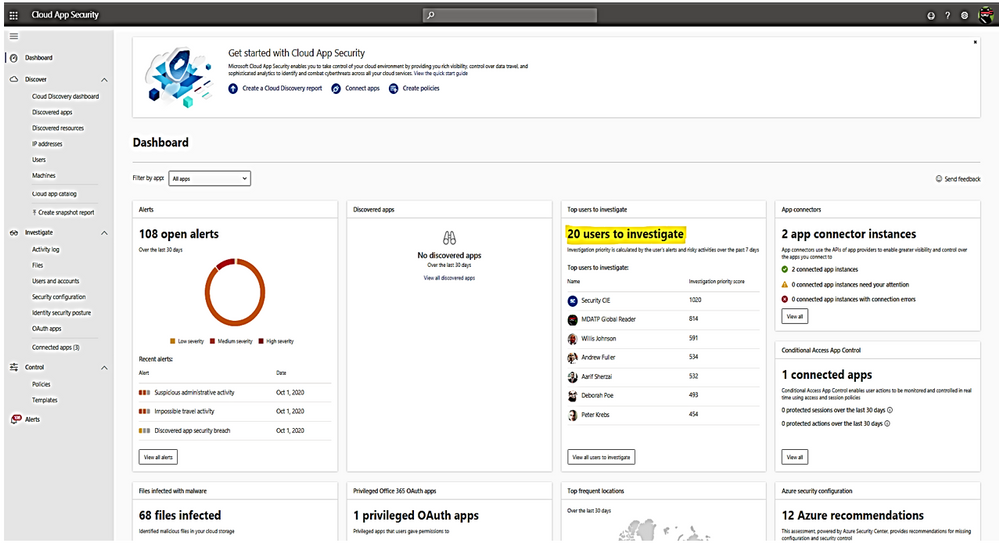
Cloud App Security Dashboard – Investigation Priority Score for Users:
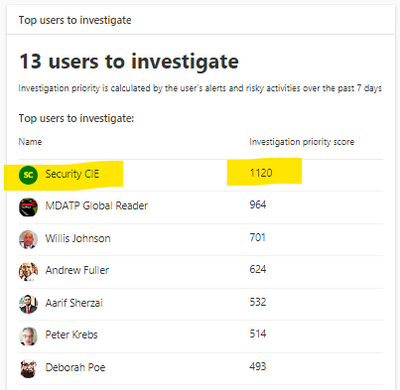
- CAS dashboard shows top users who need to be investigated.
- Evaluated data come from Microsoft Defender for Identity , Microsoft Cloud App Security as well as Azure AD Identity Protection
- Score points are based on security alerts, risky activities, and potential business and asset impact related to each user.
- Calculation is done over a period of 7 days.
Recommended investigation steps for suspicious users
- Choose the “Top users to investigate”.
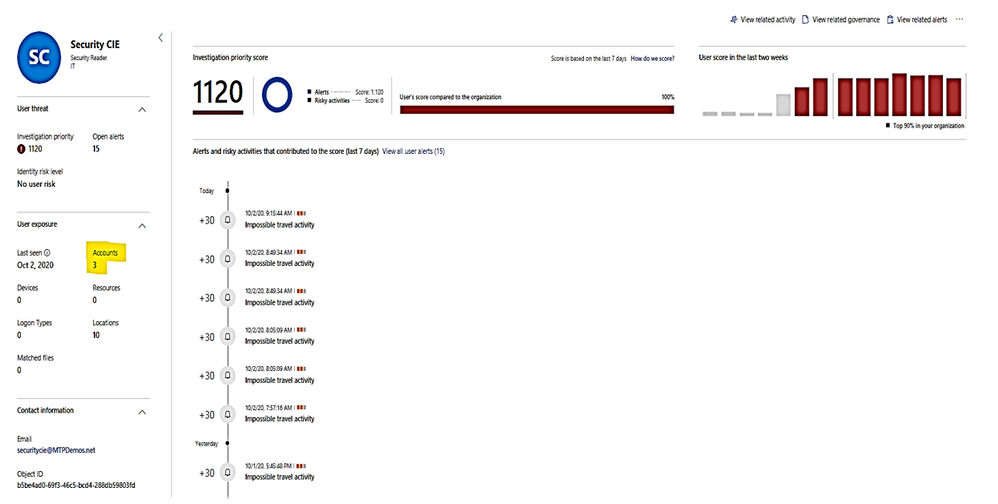
Microsoft Defender for Identity alert evidence and lateral movement paths provide clear indications when users have performed suspicious activities or indications exist that their account has been compromised.
We need to take the following actions:
- Gather information about the user.
- Investigate activities that the user performed.
- Investigate resources the user accessed.
- Investigate lateral movement paths.
- Who is the user and what are the multiple accounts been used?
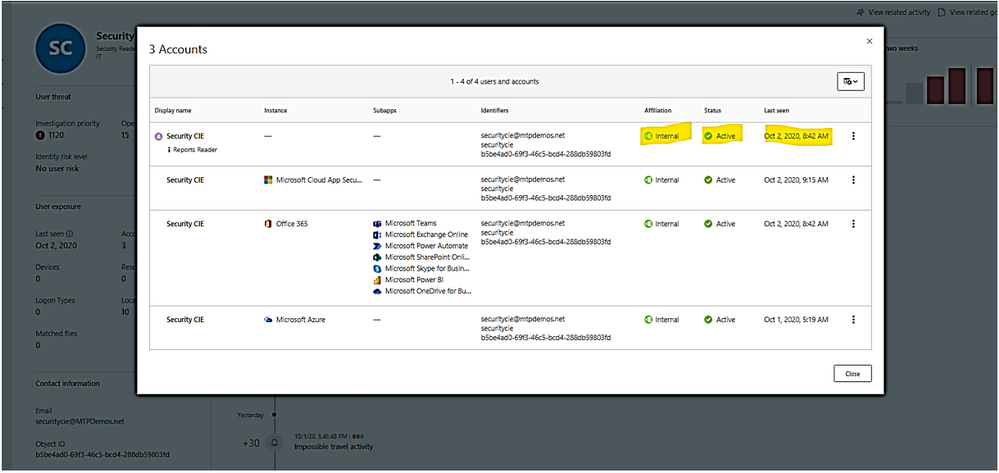
- Is the user a sensitive user (such as admin, or on a watchlist, etc.)?
- What is their role within the organization?
- Are they significant in the organizational tree?
II. Suspicious User’s activities to investigate:
- Does the user have other opened alerts in Microsoft Defender for Identity, or in other security tools such as Windows Defender-ATP, Azure Security Center and/or Microsoft CAS?
The alerts could be filtered and viewed by one or multiple categories included:
– Access control,
– Cloud Discovery (Reconnaissance),
– Compliance, Configuration control,
– DLP (Data Lost Prevention),
– Privileged accounts,
– Sharing control,
– Threat detection.
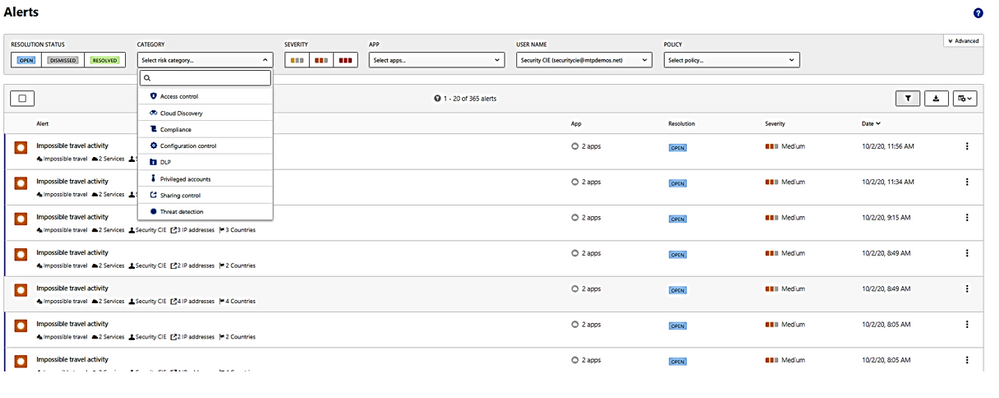
2. What is the activities done by this User?
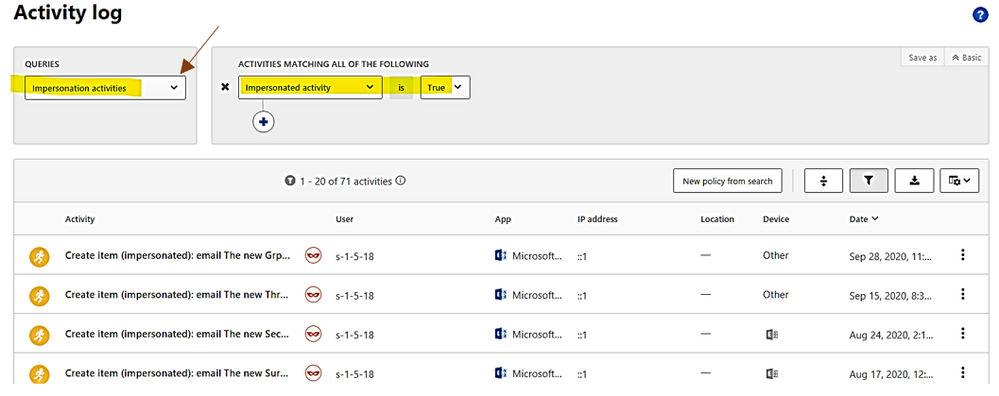
In activities, you could choose the following queries for investigation: Admin activities, Domain activities, Failed log in, File and folder activities, Impersonation activities, Mailbox activities, Password changes and reset requests, Security risk, Sharing activities, Successfully log in, your saved custom query
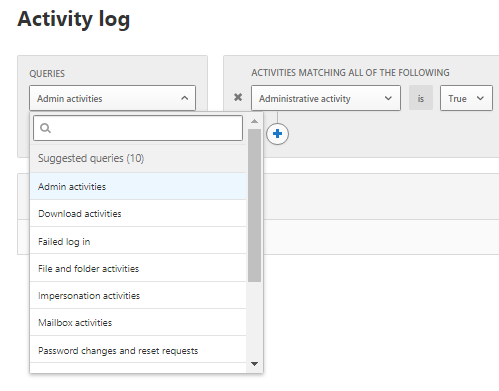
3. Did the user have multiple failed logon attempts in a brief period?
4. Which resources did the User access to?
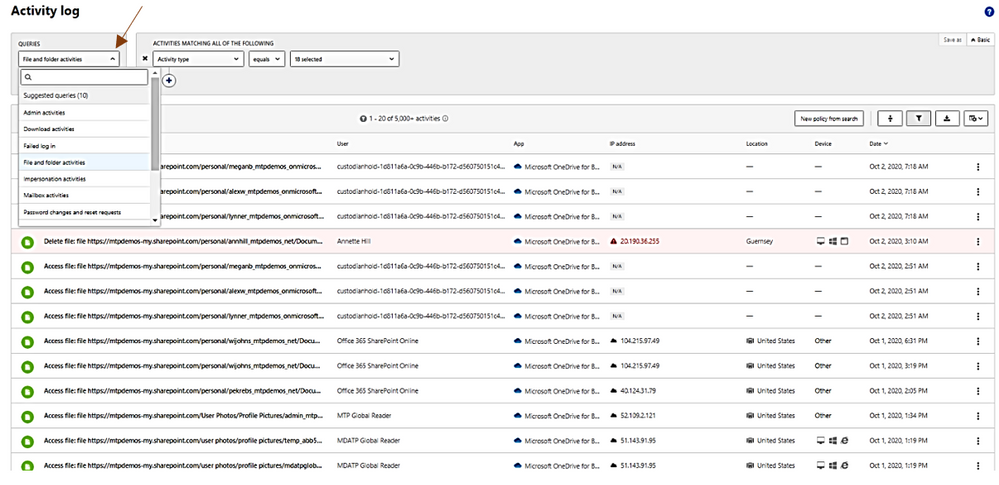
5. Did the user access high value resources?
6. Was the user supposed to access the resources they accessed?
7. Which computers did the user log in to?
8. Was the user supposed to log in to those computers?
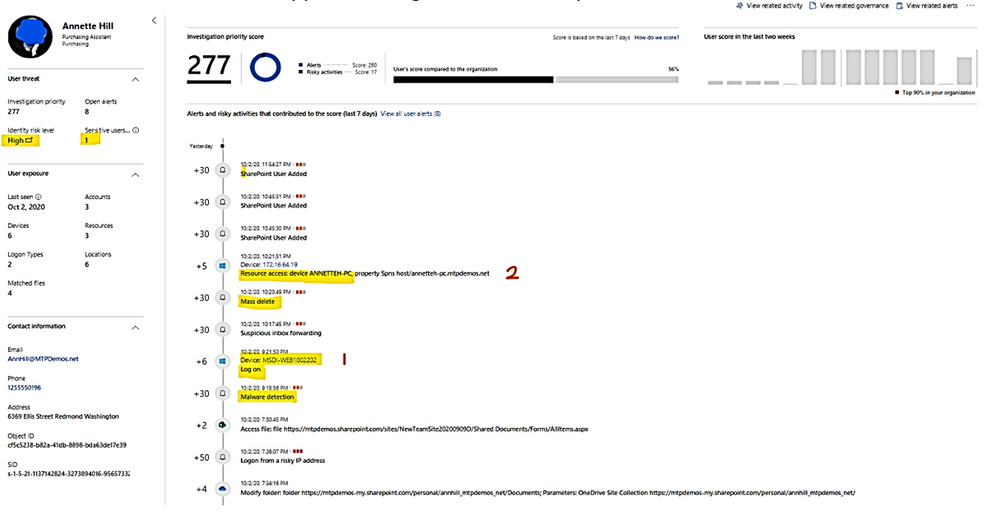
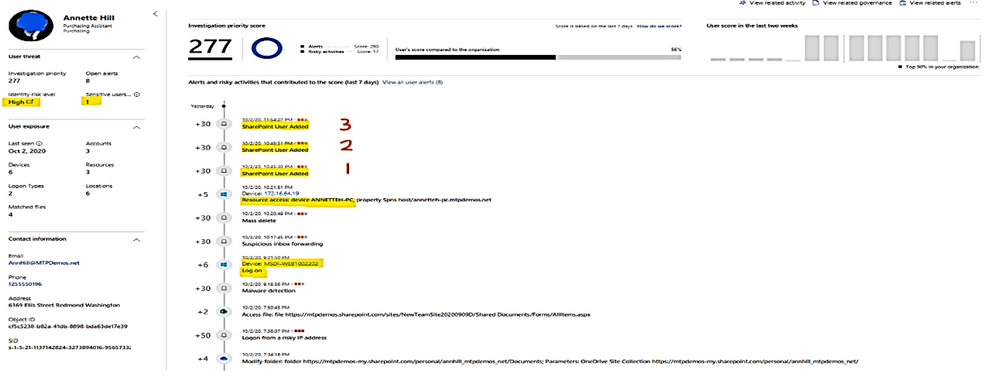
9. Is there a lateral movement path (LMP) between the user and a sensitive user?
LMP-Impersonate privilege account.
LMP-Suspicious group membership has been changed.
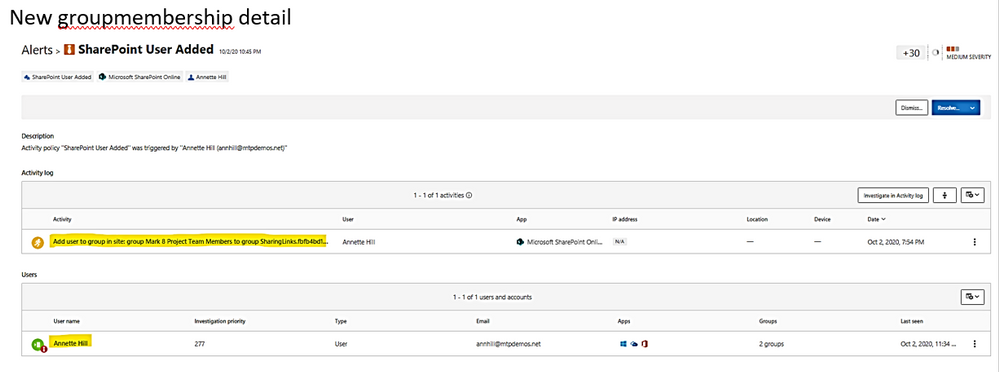
Click on each timeline 1, 2, 3 below to get the group names of which new membership is added.
New groupmembership detail
10. View all other alerts about the related User by click on link “view all User alerts”.
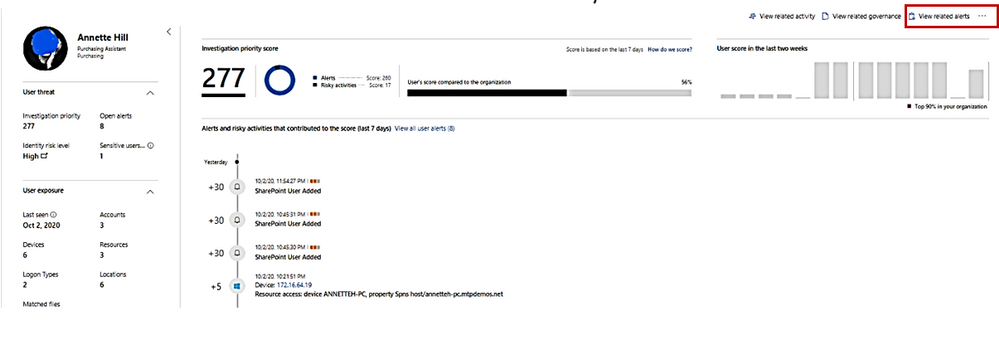
All Alerts related to the User.
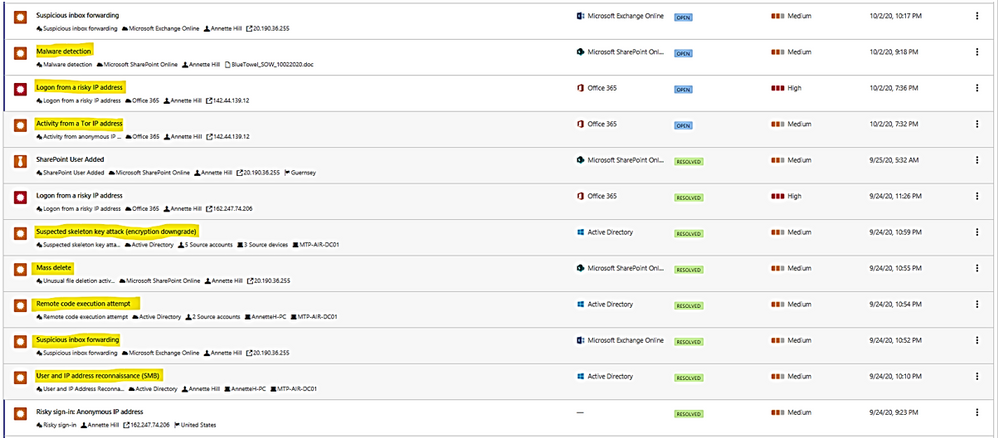
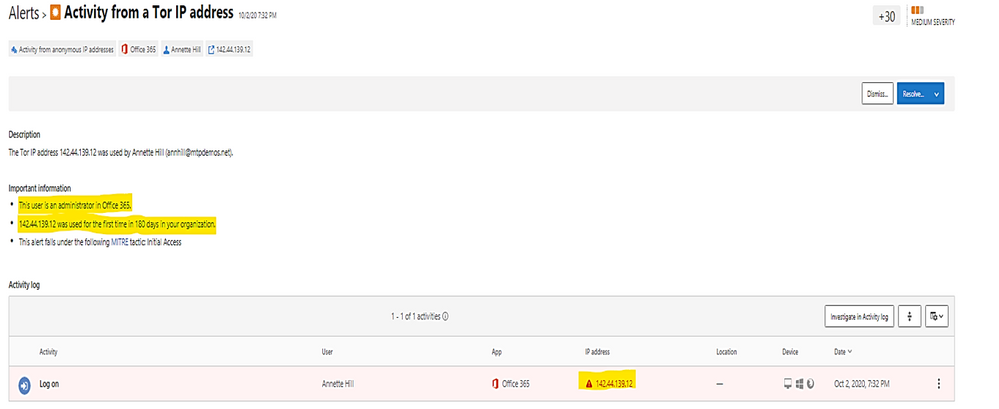
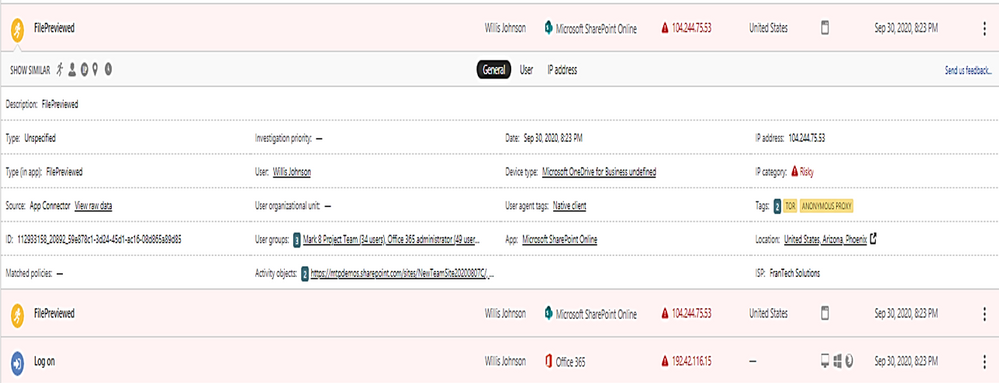
Example: alert on Tor IP address being used
(Tor directs Internet traffic through a free, worldwide, volunteer overlay network consisting of more than seven thousand relays to conceal a user’s location and usage from anyone conducting network surveillance or traffic analysis.)
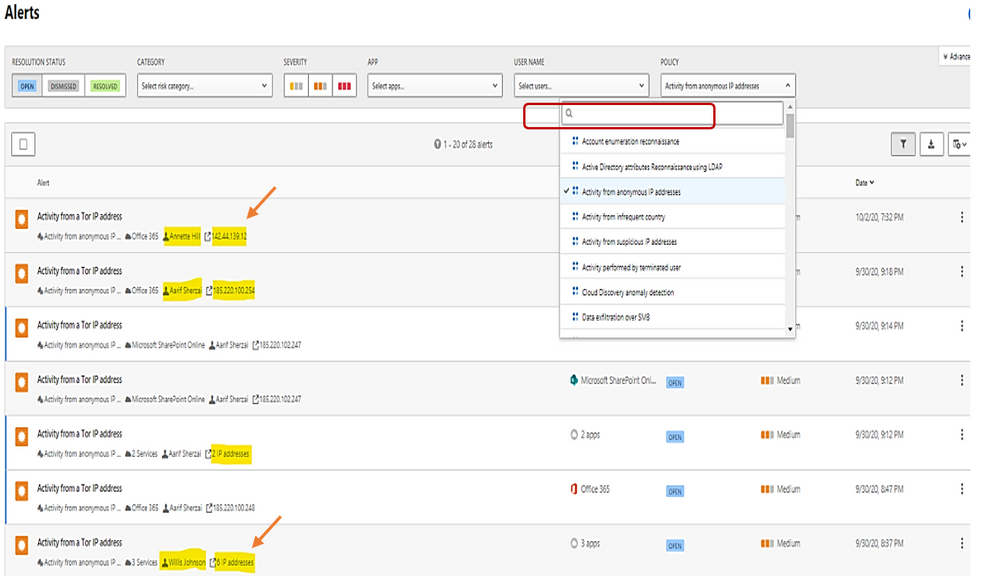
To get all Tor IP, anonymous IP address connection in Alert by using policy filter named “Activity from anonymous IP address.”
Click on each item to get the details.
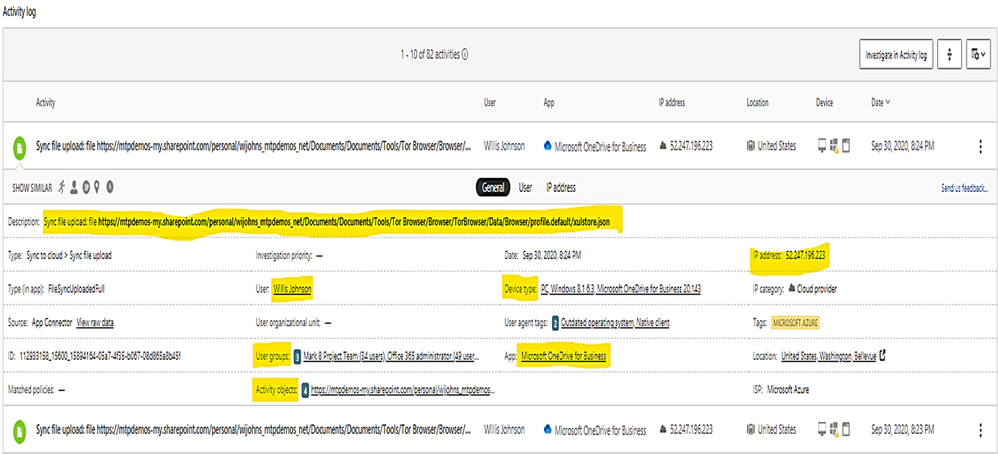
The details shown the answer to the following questions:
- What are the Tor IP addresses been used?
- Who is the User involved?
- What are the File names been uploaded downloaded to Tor IP address?

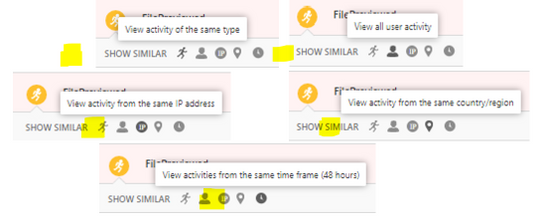
You could do more search by clicking on the following icons:
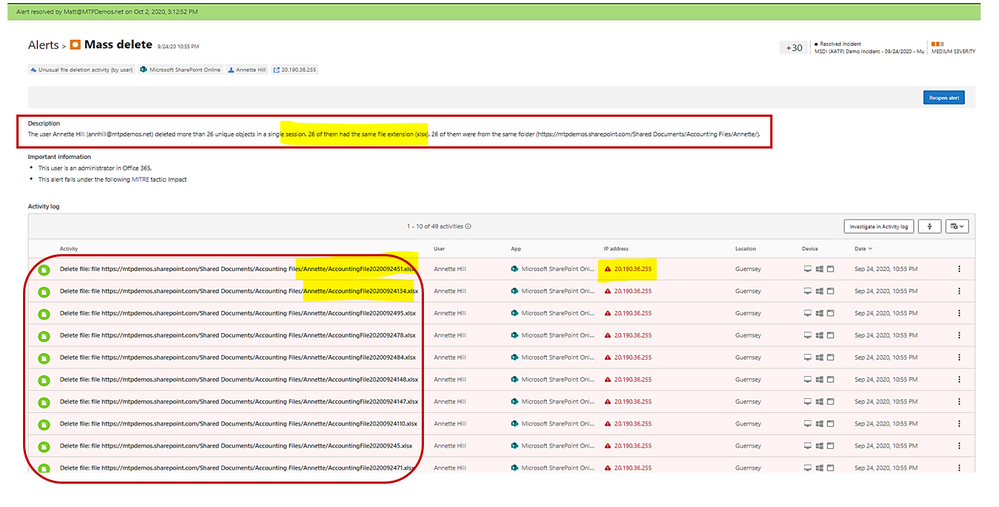
Example: alert on mass deletion of files:
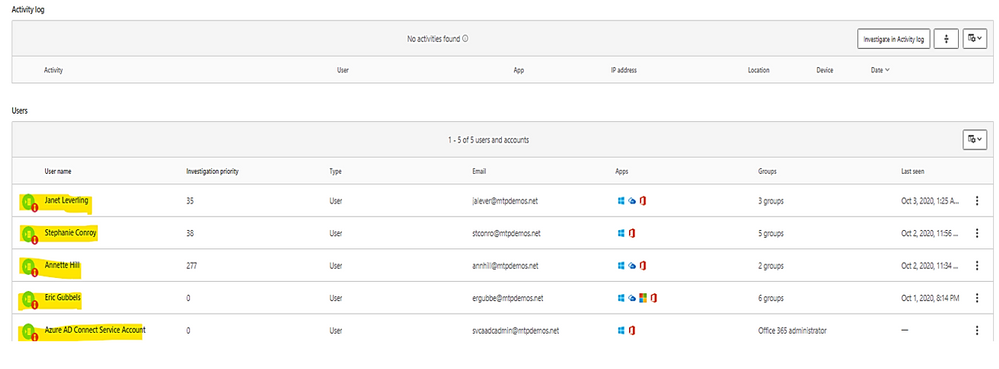
Example: alert on skeleton attack by downgrading encryption method on multiple admin accounts.
(the “Skeleton Key” attack is capable of “unlocking” and providing privileged access to every single employee account within the enterprise. The powerful malware strain allows cybercriminals to bypass Active Directory (AD) systems that only implement single factor authentication.)
In the alert page, the accounts marked with “red tie” icons are internal admin.

Microsoft Defender for Identity identity security posture:
- Identify misconfigurations and legacy components which represent one of the greatest threat risks to organization.
- Provide links to documents for remediation and preventive action.
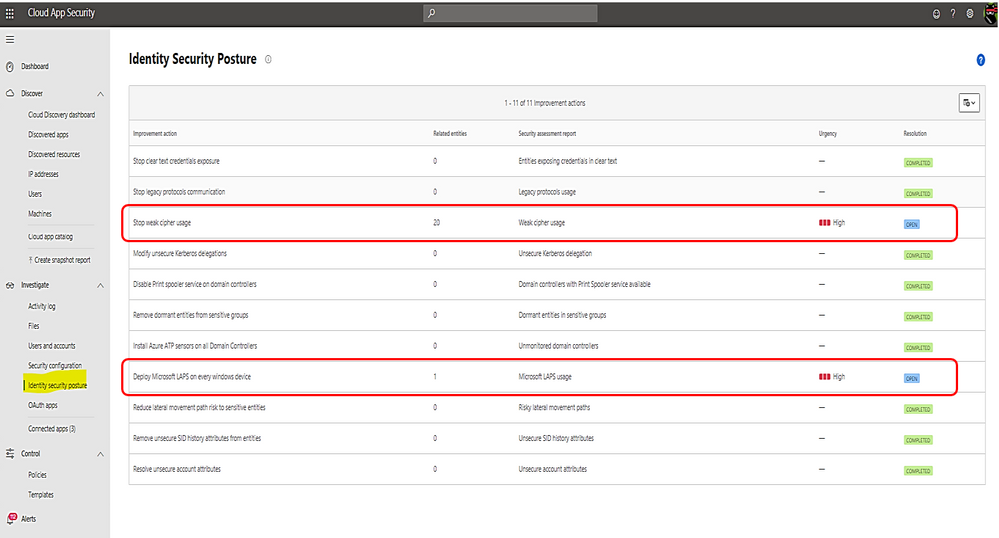
Identity security posture assessment of credentials exposed in clear text, legacy protocol usage, weak cipher usage, unsecure Kerberos delegation, DC with spooler service, sensitive group, rogue DCs, LAPS (Local Administrator Password Solution to be randomized and stored in AD) usage, risky lateral movement paths, unsecure SID history attributes, unsecure account attribute.
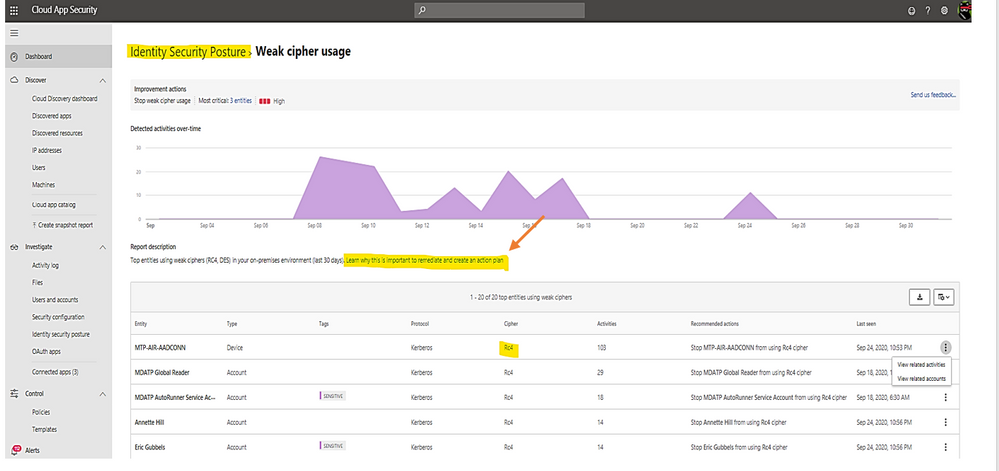
Click on any row item marked as “open” to view the posture detail and follow link to the remediated document.
Click on the link to view Microsoft document about the posture and remediation information and then, make a plan for remediation action.
Once you have the remediation solution implemented successfully, Microsoft Defender for Identity portal will automatically mark the related item as “completed” as shown:

Alerts in Microsoft Defender for Identity’s portal
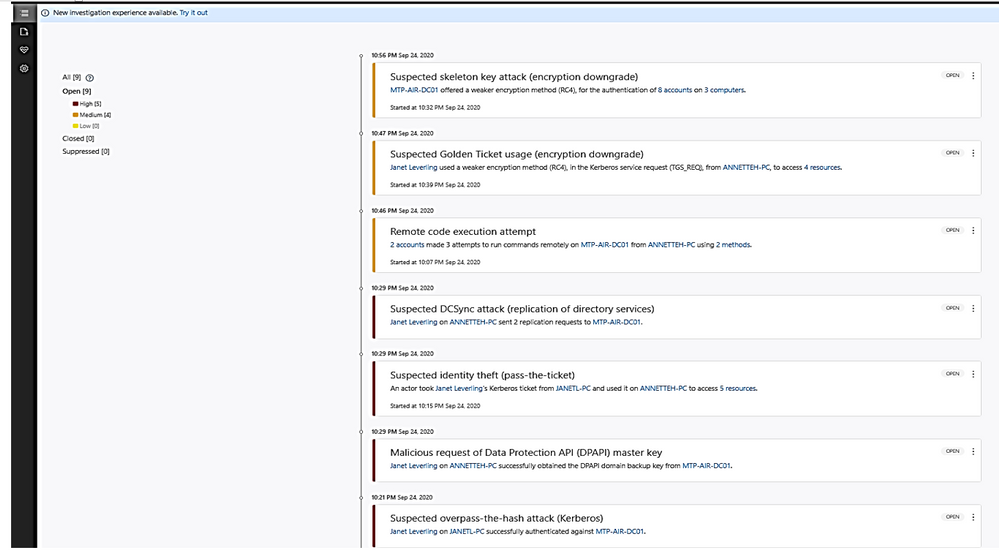
- Microsoft Defender for Identity security alerts explain the suspicious activities detected within your on-premises network by the sensors installed on domain controllers, and the actors and computers involved in each threat.
- Alert evidence lists contain direct links to users and computers.
- Microsoft Defender for Identity security alerts are divided into the following phases:
Click on the alert item to view detail and decide to close, suppress, exclude DC or delete alert.
- Suppress: Suppressing an activity means you want to ignore it for now, and only be alerted again if there is a new instance.
If there is a newly similar event after seven days, you will be alerted again.
- Reopen: You can reopen a closed or suppressed alert.
- Delete: Alert is deleted from the instance and you will NOT be able to restore it. After you click delete, you will be able to delete all security alerts of the same type.
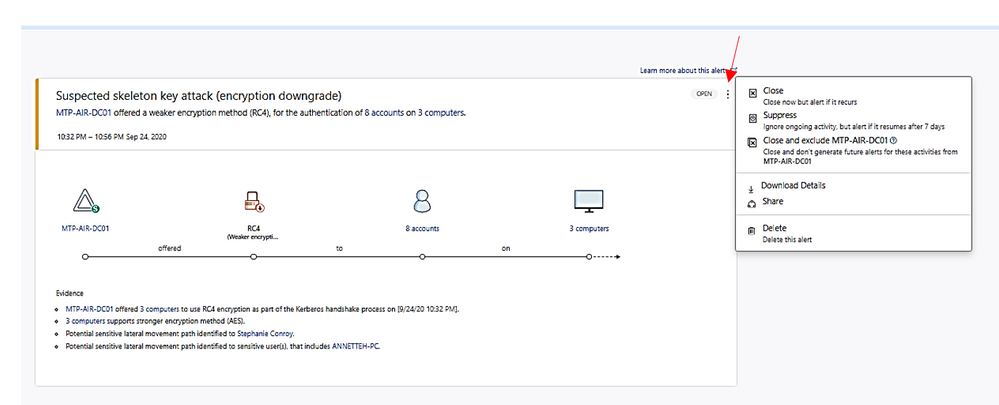
A closed alert could be reopened as shown:

I hope the information presented in this blog post is useful to your Microsoft Defender for Identity daily operation.
Reference:
AATP alert, Cloud App Security alert
End of mainstream support for Azure ATA
Verizon data breach report
– https://www.securelink.com/blog/81-hacking-related-breaches-leverage-compromised- credentials/
Video
https://www.bing.com/videos/search?q=azure+atp+security+posture+video&docid=608000595825135201&mid=6B5FFF76CDCD98F8963F6B5FFF76CDCD98F8963F&view=detail&FORM=VIRE
by Contributed | Oct 29, 2020 | Technology
This article is contributed. See the original author and article here.
Initial Update: Thursday, 29 October 2020 17:06 UTC
We are aware of issues within Application Insights as of 2020-10-29 16:45 UTC and are actively investigating. Application Insights customers ingesting telemetry in East US 2 may experience intermittent data latency, data gaps and incorrect alert activation.
- Work Around: NA
- Next Update: Before 10/29 19:30 UTC
We are working hard to resolve this issue and apologize for any inconvenience.
-Arish B


Recent Comments