by Contributed | Nov 24, 2020 | Technology
This article is contributed. See the original author and article here.
This post is co-authored with Dom Divakaruni and Sara Kandil
Today, we are announcing the availability of new asynchronous (batch) APIs for Text Analytics and Text Analytics for health, which enable developers to apply Natural Language Processing (NLP) to even more scenarios so they can identify key phrases, entities and even personally identifiable information (PII).
Asynchronous Analyze API for Text Analytics
Text Analytics is a generally available Azure Cognitive Service that lets you discover insights in text using Natural Language Processing (NLP). The service helps you identify key phrases and entities (people, place, organization, event, date among others), recognize text that contains personal information (PII) and analyze sentiment (positive, neutral, or negative).
To date, customers have been using Text Analytics by making synchronous calls to the service’s REST API, client library SDK, or by using containers to run Text Analytics in their own environment. Today, we are introducing a new preview Analyze operation for users to analyze larger documents asynchronously combining multiple Text Analytics features in one call. This gives customers the flexibility to analyze more information, at once, when their applications don’t need a synchronous response. The new asynchronous Analyze operation for Text Analytics supports individual documents of up to 125k characters, and up to 25 documents in a request.
The Analyze operation preview supports key phrase extraction, named entity recognition and PII recognition and is available in 5 Azure regions (West US 2, East US2, West Europe, North Europe, and Central US). Support for the rest of the Text Analytics capabilities and additional regions is coming soon.
Asynchronous Analyze API for Text Analytics for health
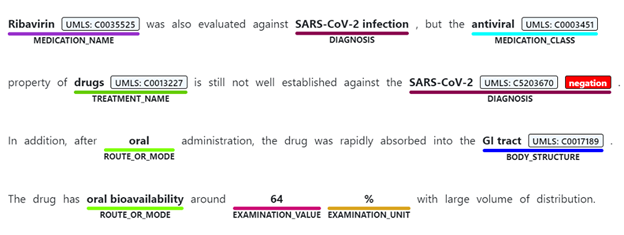
We are also introducing a new asynchronous hosted API for Text Analytics for health. As a refresher, early this year (July), we announced a preview of Text Analytics for health, a capability for the healthcare industry, trained to extract insights from medical data. With Text Analytics for health, users can:
- Detect words and phrases mentioned in unstructured text as entities that are associated with semantic types in the healthcare and biomedical domain – such as diagnosis, medication name, symptom/sign, and more.
- Link entities to medical ontologies and domain-specific coding systems (for example, the Unified Medical Language System), and extract meaningful connections between concepts mentioned in text (for example, finding the relationship between a medication name and the dosage associated with it.)
- Detect negation of the different entities mentioned in the text.
 Example of Text Analytics for health at work.
Previously, Text Analytics for health was only available for use via containers. This new API gives users the option to use the hosted service and avoid the heavy lifting of hosting containers unless they need to.
The hosted Text Analytics for health operation supports document sizes up to 5k characters and up to 10 documents in a single request. It is available for use in the West US 2, East US 2, Central US, North and West Europe regions.
In summary, Text Analytics is now more accessible with more ways to use the capabilities depending on your scenario. You can:
- Call the synchronous endpoints to use the Text Analytics features.
- Call the asynchronous Analyze API to process larger documents with multiple Text Analytics features in a single call.
- Call the hosted asynchronous Text Analytics for health API if your dataset that is being analyzed has clinical and biomedical documents.
- Use Text Analytics containers to host the endpoint in your own environments that meets your privacy and security requirements.
The new Text Analytics asynchronous APIs are available to use in Preview today. Please refer to our documentation to learn more and get started with these new APIs.
by Contributed | Nov 24, 2020 | Azure, Microsoft, Technology
This article is contributed. See the original author and article here.
Sometimes we’re used to recieve service request that our customers needs to know the time spent in order to connect to their Azure SQL Database or Managed Instance or simply to check intermittent connections that they could have in their environment.
For these types of situation I would like to suggest to review two PowerShell Script that you could find on this URL that allow to obtain this information.
Enjoy!
by Contributed | Nov 24, 2020 | Azure, Microsoft, Technology
This article is contributed. See the original author and article here.
The traditional method of installing SAP is using Software Provisioning Manager (SWPM using SAPInst). SWPM takes a long time to install the system. And, even after the installation, you have just a shell system, which still requires a technical and functional configuration before you can use it – this is a cumbersome process and based on your requirements, this configuration process may take days to weeks.
Generally, when you are in a pilot or proof of concept phase, where you want to evaluate a specific feature, you can’t wait weeks!
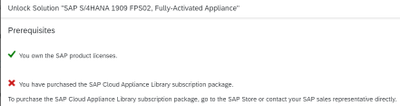
One of the quick and easiest method of deploying SAP is via SAP Cloud Appliance Library, which gives you trial license as well. To unlock the CAL solution, along with the SAP product licenses, you also need CAL subscription (as mentioned in the Figure1 below).

Figure1: Unlock solution using SAP CAL
Another option to get fully configured SAP S/4HANA system with sample data in hours, is using the S/4HANA Fully-Activated Appliance.
In this blog, you can explore how to install this fully activated SAP S/4H appliance in Azure. At the end of this blog, you will be able to successfully install the fully configured SAP S/4HANA 1909 SPS02 Fully Activated Appliance in Azure.
The overall process is very simple. You install the system which comes with pre-configured SID, and hostnames. Then you rename the SID, and hostnames to your desired nomenclature.
The process is divided into the following seven sections:
- What the end-results looks like?
- Infrastructure in Azure
- SAP Download
- Installation Process
- Register and rename the HANA system
- Rename the SAP system
- Post install activities
1. What the end-result looks like?
After the installation, you will have the following three clients pre-installed.

Following products will be Installed:

2. Infrastructure in Azure
Here are the VMs and storage configurations used for the VMs in Azure for this installation.
Jump box VM: used for software download, SAPGUI, SAPMMC, Putty etc.
- Name: jumpbox1
- Standard D4as_v4 (4 vcpus, 16 GiB memory)
- Windows Server 2016 Datacenter
- E drive with 128GB
SAP app and DB VM: VM to install SAP S/4HANA. Both Application and database layer are installed on the same VM
- Name: s4h1902f2vm1
- Standard E16ds_v4 (16 vcpus, 128 GiB memory)
- SLES 12 SPS4 for SAP
- SAP S/4HANA 1909 SPS2 Fully Activated Appliance
- Disk layout

3. SAP Download
You will need the following bits for installation. Download the installation bits from SAP marketplace https://launchpad.support.sap.com/#/softwarecenter. Use the SAP download managed to download these files. Download them to Jumpbox VMs. Based on download speed, it may take several hours to download them.
SAP S/4HANA 1909 FPS02 FA APPL INSTALLATION Bits

Software Provisioning Manager
Download SWPM 2 latest version from here: https://support.sap.com/en/tools/software-logistics-tools.html#section_622087154
SAP MMC
Search SAPMMC in download option
https://launchpad.support.sap.com/#/softwarecenter/search/sapmmc
SAPGUI

4. Installation Process
In this phase, we will install the SAP system from fully activated appliance, and then rename the SID and host name to our desired names. Please note, both sap application and database layers are installed on the same VM.
Current Name
|
Rename to (post install)
|
HANA DB SID: HDB
|
HANA DB SID: SG1
|
DB hostname: vhcalhdbdb
|
DB hostname: s4h1902f2vm1
|
DB Instance No: 02
|
DB Instance No: 02
|
SAP SID: S4H
|
SAP SID: SGH
|
CI hostname: vhcals4hci
|
CI hostname: s4h1902f2vm1
|
CS hostname: vhcals4hcs
|
CS hostname: s4h1902f2vm1
|
PAS instance No: 00
|
PAS instance No: 00
|
ASCS instance No: 01
|
ASCS instance No: 01
|
Please note, your VM name in Azure is s4h1902f2vm1.
Adjust /etc/hosts file
You will need to make the following entries in /etc/hosts for the installation. IP 10.x.x.8 is the private IP of the VM s4h1902f2vm1.
10.x.x.8 vhcalhdbdb.dummy.nodomain vhcalhdbdb vhcals4hci.dummy .nodomain vhcals4hci vhcals4dcs.dummy.nodomain vhcals4hcs
Copy and extract the SAP installation files.
Copy the 51054504_*.ZIP files from your jump box server (where you had downloaded them) to VM where SAP will be installed (i.e. s4h1902f2vm1). Copy them under the /sapmedia folder.
After copying the files, extract them on VM s4h1902f2vm1
#unzip 51054504_1.ZIP
#unzip 51054504_2.ZIP
#unzip 51054504_3.ZIP
#unzip 51054504_4.ZIP
It takes a while to extract these files.
Note: During this process, it may ask to overwrite label and version files, say Yes to overwrite them.
Once the extraction of zip files is completed, it will have a lot of *tgz* files. We will need to extract these tgz files now.
Let’s move all the tgz files to one location so we can easily extract them.
# /sapmnt/sapmedia/S4FullyActivatedApplianceBits/51054504_1_1/SAPS4HANA1909FPS02SAPHANADB20basedonSAPNetweaverASABAP754_1

Once all the tgz files are under the above folder, let’s extract those tgz files in below order
# cat dblog.tgz-* | tar -zpxvf – -C /
# cat dbexe.tgz-* | tar -zpxvf – -C /
# cat dbdata.tgz-* | tar -zpxvf – -C /
# cat usrsap.tgz-* | tar -zpxvf – -C /
# cat sapmnt.tgz-* | tar -zpxvf – -C /
You are done with the installation. You can get the passwords from the file /sapmnt/sapmedia/S4FullyActivatedApplianceBits/SAPS4HANA1909FPS02SAPHANADB20basedonSAPNetweaverASABAP754_4/SAP_Software_Appliance.xml.
5. Register and rename the HANA system
Register the newly created database, also rename the system to new SID and hostname.
#/hana/shared/HDB/hdblcm/hdblcm –action=register_rename_system
After the registration is completed, HANA instance should come up automatically. You can check the status from the following command
#/usr/sap/hostctrl/exe/sapcontrol -nr 02 -function GetProcessList
6. Rename the SAP system
Now, it’s a time to rename SAP system from S4H to SGH. Use SWPM to rename the SAP system.
#./sapinst SAPINST_USE_HOSTNAME=vhcals4hci SAPINST_ACCEPT_INTERNAL_SIGNATURE=true SAPINST_SLP_MODE=false

7. Post install activities
Now, your system is ready to use. Please adjust the following before you use the system:
- Check the RFC connection and change from vhcals* name to s4h1902f2vm1
- Update host name in tCode /UI2/FLP_SYS_CONF
- Apply License. You will need both SAP application and HANA licenses
- Adapt transport configuration
Conclusion
Fully activated appliance is an easy and quick way to install your SAP system with sample data. This is a great solution when you want to perform a rapid prototype. Hope you like the blog.
by Contributed | Nov 24, 2020 | Technology
This article is contributed. See the original author and article here.
This post will detail how to create enriched DDoS Protection alerts that will provide the information needed to triage and respond.
When Azure DDoS Protection Standard is enabled, the expectation is that any potential attack will be mitigated, and no additional response will be needed. However, like any security control, security teams often require visibility into the process of DDoS mitigation. For this reason, it is highly recommended that you enable diagnostic logging for Public IP Address resources to ensure valuable data is generated.
In the event of an ongoing attack, security teams have access to DDoS Mitigation flow logs, which record all traffic observed during a mitigation event, including whether it was allowed or dropped, the drop reason if applicable, and the source IP address. All this data allows teams to investigate the sources, tactics, and techniques of an attack, even if the actual mitigation is handled by Azure. In the event that support is needed during an attack, DDoS Protection Standard allows access to Rapid Response support.
Since many security teams are concerned with alert fatigue, false positives, and generally not wanting to have to waste time investigating low priority alerts, it is important for these alerts to be truly actionable. We have received requests from customers to allow the owners of the resources being attacked to help determine whether intervention is required by the security team.
An ARM template recently posted to the Azure network security GitHub repository was created for the purposes detailed above. The template will create all components necessary for a detailed DDoS Protection alert that gets sent to the resource owner in addition to the security team, and even performs a basic availability check against the resource under attack.
Azure Monitor Alert
The first stage in the process is to detect the DDoS attack, which is done here by an Azure Monitor alert rule. This can also be done using Azure Security Center or Azure Sentinel, and our plan is to create samples of the same logic described in this post for both Sentinel and Security Center (look for more upcoming blog posts).
The query defined in the alert rule uses the DDoSMitigationNotifications category in the AzureDiagnostics table, which is written to as part of the diagnostic settings of Public IP Addresses. This event is the first data written when a DDoS mitigation event starts, so it is the perfect event to use for an alert.
AzureDiagnostics

| where Category == "DDoSProtectionNotifications"

| where type_s == "MitigationStarted"

| project ResourceId, SubscriptionId, Message, publicIpAddress_s
By default, the rule runs every 5 minutes, but the template or alert can be edited if you have different requirements. Notice that the query projects 4 fields; those will be very important for the Logic App to use.
An action group is also created by the template and attached to the alert rule. The action group consists of only a webhook action, which is pre-populated by the webhook address of the Logic App trigger. If other actions are needed, such as direct email or SMS, those can be added later.
Logic App Alert Enrichment
The Logic App deployed by the ARM template is triggered by a webhook request, which is expected to pass Azure Monitor alert data using the default schema. The fields projected by the alert query will be passed to the Logic App for reuse.
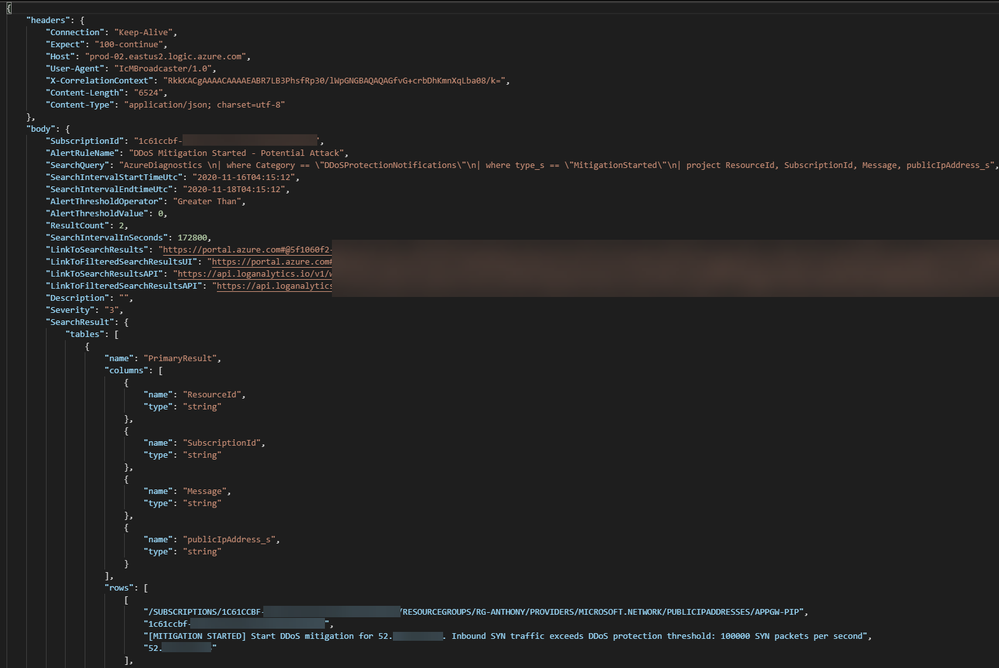
The raw JSON sent to the webhook looks like the following, with the projected query results contained in a row object at the bottom:

After receiving the webhook request, the first step of the Logic App is to query the Azure Resource Graph using fields parsed from the from the alert JSON. The basis of the query being run is one that can be found on our GitHub repo. The query will return more information about the resource behind the Public IP Address, which is information not readily available in the standard diagnostic logs or even Security Center. For example, a public IP address can be associated to Application Gateways, Load Balancers, VMs, or Network Virtual Appliances (NVAs).

In addition to the resource type and name, an important piece of metadata returned by the query is tag information. Specifically, the owner tag is parsed to determine who to email in the event of an attack against the IP address. If it is not standard policy to populate this tag in your environment, there are Azure Policies available to do this automatically. Alternatively, the Logic App can be edited to use some other tag to determine the recipient of the alert.
DDoS attacks commonly target web applications as the most visible and valuable assets, but other publicly facing resources can and do get attacked. The Logic App will initiate a test, a simple HTTP GET on port 80, against the IP address being attacked. This is of course making an assumption that there is a web application running behind the IP address and listening on port 80. This assumption is meant to provide extra information about the status of the asset under attack, which will be surfaced in the alert.

Based on both the query results and the results of the HTTP request, an email alert is finally sent to both the security team, as identified in the ARM template parameters, and the owner of the attacked resource.

In the example email, actionable information is provided about the resource being attacked, including the status of the HTTP test. In this case, the resource associated to the Public IP Address is an Application Gateway, and the availability test returned a 502 Bad Gateway, which can indicate that the backend resources are unavailable. If this is the case, both the resource owner and the security team can work together to respond with the help of Microsoft Support.
When deployed in your environment, the ARM template for enriched alerting will provide an excellent starting point for you to customize to the needs of your environment and response procedures.
by Contributed | Nov 24, 2020 | Technology
This article is contributed. See the original author and article here.
Update 2011 for the Technical Preview Branch of Microsoft Endpoint Configuration Manager has been released. In this release community hub content is grouped into a Microsoft, curated, or unreviewed category to allow admins to choose the types of content their environment displays. Admins can choose from the different categories of content that are provided in the Community hub to match their risk profile and their willingness to share and use content from those outside Microsoft and outside their own company.
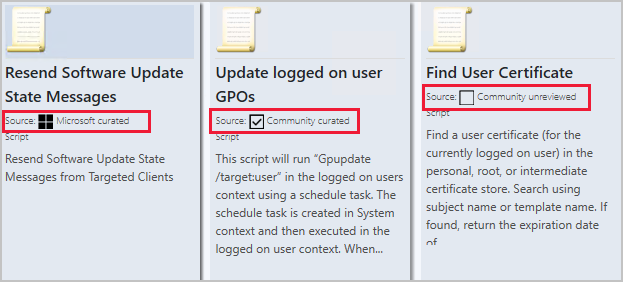
Community hub content has three categories for content sources:
- Microsoft curated: Content provided by Microsoft
- Community curated: Content provided by the community that gets reviewed by Microsoft
- Community unreviewed: General content from the community that doesn’t get reviewed by Microsoft
 Categorized content in Community hub
Admins can choose the types of content their environment displays from the following options:
- Display Microsoft content
- Display Microsoft and curated community content
- Display all content including unreviewed content
Learn more about Community hub content.
This preview release also includes:
Improvements to the product lifecycle dashboard – This release includes improvements to the product lifecycle dashboard to make it more actionable for you.
- Customize the timeframe on the charts for your preference.
- Search, sort, and filter the data.
- View a list of devices with products that are near or at end of support, and you need to update.
Windows 10 Servicing dashboard changes – We’ve simplified the Windows 10 Servicing dashboard to make it more relevant. The new Quality Update Versions chart displays the top five revisions of Windows 10 across your devices. The Latest Feature Update chart shows the number of devices that installed the latest feature update. The Windows 10 Usage chart, showing the distribution of Windows 10 major releases, was renamed to Feature Update Versions. Servicing plan and Windows 10 ring information were removed from the dashboard.
Software Center notifications display with logo – If you enable Software Center customizations, then notifications on Windows 10 devices display the logo that you configure in client settings. This change helps users to trust these notifications.
Approved scripts for Orchestration Groups – You can now select from scripts that have already been approved when configuring pre and post-scripts for an orchestration group. When in the Create
Orchestration Group Wizard, you’ll see a new page called Script Picker. Select your pre and post scripts from your list of scripts that are already approved. You can still add scripts manually on the pre and post-script pages. Additionally, you can also edit scripts that you pre-populated from the Script Picker.
Community hub on Windows Server operating systems – You can now display the Community hub on Windows Server operating systems.
Improvements to Support Center – Support Center already shows updates that are targeted to the device but not yet installed. Now in this release, select All Updates on the Content tab of Support Center to show all updates targeted to the device. To help you troubleshoot, this list includes information about whether the update is installed or missing. Also, on the Content tab, select Maintenance Windows to show the available maintenance windows for the device.
Improvements to OS deployment – This release includes the following improvements to OS deployment:
- Based on your UserVoice feedback, task sequence conditions now include a not like operator. This operator applies to task sequence variable conditions. It’s also used in the Set Dynamic Variable task sequence step.
- Based on your UserVoice feedback, this release fixes issues with the SMSTSDisableStatusRetry task sequence variable.
- Based on your UserVoice feedback, the Check Readiness task sequence step now also checks free space on disks without partitions.
- Based on your UserVoice feedback, the following PowerShell cmdlets now have an Index parameter:
- New-CMOperatingSystemImage: When you run this cmdlet with the new Index parameter, it creates a new single-index image file in the same source folder.
- New-CMOperatingSystemInstaller (alias New-CMOperatingSystemUpgradePackage:( When you run this cmdlet with the new Index parameter, it replaces the original image file in the source folder with a single-index image file.
- Based on your UserVoice feedback, the following new cmdlets are available to get the list of existing hardware IDs in the site database:
- Get-CMDuplicateHardwareIdGuid
- Get-CMDuplicateHardwareIdMacAddress
Update PowerShell help – You can now use the Update-Help cmdlet to get the latest information for the Configuration Manager PowerShell module. This content is the same as what’s published on docs.microsoft.com for the ConfigurationManager module.
Update 2011 for Technical Preview Branch is available in the Microsoft Endpoint Configuration Manager Technical Preview console. For new installations, the 2010 baseline version of Microsoft Endpoint Configuration Manager Technical Preview Branch is available on the Microsoft Evaluation Center. Technical Preview Branch releases give you an opportunity to try out new Configuration Manager features in a test environment before they are made generally available.
We would love to hear your thoughts about the latest Technical Preview! Send us Feedback about product issues directly from the console and use our UserVoice page for ideas about new features.
Thanks,
The Configuration Manager team
Configuration Manager Resources:
Documentation for Configuration Manager Technical Previews
Try the Configuration Manager Technical Preview Branch
Documentation for Configuration Manager
Microsoft Endpoint Manager announcement
Microsoft Endpoint Manager vision statement
Configuration Manager Forums
Configuration Manager Support

Recent Comments