
by Contributed | Dec 18, 2020 | Technology
This article is contributed. See the original author and article here.
This post was written by Office Apps & Services MVP Sarah Haase as a part of our Humans of IT guest blogger series. Sarah shares her journey as a female technology leader and provides ideas for mentoring and developing others.
Female technology leaders face unique challenges. We’re often outnumbered by our male counterparts and can face an uphill journey to prove ourselves. But we bring strengths to the tech workplace: communication and critical-thinking skills, diverse life perspectives, and distinctive ways of solving traditional technology challenges.
I remember the first day I walked into my company’s IT department to take on a SharePoint analyst role. I was the lone woman on a team of 30 technical men. I stood out, and not just because of my gender. I was a librarian working in IT. I had a different way of looking at challenges and talking in meetings and it showed. Within a couple of months, I was known as the “librarian with the impressive vocabulary.”
I’ve had the privilege of working with female technology leaders who bring an awareness of self and a strong team-building focus to their jobs every day. Have I seen these female tech leaders be judged or viewed differently than their male counterparts? Sometimes. Despite the many advances we’ve made, there’s still a paradox of cultural norms and gender stereotypes at play. Leaders are expected to be direct and decisive and make hard decisions based on business rationale. But gender stereotypes call for women to be kind, nurturing, and “nice.” How can female technology leaders be direct and decisive while also being nurturers?
In my roles as a Microsoft 365 adoption advocate, product manager, and leader, I need to balance the technology and people-centric needs of my team and customers. I’m a coach, subject matter expert (SME), strategist, people leader, security advocate, evangelist, and mentor.

Early in my career, I struggled to find my footing as a leader that lives out loud. Speaking up in meetings was tough, particularly when I was representing a minority opinion. Having authentic conversations with employees, peers, and executives was hard, and my authenticity sometimes made others uncomfortable. But discomfort can be a productive agent for change, and others’ comfort isn’t always my primary goal. I can be in tune with and aware of others’ feelings while also being a strong leader.
I’ve had amazing mentors, leaders, and co-workers that have offered advice, perspective, and the occasional reality check. Being able to give back and encourage the growth of others is one of my greatest joys. Whether you’re a female technology leader, an aspiring mentor, or an ally that wants to support the growth of others, you have valuable insights to share.
Here are some ideas to help yourself and others on their leadership journey:
Build mentor relationships. Seek out (or become) a mentor. One of the most powerful work relationships I’ve had was with a female mentor who was 15+ years ahead of me in her career. If you’re a male technologist, seek out a female mentor. Be inquisitive and ask questions about her experiences, background, and strengths.

Connect with interns. Volunteer to mentor high school and college interns. Have coffee with them, ask questions, and see how they view careers in technology. You’ll gain an amazing perspective.
Support and empower others. I’ve joined mentoring circles at several of the companies I’ve worked for, and they’ve provided an amazing opportunity to grow my network and broaden my perspective. Making time to connect with and listen to others’ experiences is incredibly rewarding…and the connections made can help with future career opportunities.
Build alliances & invest in advocates. If you’re focused on advancing your career and getting that next promotion, start forging relationships to help you along the way. Build alliances with other leaders that see your potential and achievements. These leaders can serve as advocates for your career growth.

Create a strong personal brand. Your brand is the impression you leave; it’s what your peers say about you when you’re out of earshot. Ask your leaders and co-workers how people describe you. If your brand doesn’t reflect who you want to be, take the opportunity to evolve.
Seek opportunities. Reach for that tough assignment. Lean into work opportunities that stretch you. Focus on creating value and don’t be afraid to share your wins with your peers and leaders.
Believe you can do it. Speak up. Raise your hand. Be heard! If you usually hold back in meetings, try leaning in and sharing your thoughts. If you suffer from imposter syndrome, script out positive messages for yourself and repeat the messages aloud several times a day.
Give (and seek) candid feedback. Have you ever received performance feedback that included comments on your strengths but gave you nothing to work on and improve? Many of us find it easy to give positive feedback but hard to give constructive feedback. Seek out peers who will tell you like it is…and give others the gift of authentic feedback.
Evaluate feedback. Feedback should be heard, considered, and evaluated. Listen with an open mind, ask questions, and reflect on the feedback you’ve received. Consider its merits and determine which pieces you’ll take to heart.
Call out poor behavior (and then let it go). Many female technologists (myself included) have received inappropriate feedback. We receive comments on our appearance instead of our performance and achievements. Or we’re told we’re too nice, too difficult, or too smart. If someone gives you this kind of feedback (or you see it occurring in the wild), call it out. And then dump the feedback in the trash. Don’t let poor behavior go unchecked, but don’t carry it with you.
I feel fortunate to be a part of this amazing technology community, and I love connecting with other female leaders at conferences and events. We have so much to learn from each other!
Sarah

by Contributed | Dec 18, 2020 | Technology
This article is contributed. See the original author and article here.
Apache Spark has been a long-time favorite tool amongst data engineers and data scientists; it is well known for handling large scale data processing and complex machine learning workloads.
Azure Synapse Analytics offers a fully managed and integrated Apache Spark experience. By leveraging Apache Spark in Azure Synapse, you can benefit from integrated security, fully managed provisioning, and tight-coupling to other Azure services, such as SQL databases (dedicated and serverless), Azure Key Vault , ADLS Gen2, and Azure Blob Storage as well as fast starting, high performance compute instances.
Deploying an Apache Spark pool from the Synapse Studio
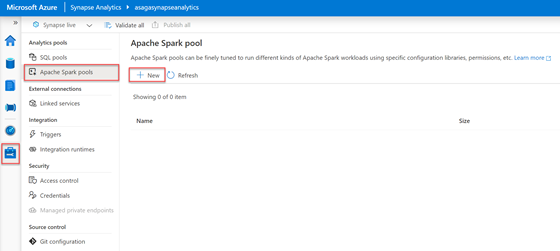
In the Synapse Studio, access the Manage Hub by selecting the briefcase icon in the left menu. In the blade menu, select Apache Spark pools from beneath the Analytics pools heading. In the toolbar of the Apache Spark pool screen, select the + New button.
In the Manage Hub, Apache Spark pools screen, the + New button is selected.
The Create Apache Spark pool blade will display on the right side of the screen. In this form, the only value you must enter is the Apache Spark pool name field. Enter your desired name and let the rest of the fields retain their default values. Select the Review + Create button, and after validation has succeeded, select Create.

The Create Apache Spark pool form is shown.
In a few moments, the newly created Apache Spark pool will display in the Apache Spark pool screen listing. Notice how fast and easy it was to get started using Apache Spark in Azure Synapse.

The new Apache Spark Pool is shown in the listing.
Learning Apache Spark using Knowledge Center samples
If you are new to Apache Spark, the Knowledge Center directly available in Azure Synapse contains fully functional samples that you can quickly deploy into your workspace to kickstart your learning process. To access the Knowledge Center, expand the ? menu located next to your user account information in the Synapse Studio header, and select the Knowledge center item.

The question mark menu is expanded in the header with the Knowledge center item selected.
In the Knowledge Center, select the Use samples immediately card.

In the Knowledge center screen, the Use samples immediately card is selected.
The Use samples immediately blade will display on the screen’s right. Select the Explore sample data with Spark item.

The Use samples immediately blade is shown with the Explore sample data with Spark item selected.
The Knowledge center will then deploy a notebook named Explore sample data with Spark in the Develop Hub, and if your permissions allow it, it will also create a new Apache Spark pool named SampleSpark.
After the sample’s deployment is complete, Synapse Studio will redirect you to the Develop Hub with the sample notebook open. A notebook is a collection of cells, some containing text (markdown) and others containing executable code. The sample notebook is not published (saved) by default. If you wish to keep the notebook, select the Publish all button in the Synapse Studio toolbar.

The Publish all button is shown in the toolbar.
The Explore sample data with Spark notebook will walk you loading, interpreting, aggregating, and visualizing NYC Yellow Taxi data obtained from Azure Open Datasets.
Let’s do a quick exploration of the toolbar of the notebook. The + Cell menu expands to provide the options of adding a code cell or text cell to the current notebook. The Run all button will execute all code cells in the order they appear in the notebook. The Publish button will save the current notebook in your workspace. The Attach to field lists the Spark pool options available in your environment. You can set this to either the Spark pool we created earlier or the SampleSpark pool created when the Knowledge center deployed the sample. The Language field indicates the primary/default language of the notebook. It’s important to note that you can mix and match languages in a single notebook using magic commands in a cell.

The Spark notebook toolbar is shown with each menu expanded.
Directly below the notebook toolbar is a secondary toolbar that displays the current state of the Spark session. The Spark session will start once a code cell in the notebook executes or the Run all button is selected. It takes a few minutes for the Spark session to be provisioned and started.

The Spark notebook Session toolbar is shown in a Not started state.
When the Spark session reaches the Ready state, you can hover over the status and view how much time you have left before the session expires. Every time code executes in the notebook, this timer resets. This timeout is a cost-saving measure to deprovision unused compute resources.

The Spark notebook Session toolbar is shown in a Ready state with the timeout tooltip showing.
On the Spark session toolbar’s right, you will find a Stop session button that immediately stops the current section and releases the associated Spark resources and a Configure session (gear) button that allows you to modify settings such as Session timeout.

The right hand side of the Spark Session toolbar is shown with the Stop Session and Configure Session buttons.

The Configure session blade is shown.
When you enter a code cell in the notebook, it becomes the active cell. A Run cell button appears in the margin space on the cell’s left-hand side. Selecting this button executes the code in the cell. Directly below the code, the Job execution details and output of the code displays.
Click on the sample notebook’s first code cell (labeled Cell 3) to enter the cell. The code in this cell imports the NYC Yellow Taxi dataset from Azure Open Datasets. It then retrieves all data between a start and end date from that dataset and loads it into a dataframe. Select the Run cell button in the left margin of the cell to execute the code. If the session has not already started this can take 2-3 min, however once its started the cell will execute in a few moments andthe output of the code displays beneath the cell. This cell does not have any printed output; however, you can expand the Job execution section in the output to see the details of the execution.

Cell 3 of the notebook is displayed with its associated output
The next code cell in the notebook (Cell 5) executes the printSchema command on the dataframe loaded with the data from the NYC Yellow Taxi dataset. Execute the cell’s code and observe the data’s schema/structure is printed in the output section.

Cell 5 of the notebook is displayed with its associated output
In Cell 6, the first line of code imports a SQL function library so you can execute queries against the dataframe. The next line of code performs an aggregation query against the original dataset and calculates the average trip distance and total trip distance grouped by the passenger count. A new dataframe gets created with the results of this query. The last line of code displays this new dataframe in the cell’s output, defaulting the view to display the data in a tabular format.

Cell 6 of the notebook is displayed with its associated output in tabular format.
In the output for Cell 6, toggle the View field to the Chart setting to see the resulting data in a chart format. The icon on the top right of the chart allows you to change the type of chart and its settings.

Cell 6 of the notebook is displayed with its associated output in chart format.
You are not limited to using the built-in charting functionality to visualize your data. You can import many popular data visualization libraries, including Matplotlib, Bokeh, and Seaborn. There is a long list of libraries automatically included with Apache Spark pools in Azure Synapse.
Alternatively, you can manage the libraries available to an Apache Spark pool by uploading a requirements.txt file in pip freeze format that lists the desired libraries along with the specific version information. All libraries must be available from the PyPi package index.
Moving along to Cell 8 in the sample notebook, you will find code that leverages the Matplotlib and Seaborn libraries to plot a line chart with the same aggregated data shown in Cell 6.

Cell 8 of the sample notebook is displayed with its associated output in chart format.
Creating a shared Apache Spark pool
Due to the deep integration of Azure Synapse Analytics services, we can easily share data between. We will create a Spark pool that can be shared not only with current and future Spark pools but with the serverless SQL pool engine as well.
Recall that in Cell 6 of the Explore sample data with Spark notebook, we’ve already created a dataframe (df_nyc) based on an aggregation query against the NYC Yellow Taxi data obtained from Azure Open Datasets. It would be great to share this data with the serverless SQL capabilities found in Azure Synapse. To implement this, add a new code cell to the current notebook, and add the following code to create a Spark database.
spark.sql(“CREATE DATABASE IF NOT EXISTS NycAggregates”)
Next, we’ll add our data into a table in this shared database. Append the following code to the same cell to write the contents of the df_nyc dataframe to a table in the NycAggregates database, then run the cell.
df_nyc.write.mode(“overwrite”).saveAsTable(“NycAggregates.PassengerCountAggregates”)

The code mentioned above is shown in a cell with its associated output.
From the left menu of Synapse Studio, select the Data Hub, which is identified by the cylinder icon. In the Data blade, expand the Databases section, and you will see the nycaggregates Spark database listed. Expand the database node as well as the Tables folder. There you will find the passengercountaggregates table. Next to this table, open the Actions menu, and select New SQL script, then Select TOP 100 rows.

The passengercountaggregates table actions menu is expanded with New SQL script and Select TOP 100 rows selected.
A new SQL script tab displays populated with a query to retrieve the data from the table we created from the df_nyc dataframe in the notebook. Note that the SQL script toolbar is pre-populated to connect to the Built-in serverless SQL pool, and the database selected is the one that we created in the notebook (nycaggregates). Select the Run button in the query tab toolbar to view the results of the query. Observe that similar to the notebook experience; you also can toggle the View from Table to a Chart visualization.

The query and the tabular result of the Select TOP 100 query on the passengercountaggregates is shown.
Clean up
Let’s take a moment now to remove the items created during this tutorial. Add a new code cell to the Explore sample data with Spark notebook, add the following code, and run the cell to delete the Spark table and database that we created.
spark.sql(“DROP TABLE IF EXISTS NycAggregates.PassengerCountAggregates”)
spark.sql(“DROP DATABASE IF EXISTS NycAggregates”)
Access the Data Hub (cylinder icon) from the left menu, and in the Data blade, expand the Databases section. Open the Actions menu next to the nycaggregates database and select Delete.

The Actions menu next to the nycaggregates database is expanded with Delete selected.
To delete the notebook, select the Develop Hub (paper icon) from the left menu, and in the Develop blade, expand the Notebooks section. Open the Actions menu next to the Explore sample data with Spark notebook and select Delete.

The Actions menu next to the sample notebook is expanded with Delete selected.
Next, select the Manage Hub (briefcase icon) from the left menu of Synapse Studio. Then in the blade menu, select Apache Spark pools. In the Apache Spark pool listing, hover over the row for the SampleSpark item, then expand the ellipsis (…) menu and select Delete.

The ellipsis menu is expanded on a Spark pool with the Delete item selected.
Repeat the same steps for the Spark pool you created in the first exercise.
Conclusion
In this post, we explored some of the capabilities of Apache Spark in Azure Synapse. We created an Apache Spark pool from the Synapse Studio and deployed a ready-to-use sample notebook from the Knowledge Center that leveraged taxi data from Azure Open Datasets. We walked through each of the code cells in the notebook and learned how to read data, perform queries, and investigate some data visualization options. We then created a shared Spark pool and table populated with our dataframe’s data and queried it using a serverless SQL pool.
Try out this tutorial today by creating an Azure Synapse workspace with a dedicated SQL pool.
– Euan Garden, Principal Program Manager, Azure Synapse

.png")

Recent Comments