by Priyesh Wagh | Dec 16, 2020 | Dynamics 365, Microsoft, Technology
Although, you can use Text based controls to represent data as is in a Canvas Power App. So why not go an extra mile to make it look more intuitive.
Scenario
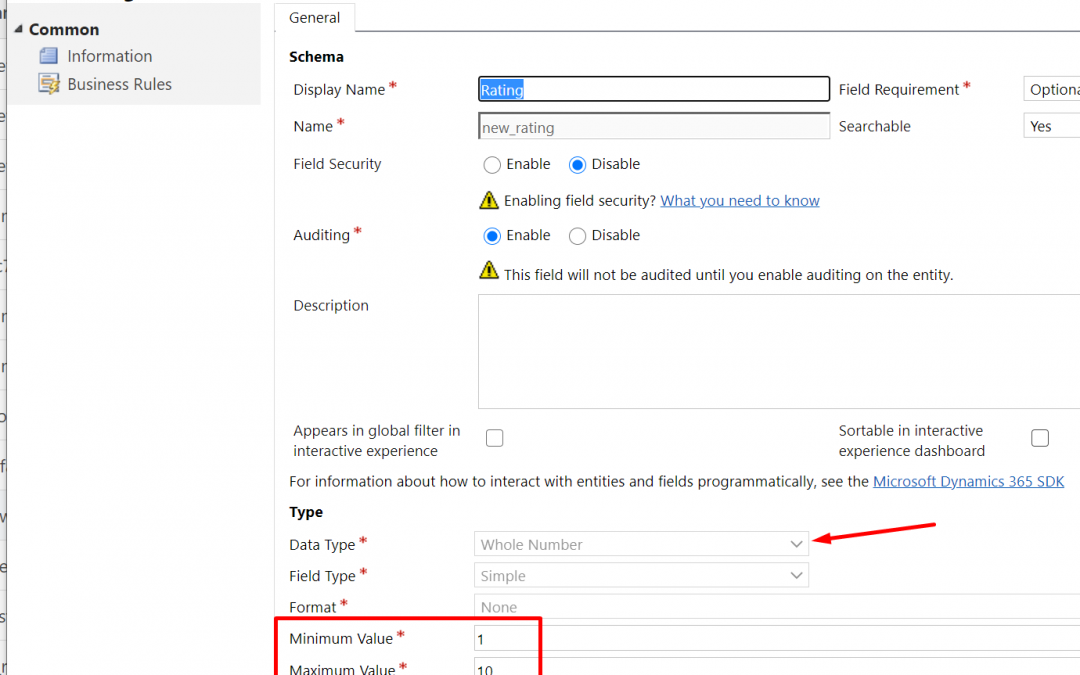
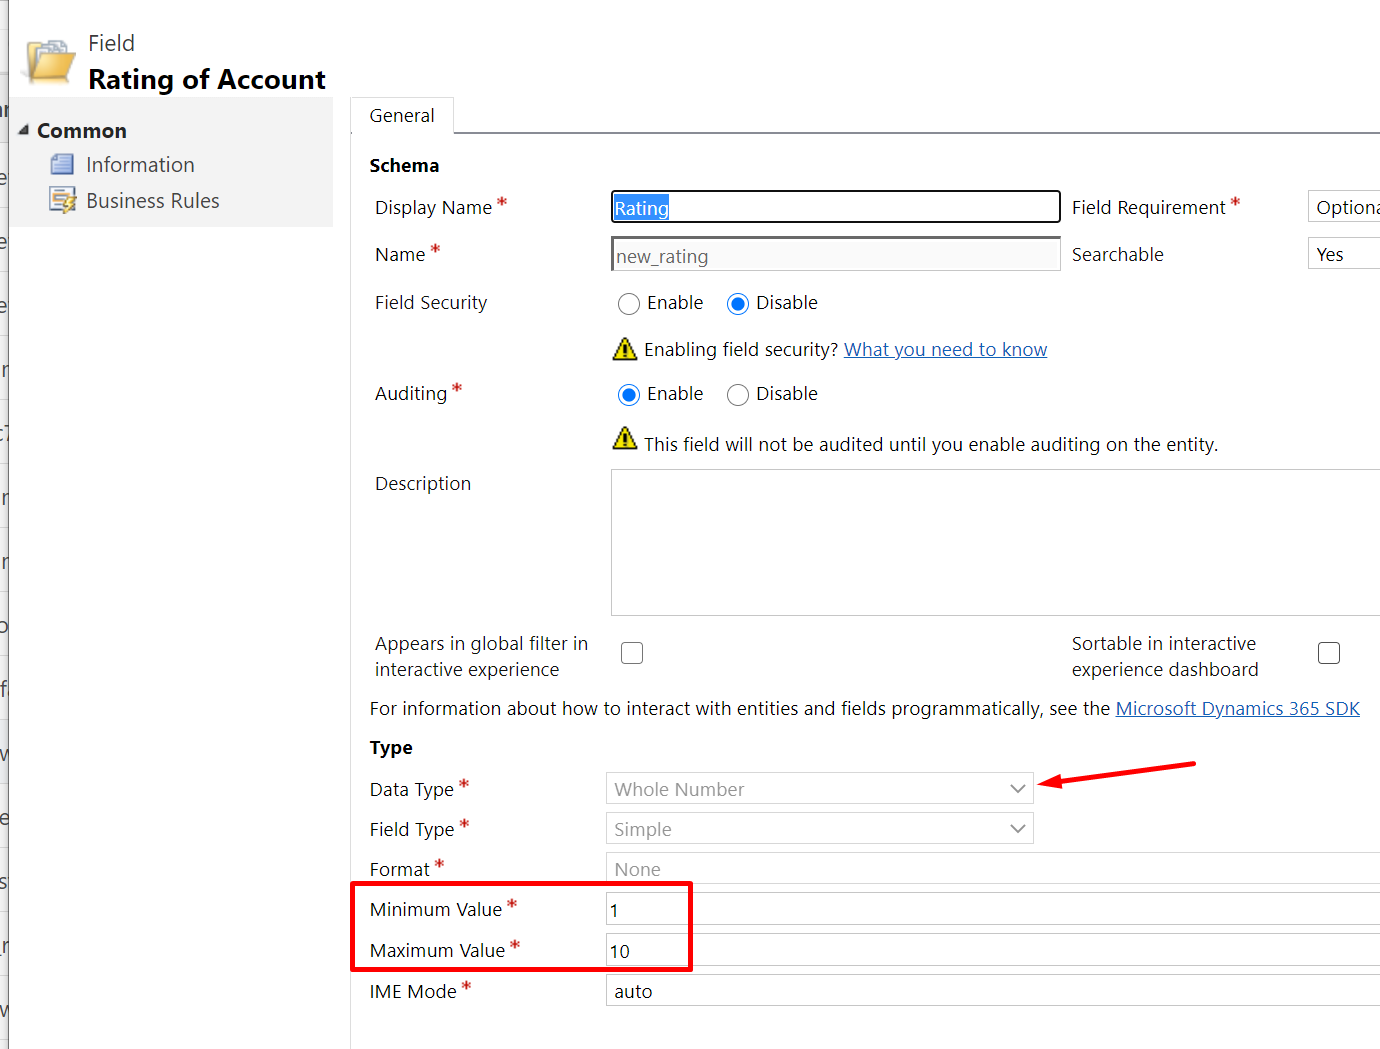
Let’s say there are Accounts and you have some kind of Compliance Ratings on them to represent compliant they are based on certain criteria. Could be a Numeric value or Decimal value. But Rating Control represents only in Numeric i.e. Whole Numbers.
So, for this example, I’m using a Rating field which is of type Whole Number in Dynamics 365 on Account entity.
And the complete Dataset looks like this in Dynamics 365 / Dataverse.
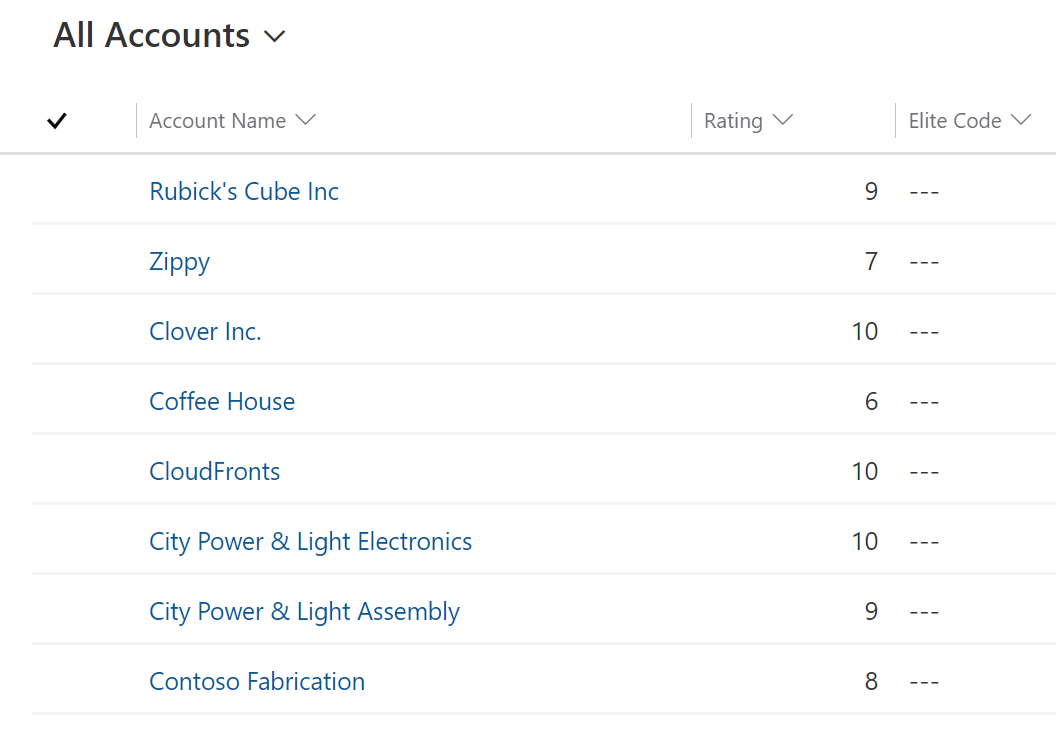
Note: I tried with Decimal but it rounded the values hence, sticking to Whole Number.
Rating Control
- Let’s say below is the Gallery and you want to show Ratings in the form of stars instead of traditional numeric values.
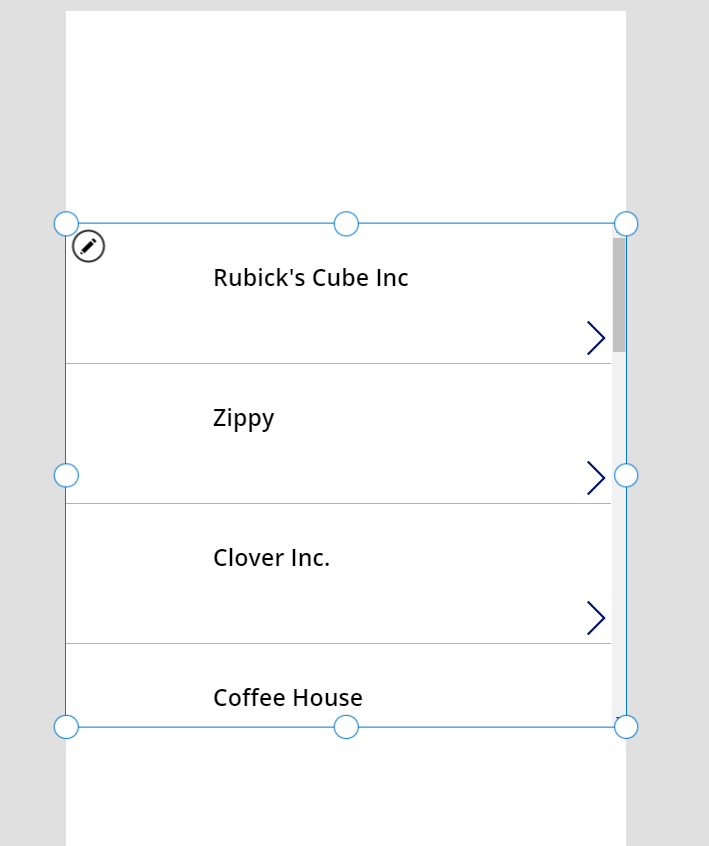
- Now, let’s use Rating Control below the Names of the Accounts to show the Rating values. Select the first Row once you connect to the Common Data Service i.e. CDS / Dataverse Data Source and select the entity you want to populate it with. In this example, we are using Accounts. So my Gallery is populated with Accounts records.
Select the first record and navigate to Insert tab and look for Input controls as shown below
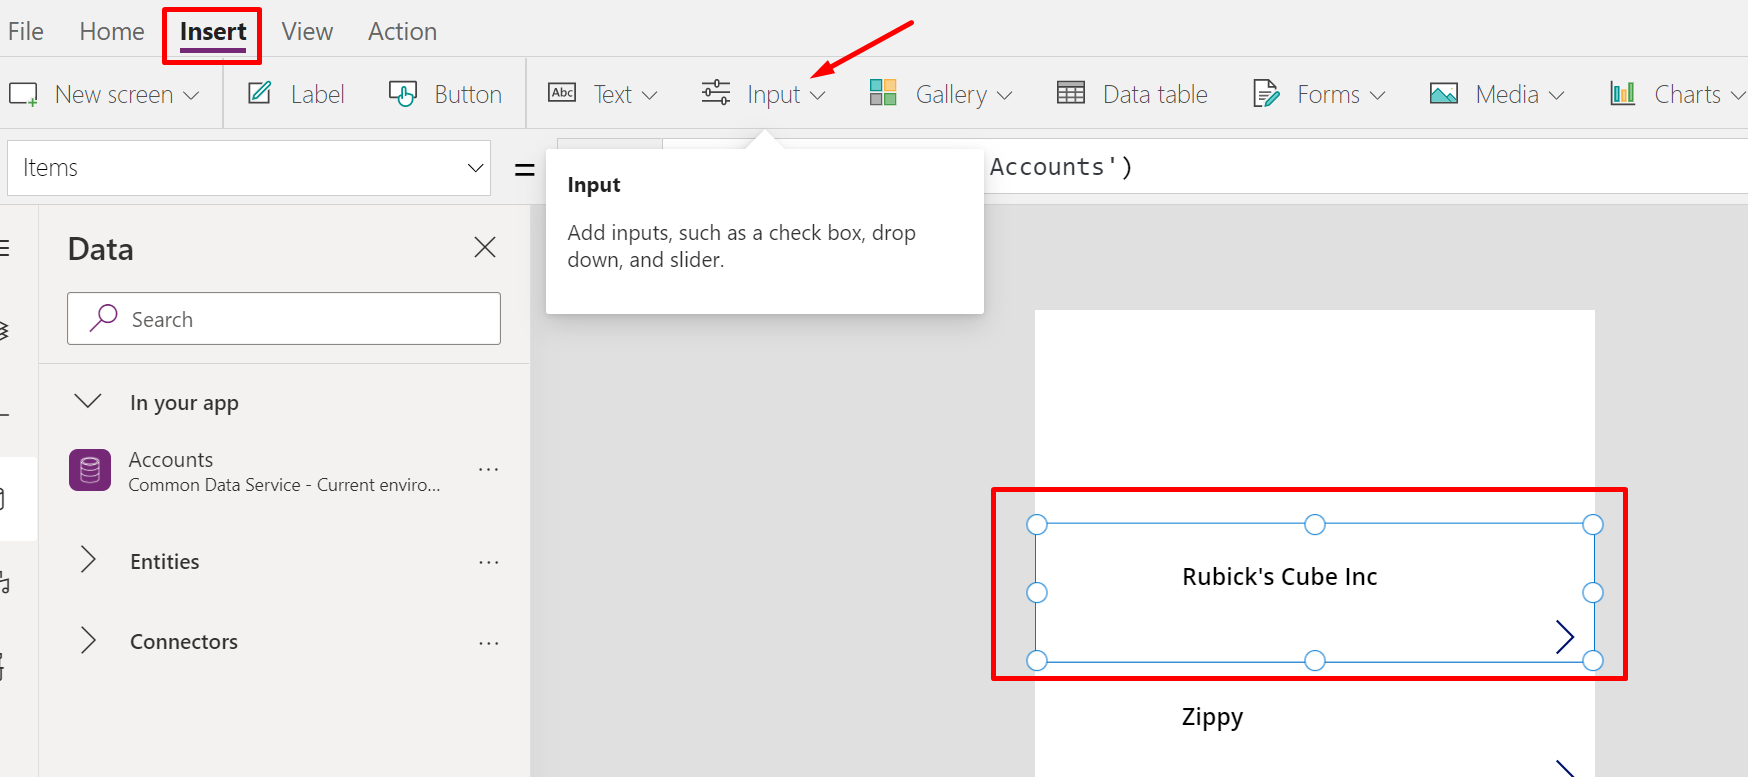
Now, look for Rating control.
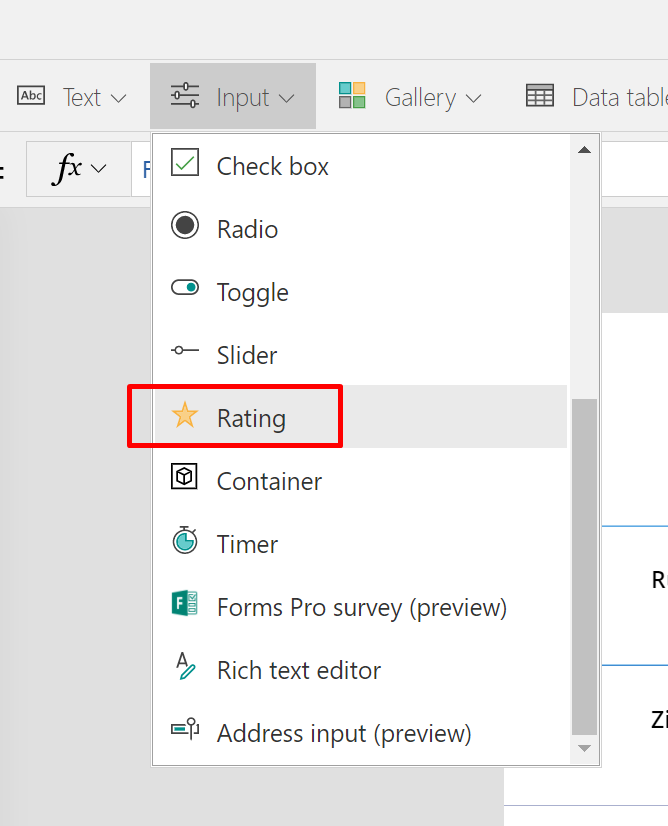
- Once you select Rating, it’ll appear iteratively since it’ll be applied “For Each” of these records in your Gallery control.
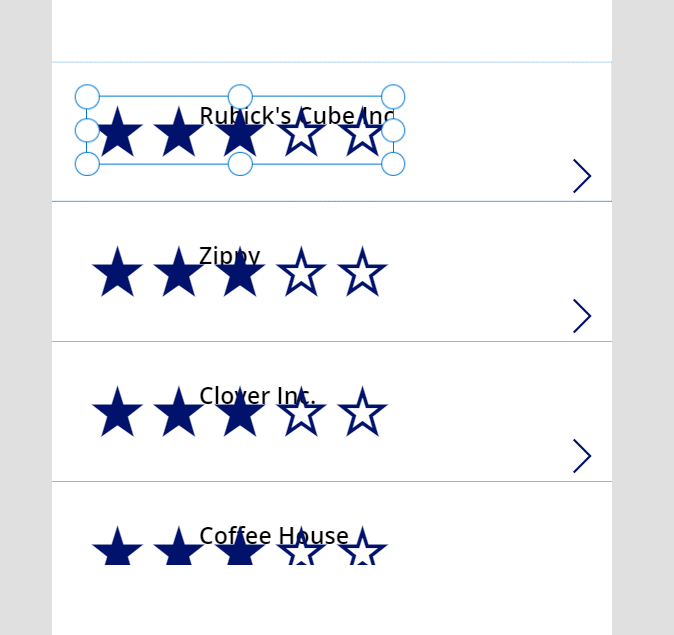
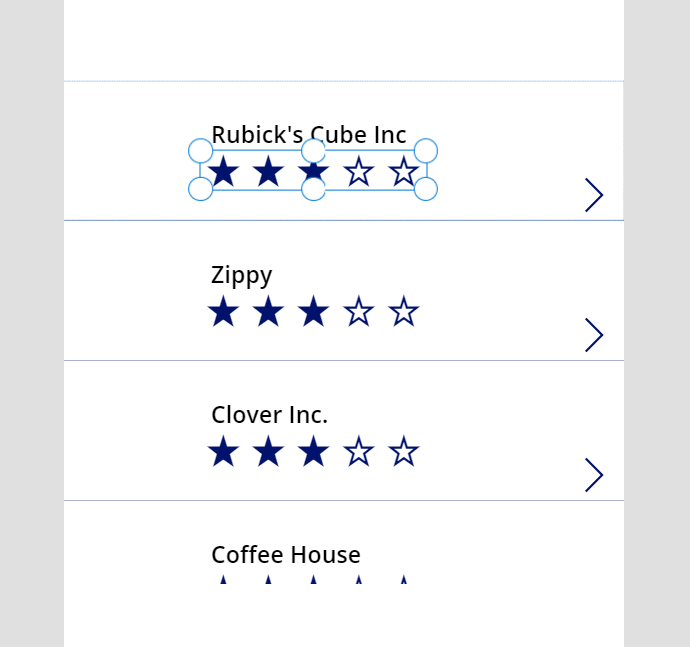
- I’ve just rearranged them under the name to make them look proper.
- Let’s make it Read Only by changing the behavior, so that the Users don’t accidently touch and set a value during Runtime. Although, this won’t affect the actual data but the representation will be incorrect in that case.
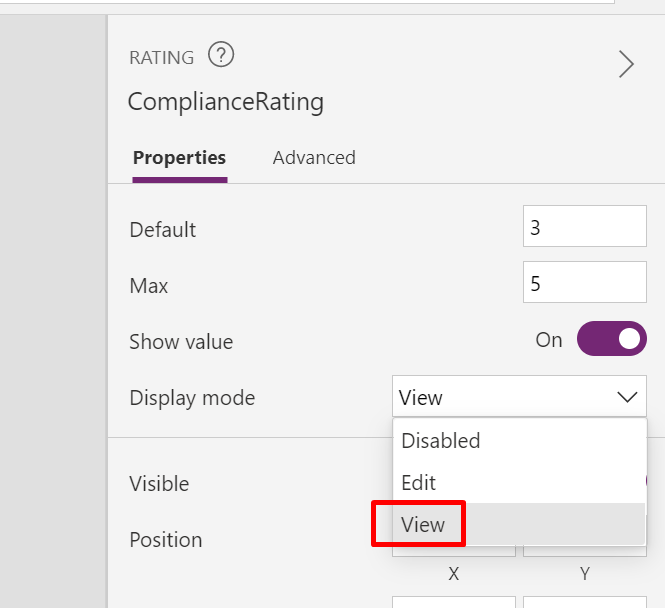
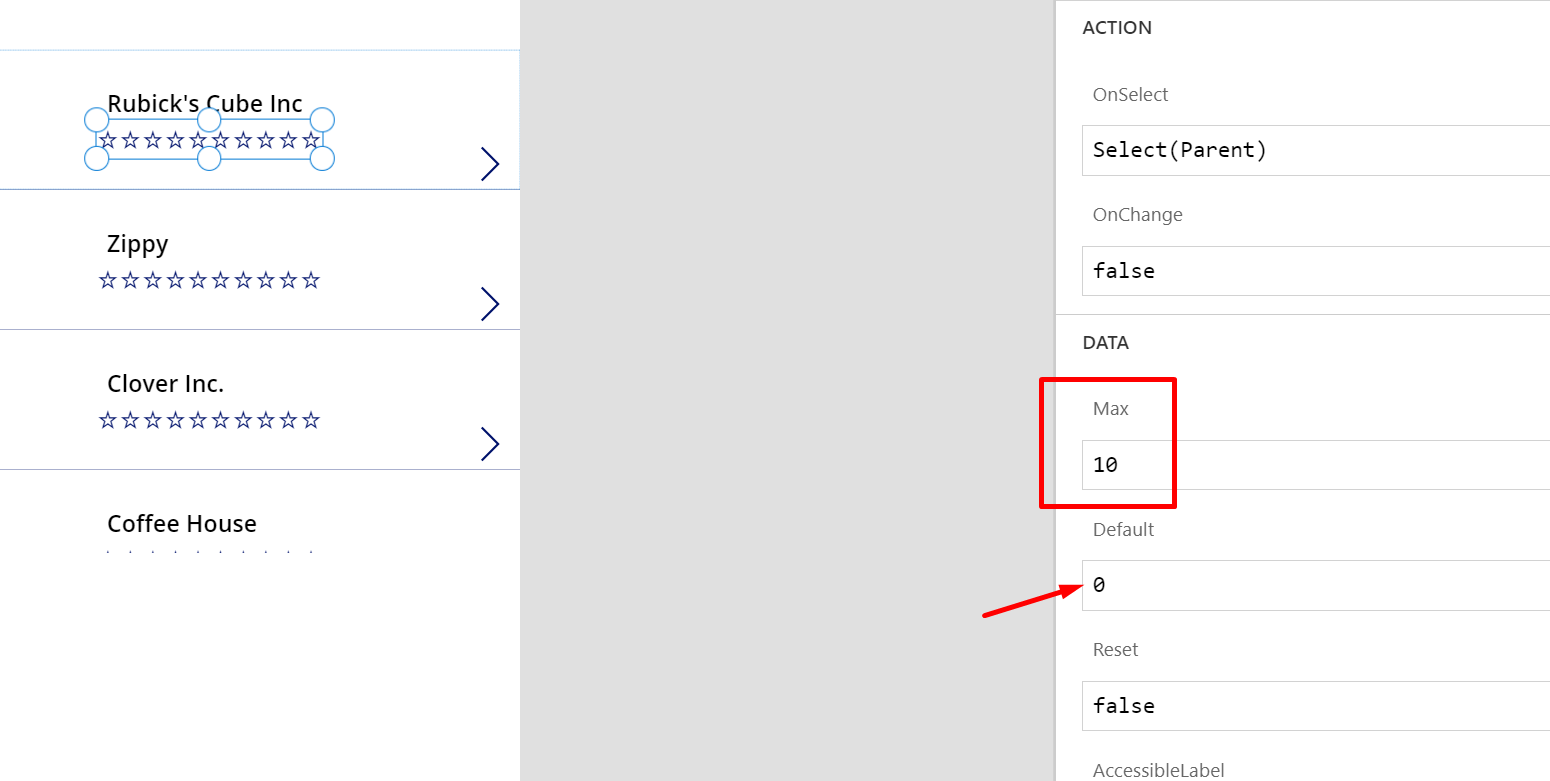
- Also, the Max will represent the length of your Rating whereas the Default value are kept to 0 in case the field value is not set at Source. (I think 1 would still be misrepresenting)
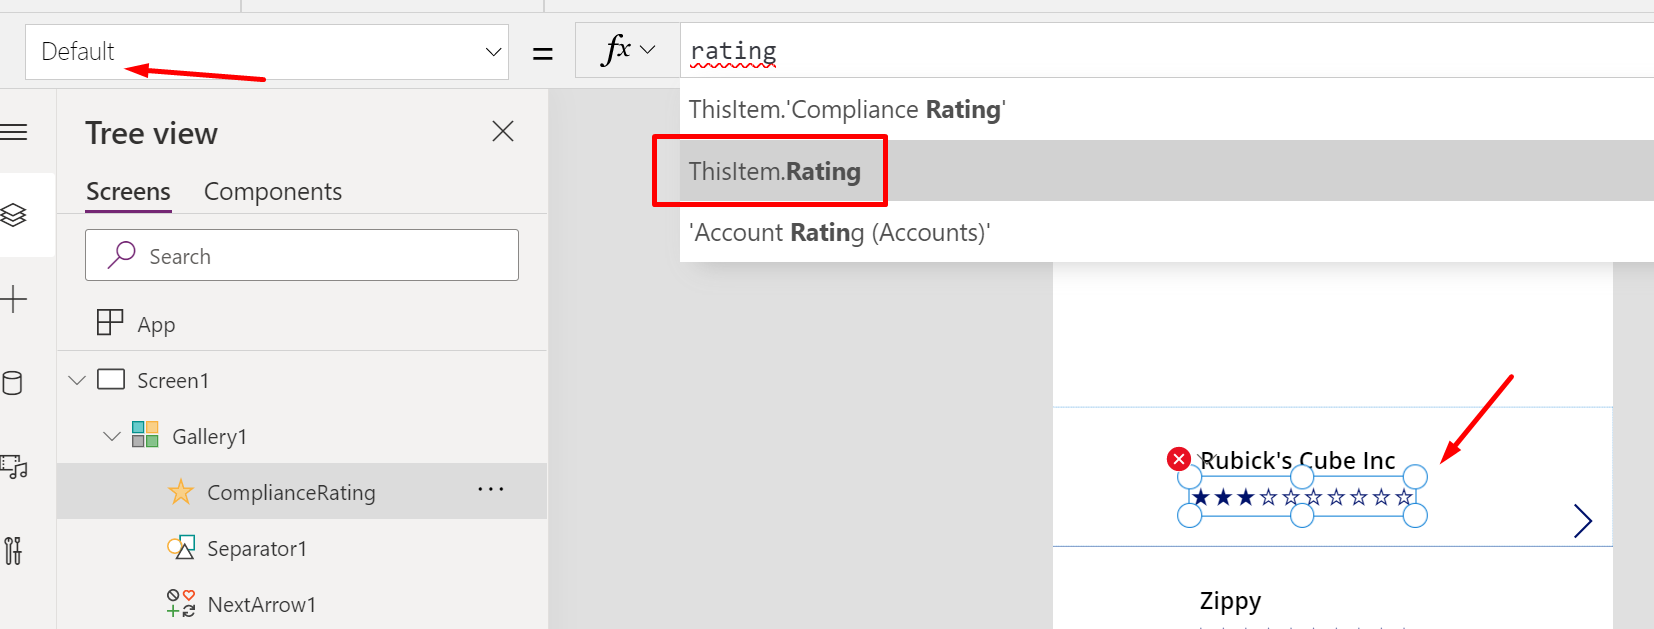
- Now, I’ll connect this Control to the Data Source’s field i.e. Rating field on the Account entity that represents the Rating value.
On the Default, I’m setting ThisItem.Rating where ThisItem represents the Row of the Account i.e. the Account record itself and Rating is the field in Dynamics 365’s Account entity which we saw in the scenario above.
- And that’s it. You can Save and Publish your App and Run it.
Rating values
Now that we’ve added the Rating Control, let’s Run our App and see how it represents the data from your Accounts entity.
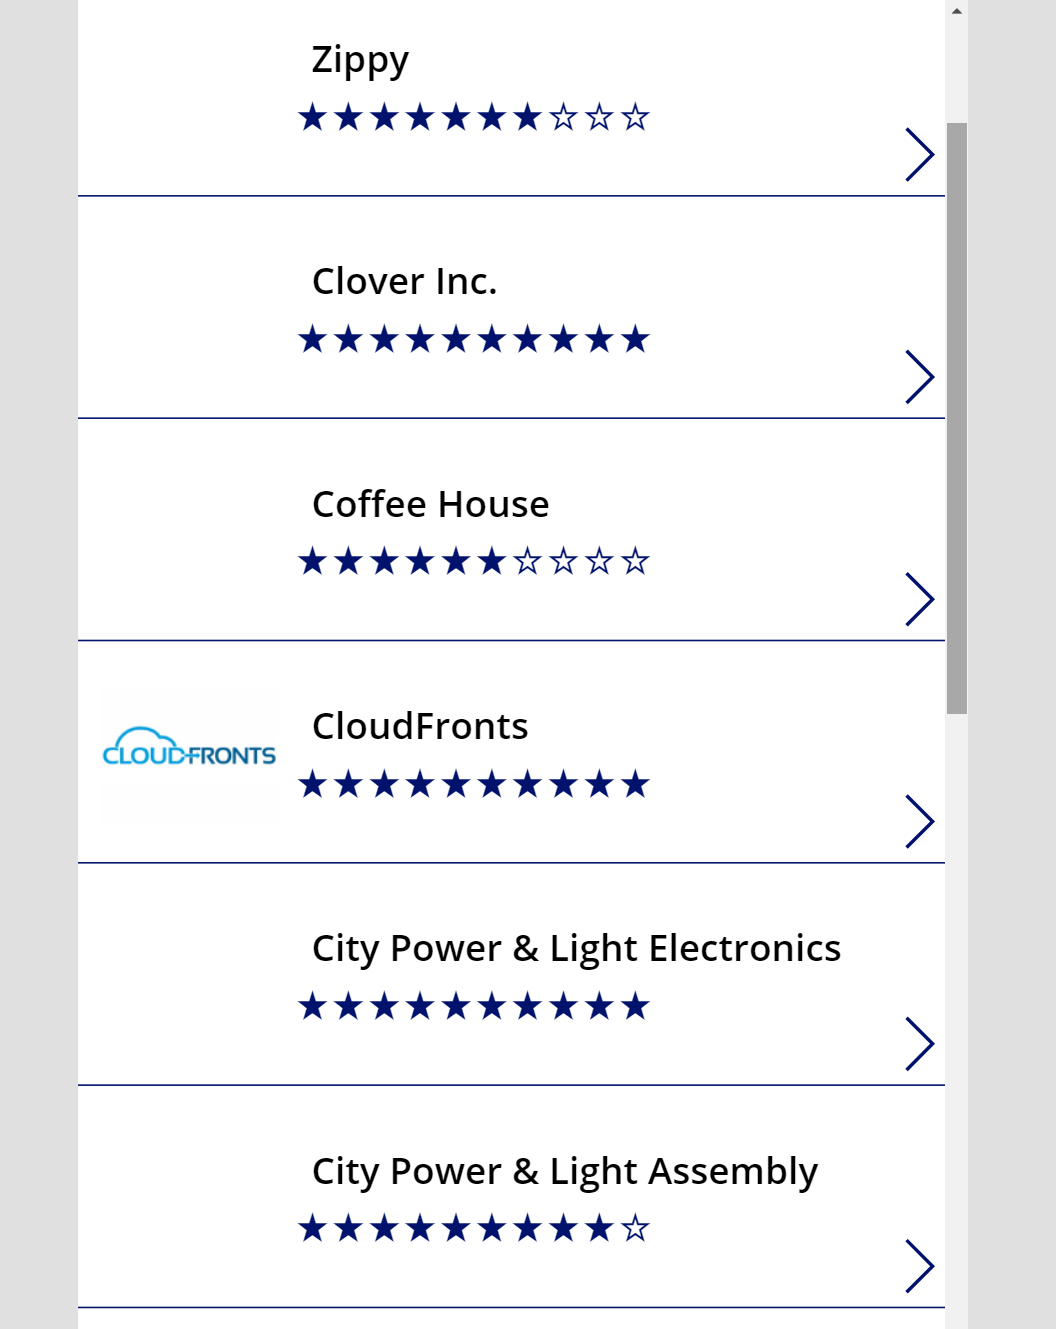
And the Ratings represent the below data –

Hope this was useful!
Here are some more Canvas Power Apps posts you might want to check –
- Clear a field value & Reset Form in a Canvas Power App [Quick Tip]
- Get Dynamics 365 field metadata in a Canvas App using DataSourceInfo function | Common Data Service
- Debug Published Canvas Power App with other users using Monitor | Power Platform
- Download a File from a Canvas Power App using a button | Power Platform
- AddColumns() function to dynamically add columns to a Data table in Canvas Power App | SharePoint List
- Implement real-time search in Gallery of CDS records in a Canvas Power App | Power Platform
- Implement character length validation in a Canvas Power App | Power Platform
- Log Canvas Power App telemetry data in Azure Application Insights | Power Apps
- Call HTTP Request from a Canvas Power App using Flow and get back Response | Power Automate
- Send a Power App Push Notification using Flow to open a record in Canvas App | Power Automate
- Dependent OptionSets in a Canvas Power App for 1:N related CDS entities | Power Platform
- Restore older version of a Canvas Power App | Power Platform
Thank you!!
Brought to you by Dr. Ware, Microsoft Office 365 Silver Partner, Charleston SC.
by Scott Muniz | Dec 16, 2020 | Security
This article was originally posted by the FTC. See the original article here.
You’ve finished your online shopping, your gifts have shipped and you’re waiting for them to arrive – but some Grinch decides to ruin your holiday. On this 9th day of Consumer Protection, we’re talking about how to stop porch pirates in their tracks.
Every year millions of people have packages stolen right from their doorsteps. So what’s the best way to stop them?
-
Require a signature. When your shopping cart is full and it’s time to choose your shipping details, take a moment to check “signature required.” A contact-free way to sign may be available through major package delivery services. You can request delivery confirmations, too.
-
Give specific delivery instructions. Many shippers will let you specify where to leave packages — maybe in your back yard, or even redirecting them to a trusted neighbor’s address, if you won’t be home.
-
Install motion activated lights. Outdoor lights with a motion sensor might make your home a lot less attractive to would-be thieves, making them much more visible than they’d likely want to be.
Brought to you by Dr. Ware, Microsoft Office 365 Silver Partner, Charleston SC.

by Contributed | Dec 16, 2020 | Microsoft Teams, Office 365
This article is contributed. See the original author and article here.
The new Starbucks app makes it easy to treat your colleagues to coffee by sending a Starbucks eGift within Microsoft Teams this holiday season and beyond, plus new backgrounds from Starbucks to add holiday cheer to your meetings.
The post The Starbucks app in Microsoft Teams—a new way to show appreciation for your colleagues this holiday season and beyond appeared first on Microsoft 365 Blog.
Brought to you by Dr. Ware, Microsoft Office 365 Silver Partner, Charleston SC.
by Contributed | Dec 16, 2020 | Technology
This article is contributed. See the original author and article here.
This post was authored by Bruce Nelson, Senior Solutions Architect at Databricks and Clinton Ford, Staff Partner Marketing Manager at Databricks
Overview
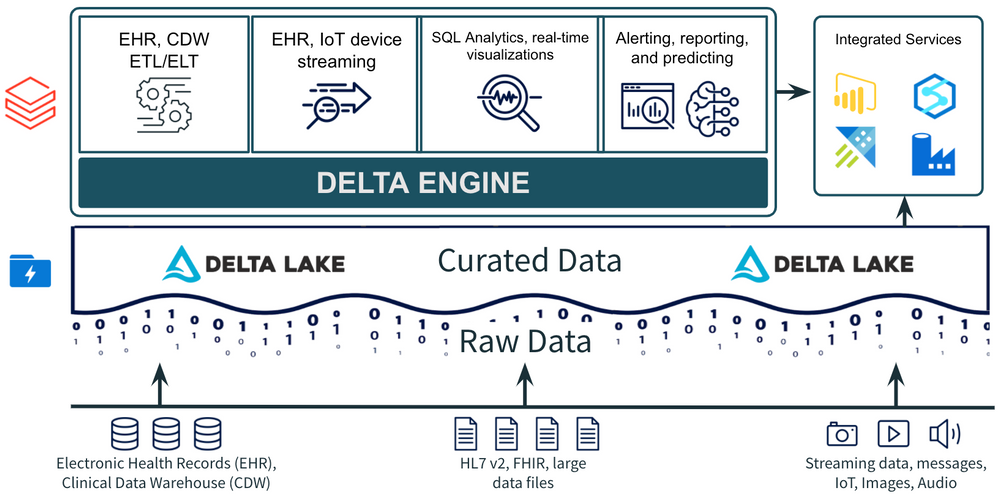
Healthcare organizations are improving the patient experience and delivering better health outcomes with analytic dashboards and machine learning models on top of existing electronic health records (EHR), digital medical images and streaming data from medical devices and wearables. Azure Databricks and Delta Lake make it easier to work with large clinical datasets to identify top patient conditions.
Using Delta Lake to build a comorbidity dashboard
Simulated EHR data are based on roughly 10,000 patients in Massachusetts and generated using the Synthea simulator. Our ETL notebook ingests and de-identifies our data, then prepares it for our visualization notebook. We create visualizations and a simple dashboard that show the top conditions (comorbidities) in our real world data and also analyze the correlation between any two conditions specified by the user.
Extract, transform and load (ETL)
To begin, we use pyspark to read EHR data from comma-separated values (CSV) files, de-identify patient personally identifiable information (PII) and write to Delta Lake for analysis. Using Delta Lake is a best practice for ingestion, ETL and stream processing as an open source format with support for ACID transactions, faster processing with Delta Engine and easy integration with other Azure services for additional use cases.

EHR data analysis and comorbidity dashboard
In this notebook we visualize top conditions in the database and create a simple dashboard to analyze the correlation between any two conditions specified by the user. You can share this notebook as a dashboard following these instructions.

Next steps
For additional background on this use case see this blog post. See live demos or get hands on at an Azure Databricks event. Go even deeper with this 3-part webinar training series to operationalize machine learning models for your own organization.
by Contributed | Dec 16, 2020 | Technology
This article is contributed. See the original author and article here.
Hello Dear Reader, when last we were together in CI CD in Azure Synapse Analytics Part 1 we started out our series by:
- Creating an Azure DevOps project
- Linking our Azure Synapse Analytics environment to that Project via Git
- Validating that our Azure DevOps Repo was populated with our Azure Synapse Analytics environment
This time we will:
- Create a new branch on our Repo
- Edit our Azure Synapse Analytics environment
- Specifically my SQL scripts have demos all over the place and Buck Woody said I have to clean up my
very messy room …. Azure Synapse Analytics environment
- Create a Pull Request in Azure Synapse Analytics to merge our new branch with the main
- Approve the Pull Request in Azure DevOps
- Validate our main branch is updated in our Azure Synapse Analytics Environment
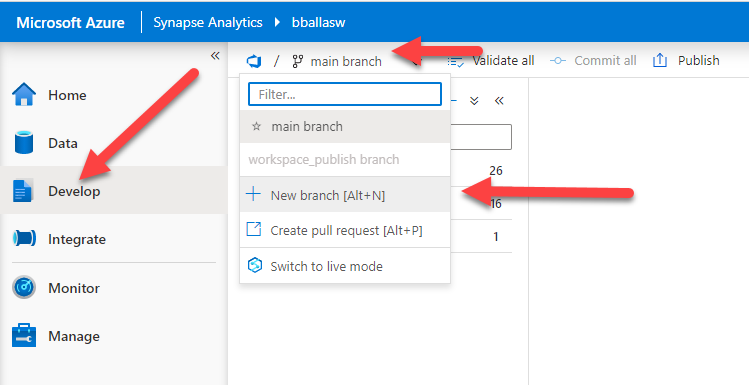
We will start by opening up our Azure Synapse Analytics environment by navigating to https://web.azuresynapse.net and signing in, and then navigating to the Develop blade. We will then click on the down arrow next to the main branch and select + New Branch.
Our DevOps project stores SQL scripts, Pipelines, Notebooks, Linked Services, and many other items from our Azure Synapse Analytics environment. It also stores meta-data. Today we will make pure meta-data changes by creating folders to organize our SQL Scripts. So we will create a working branch that describes our change and name it Folders.

Looking at the Develop blade we can see that the main working branch has been supplanted by the Folders branch. We will click on the three ellipsis … next to SQL scripts and create a new folder.

Now we create our folders. We will repeat this step for each folder that we will create. The first folder will be for our SQL Serverless demos. Now a quick song montage while I create the rest of the folders for us.

Before we start organizing we will take a before picture. Here is a good look at all of my SQL Scripts without any folders.

These demos are all over the place!!! We start by hovering over one of the SQL Scripts and then clicking the three ellipsis … by the script and selecting Move to.

We will select the College demos folder for the 01 Create College Tables script, and then click move here. One more quick song montage while I organize all of the scripts for us.

Now that all of the scripts are organized there are some very IMPORTAINT things to point out. Each script has a dot next to the name. This signifies that the changes to our Folders branch have not yet been committed. We need to click on Commit all in order to save these.
If we navigated off of this page prior to committing the change all of the folders we created and the organization we’ve done would be gone.
If we were writing a new SQL script, Notebook, or Pipeline each of those items have a Commit button in the user interface. That will commit just that item as you work. You can also use the Commit all button if you want to commit all changes you’ve made to the branch. The good news is we have options!
So now we commit and preserve these changes.

After committing notice all of the dots have gone away. This means our commit to branch Folders was successful.
Now we go to the Folders Branch click the drop down button and click Create pull request.

This will launch Azure DevOps and bring us to a Pull Request window. Now is a good moment for a quick sidebar.
A few items <begin sidebar>:
- I’m an army of one right now
- In your environment you should have a sprint you are working on, and a work item associated with the work you are doing. That would get entered into the pull request for me (see item 1)
- You should have Reviewers identified for your code, and you would select them here, for me (see item 1)
- When you create this other processes would be in place, for the sake of the tutorial I will show you everything because….. (see item 1)
- </end sidebar>
We create a title stating what we are doing “Folders Merge”, in the description we give a little more info. We do not have Reviewers or a Work Item, remember the sidebar, then we click Create.

We will approve and then Complete these changes. This will merge the Folders branch with the main branch and the Folders branch will cease to exist.

Navigating back to our Azure Synapse Analytics environment we can see we are in the main branch and all of our beautiful folders are in place.

Next in our series we will migrate all of these changes to a new squeaky clean QA environment by creating an Azure DevOps pipeline to create an artifact and then a release pipeline to deploy our artifact to a new Azure Synapse Analytics QA.
Thank you for stopping by!

Recent Comments