by Priyesh Wagh | Dec 29, 2020 | Dynamics 365, Microsoft, Technology
As 2020 comes to a close, here’s a Power Automate / Cloud Flows quick tip that might benefit newbies to Power Automate.
Scenario
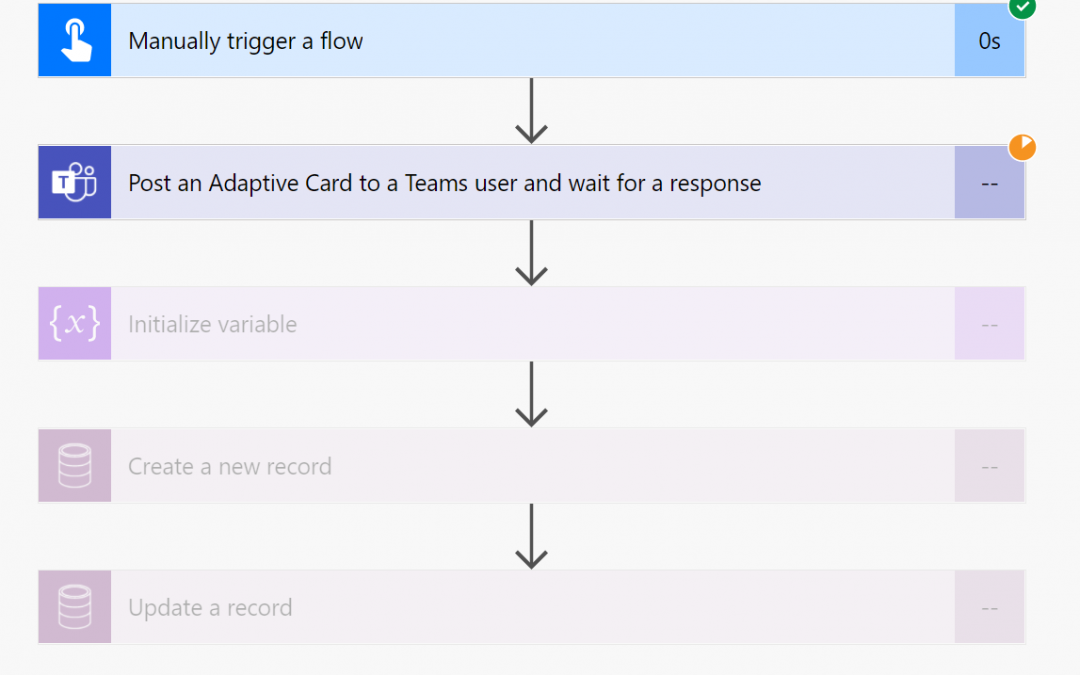
Some Flows need you to include Approvals or Adaptive Cards that halt the execution of the Flow until the Response from the target is sent back to the Flow.
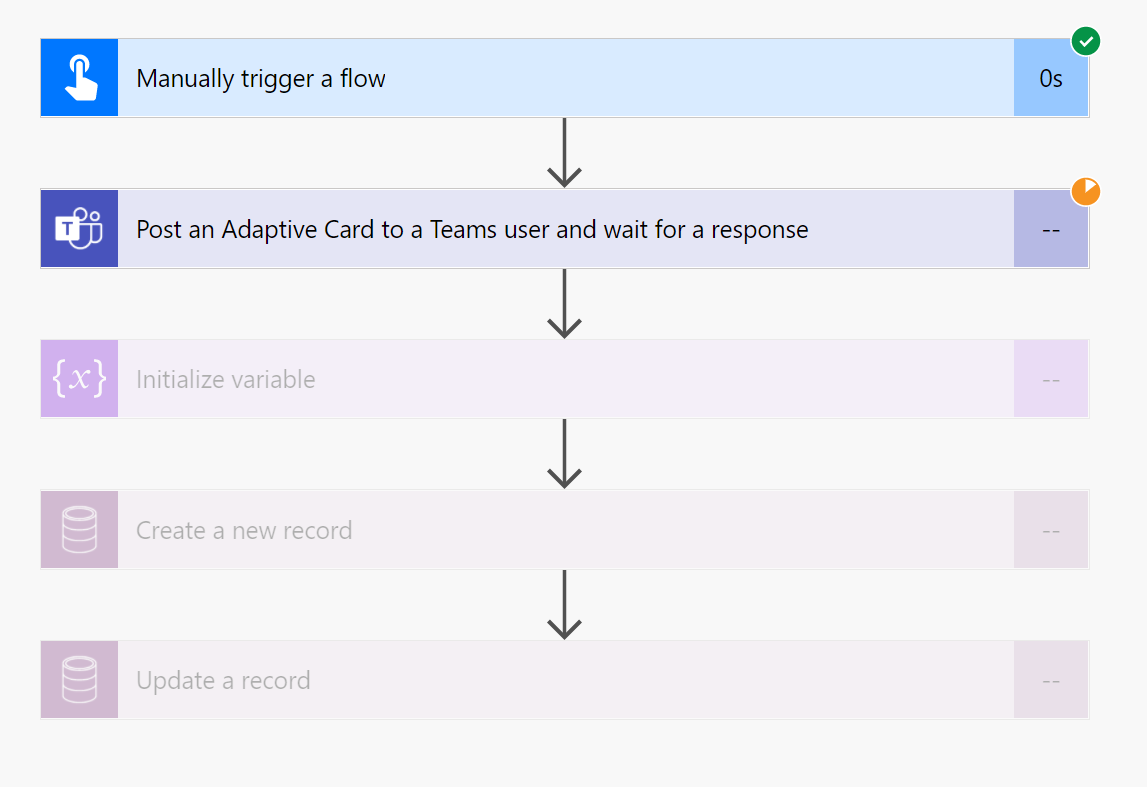
If there are some steps to be taken after the Response is received.
Parallel Branching
You can use Parallel Branching
- Select Parallel Branching instead of a normal Step.
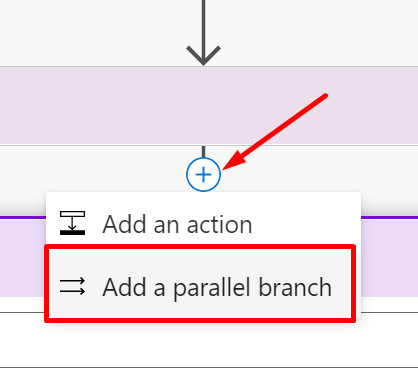
- Now, all the Response dependent Actions should be in one of the Branches – (Denoted by Red Box and arrow). And the other part where the execution is expected to be carried forward should be in the other branch – (Denoted by Green Box and arrow)

- The execution will then wait where the parallel branches merge finally. Else, each branch can choose to end independently if there are no inter-dependent actions to be take, like taking Response from the Parallel Branch as well. The Waiting state will look like this –

- Now, when the Response is submitted back, the Flow execution will continue from the point of convergence of the two parallelly separated branches.

With this, you can separate dependent activities by using Parallel Branching.
Hope this was useful!
Here are some more Power Automate / Cloud Flows posts that you might like to go through –
- Read OptionSet Labels from CDS/Dataverse Triggers or Action Steps in a Flow | Power Automate
- InvalidWorkflowTriggerName or InvalidWorkflowRunActionName error in saving Cloud Flows | Power Automate Quick Tip
- Create a Team, add Members in Microsoft Teams upon Project and Team Members creation in PSA / Project Operations | Power Automate
- Setting Lookup in a Flow CDS Connector: Classic vs. Current Environment connector | Power Automate Quick Tip
- Using outputs() function and JSON Parse to read data from missing dynamic value in a Flow | Power Automate
- Adaptive Cards for Outlook Actionable Messages using Power Automate | Power Platform
- Task Completion reminder using Flow Bot in Microsoft Teams | Power Automate
- Make On-Demand Flow to show up in Dynamics 365 | Power Automate
- Using triggerBody() / triggerOutput() to read CDS trigger metadata attributes in a Flow | Power Automate
- Adaptive Cards for Teams to collect data from users using Power Automate | SharePoint Lists
Thank you!!
Brought to you by Dr. Ware, Microsoft Office 365 Silver Partner, Charleston SC.
by Contributed | Dec 29, 2020 | Technology
This article is contributed. See the original author and article here.
This release brings support for older SQL Server versions (2012, 2014, 2016) into the version agnostic MP. That is, going forward just like SQL Server MP, we will have version-agnostic Replication MP that can monitor all SQL Server versions in support. This is the last MP in SQL Server MP family to move to full version-agnostic mode.
Please download at:
Microsoft System Center Management Pack for SQL Server Replication
What’s New
- Updated MP to support SQL Server 2012 through 2019
- Updated “Replication Agents failed on the Distributor” unit monitor to extend it for Log Reader and Queue Reader agents detection
- Added new property ‘DiskFreeSpace’ for “Publication Snapshot Available Space” unit monitor
- Removed “One or more of the Replication Agents are retrying on the Distributor” monitor as non-useful
- Removed “Availability of the Distribution database from a Subscriber” monitor as deprecated
- Updated display strings
Issues Fixed
- Fixed discovery issue on SQL Server 2019
- Fixed issue with the incorrect definition of ‘MachineName’ property of DB Engine in some discoveries and replication agent-state unit monitors
- Fixed issue with wrong property-bag key initialization on case-sensitive DB Engine in some unit monitors and performance rules
- Fixed issue with the critical state of “Replication Log Reader Agent State for the Distributor” and “Replication Queue Reader Agent State for Distributor” unit monitors
- Fixed wrong space calculation in “Publication Snapshot Available Space”
- Fixed duplication of securable detection for monitor “Subscriber Securables Configuration Status”
- Fixed issue with the incorrect definition of ‘InstanceName’ property in “Replication Database Health” discovery
- Fixed issue with an incorrect alert message for monitor “Pending Commands on Distributor”
- Fixed issue with incorrect condition detection for monitor “Total daily execution time of the Replication Agent”
by Contributed | Dec 28, 2020 | Technology
This article is contributed. See the original author and article here.
Compute>Host groups
- Automatic host assignment for Azure dedicated host groups
Intune
- Updates to Microsoft Intune
Let’s look at each of these updates in greater detail.
Compute>Host groups
Automatic host assignment for Azure dedicated host groups
You can now simplify the deployment of Azure VMs in Dedicated Hosts by letting the platform select the host in the dedicated host group to which the VM will be deployed. Additionally, you can use Virtual Machine Scale Sets in conjunction with Dedicated Hosts. This will allow you to use scale sets across multiple dedicated hosts as part of a dedicated host group.
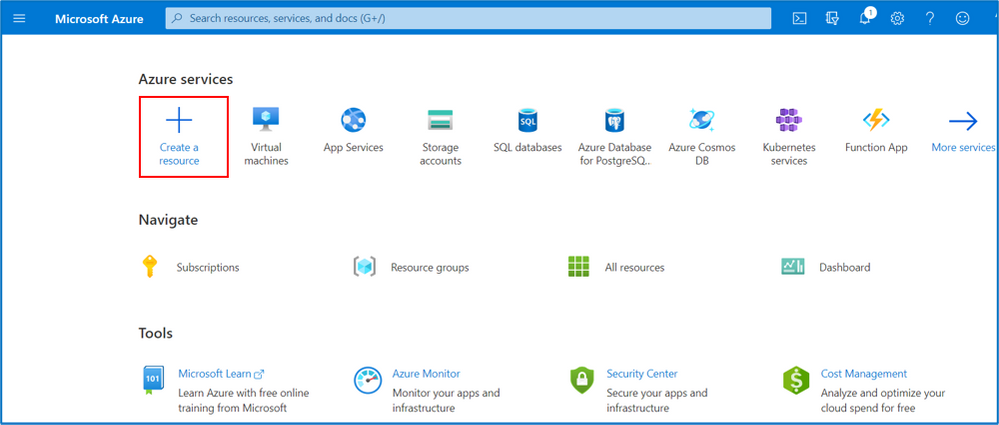
Step 1: Click “Create a resource”

Step 2: Type in “Host groups” in the search box -> select “Host Groups” when it appears below the search box
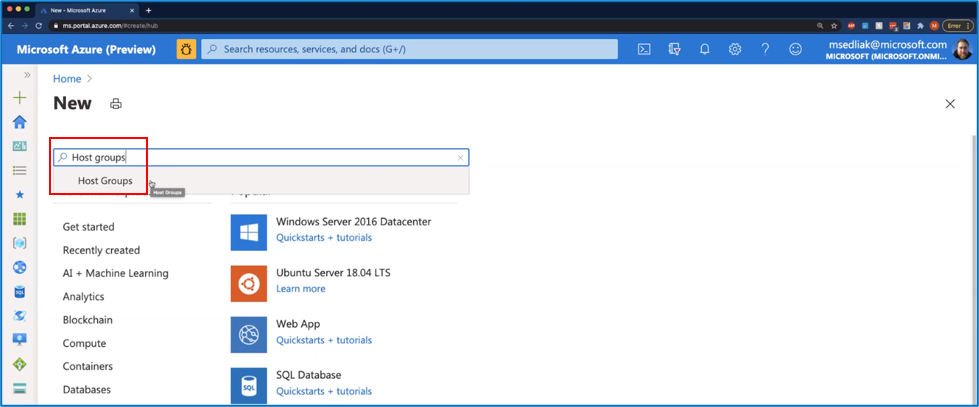
Step 3: Click on the drop down arrow to the right of “Create” under “Host Groups” and select “Host Groups” from the drop down option

Step 4: Put in the required fields as marked with an * -> check the “Support automatic host assignment” box -> click on “Review + create”
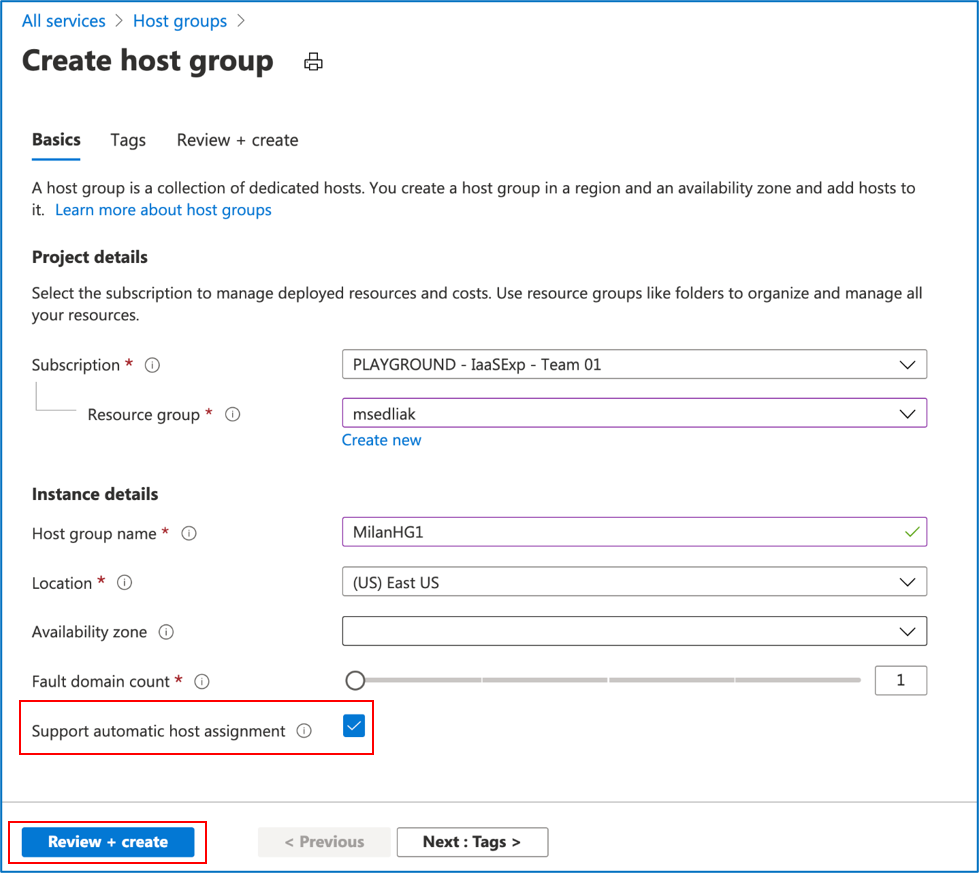
Step 5: A preview of what will be created will appear -> click on “Create”

Step 6: When the host group deployment is complete, click “Go to resource” to open the host group so you can proceed to add a host
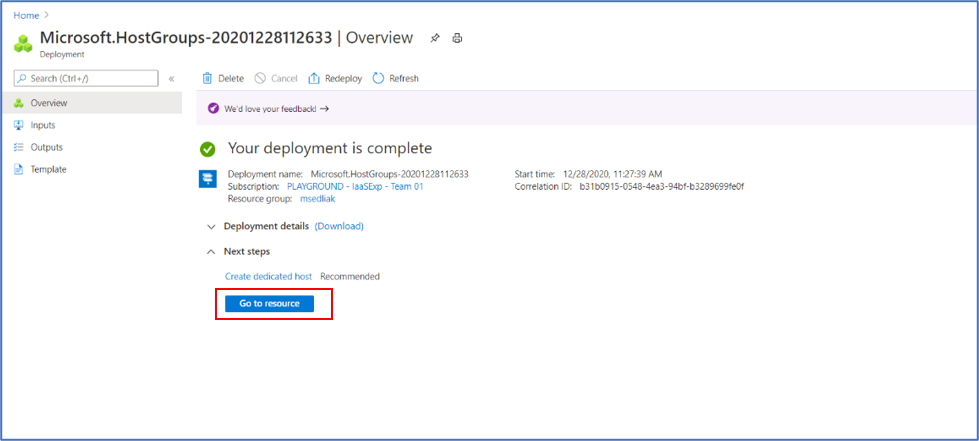
Step 7: Click on “Add host”
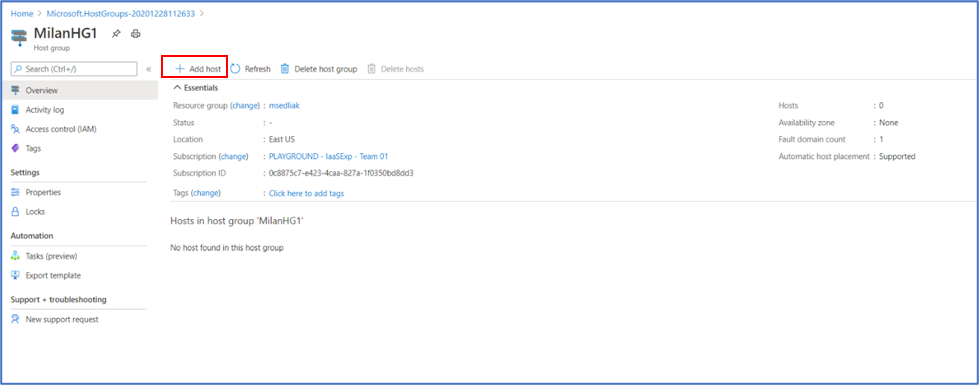
Step 8: Put in the required fields as marked with an *, making sure to select the same subscription ID and resource group as your host group -> click on “Review + create”
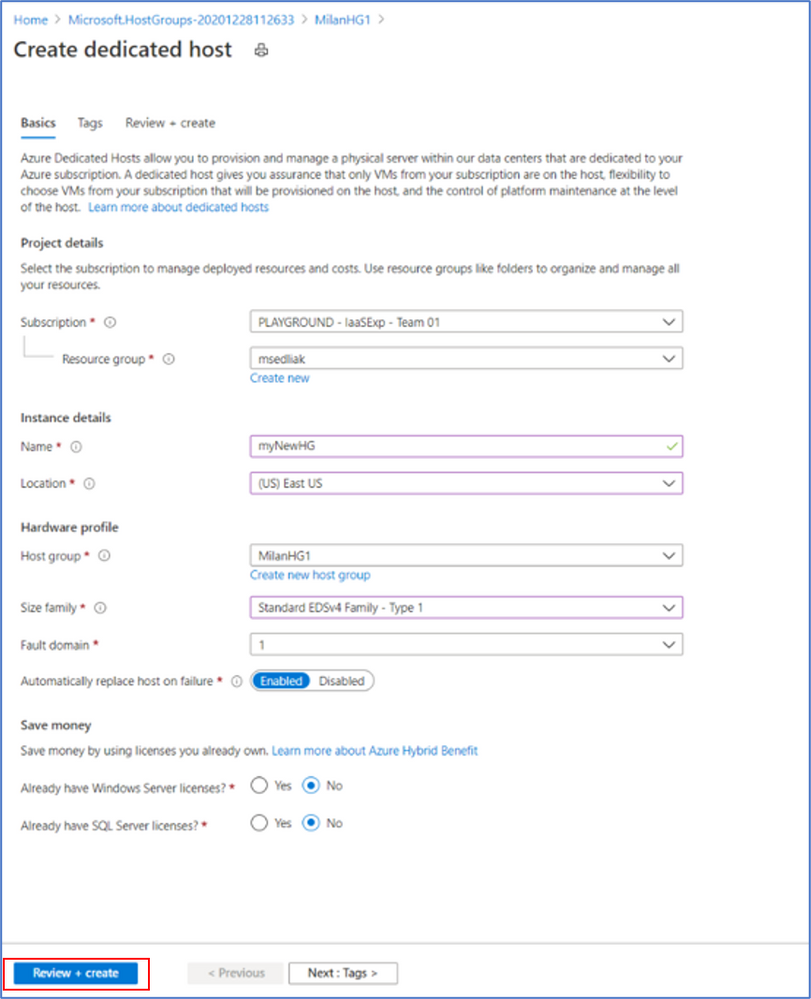
Step 9: A preview of what will be created will appear -> click on “Create”
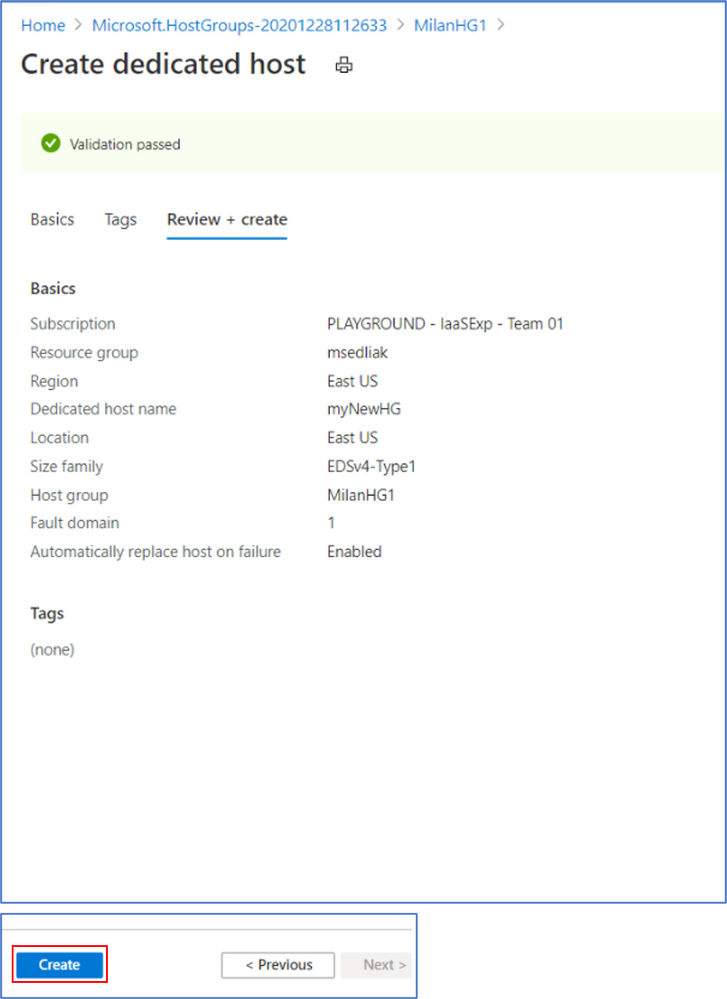
Step 10: Now that you have created a host group, you will need to create a Virtual Machine (or Virtual Machine Scale Set) to add to the host group.
- Click on “Create a resource” as in step 1 above
- Select “Compute” -> click on the “Virtual machine” icon
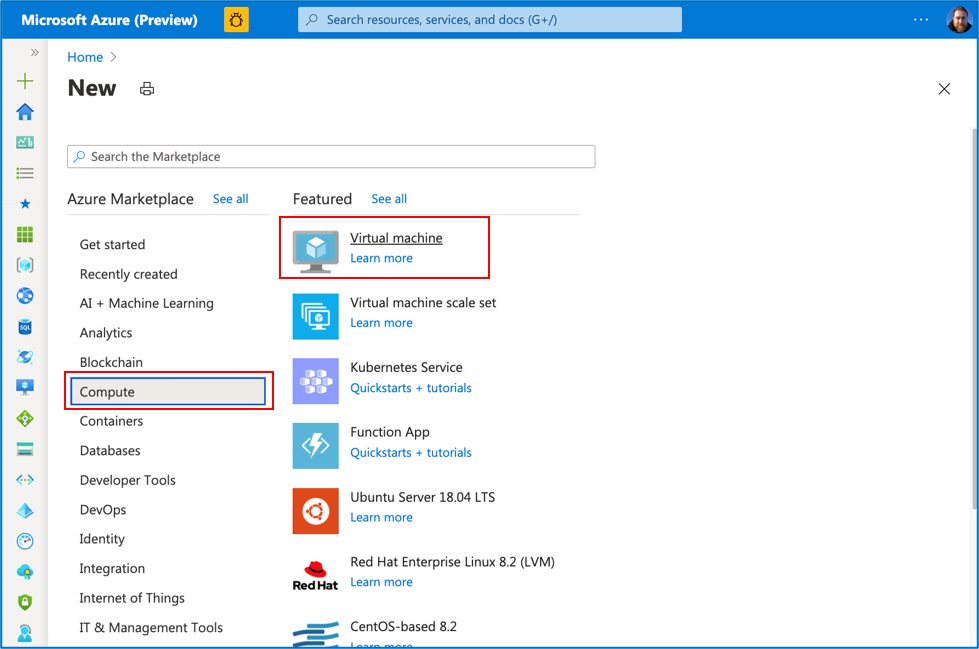
Step 11: Click “Create”

Step 12: Fill in all required information in the “Basics” tab
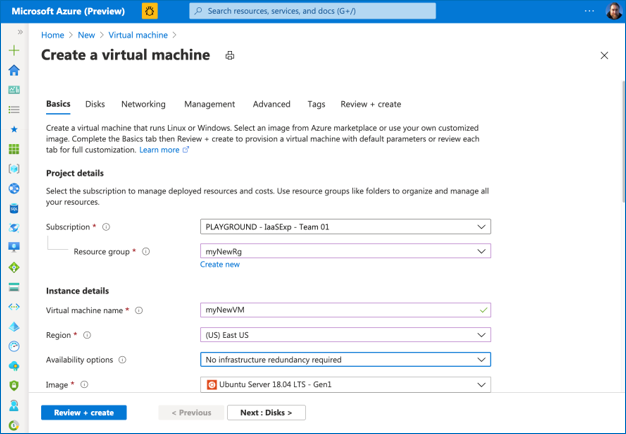
Step 13: Then click on the “Advanced” tab option
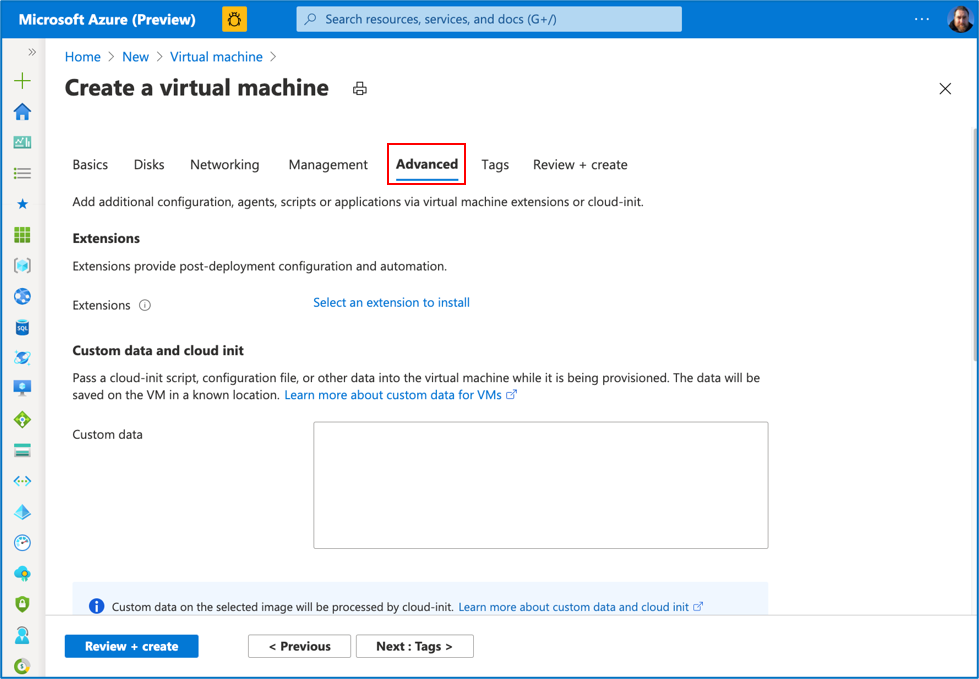
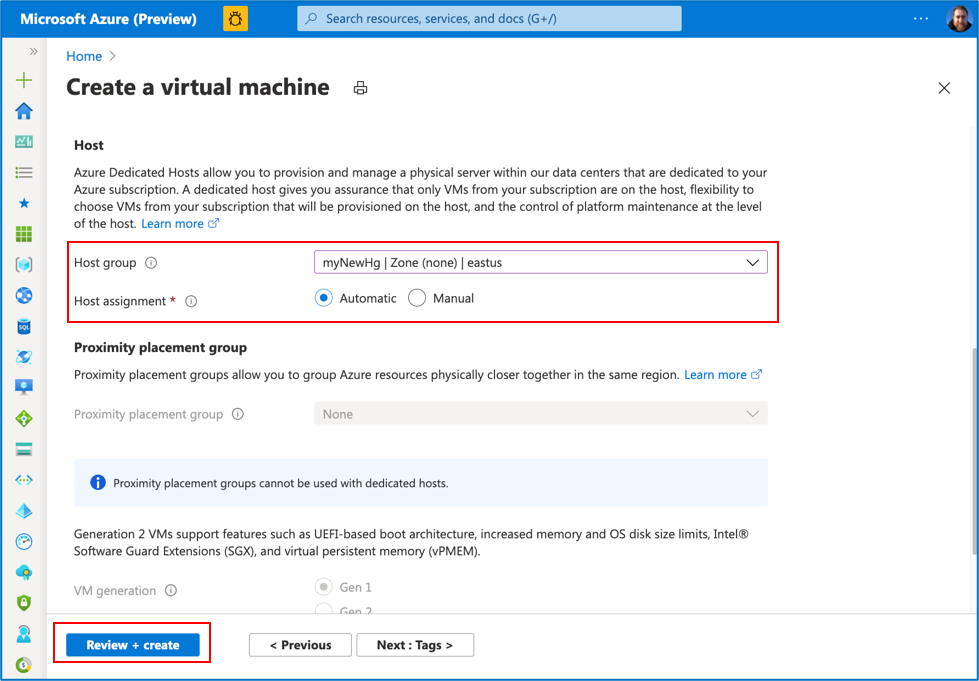
Step 14: Scroll down to the Host section:
- Select the Host group name from the drop down options
- Host assignment options will then appear; select “Automatic”
- Click on “Review + create”
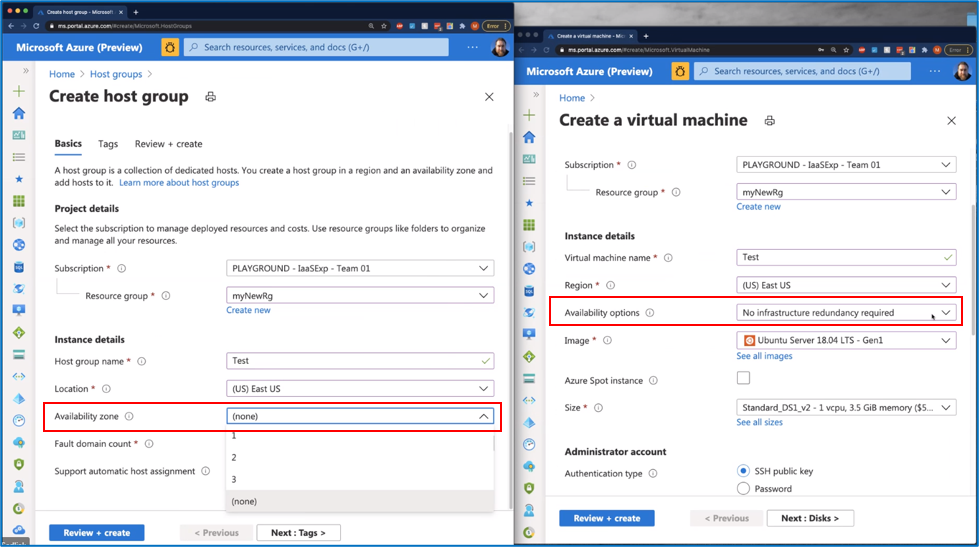
Important Notes:
- Make sure you use the same Subscription, Resource group, Region, and size Family as your dedicated host
- Due to the recent changes in the Create Virtual Machine experience, make sure that “Availability zone” in your Host group matches up with “Availability options” of your Virtual Machine (or Virtual Machine Scale Set). For example, if you use availability zone “1” in “Create a host group”, then select “Availability Zones” in “Availability options” and set “Availability zone” to “1”. However, if you use “(none)” in Availability zone in “Create host group”, then make sure you use “No infrastructure redundancy required” in Availability options in “Create a Virtual Machine”.
INTUNE
Updates to Microsoft Intune
The Microsoft Intune team has been hard at work on updates as well. You can find the full list of updates to Intune on the What’s new in Microsoft Intune page, including changes that affect your experience using Intune.
Azure portal “how to” video series
Have you checked out our Azure portal “how to” video series yet? The videos highlight specific aspects of the portal so you can be more efficient and productive while deploying your cloud workloads from the portal. Check out our most recently published videos:
Next steps
The Azure portal has a large team of engineers that wants to hear from you, so please keep providing us your feedback in the comments section below or on Twitter @AzurePortal.
Sign in to the Azure portal now and see for yourself everything that’s new. Download the Azure mobile app to stay connected to your Azure resources anytime, anywhere. See you next month!
by Contributed | Dec 28, 2020 | Technology
This article is contributed. See the original author and article here.
Introduction
A common ask from enterprise customers is the ability to monitor for the creation of Azure Subscriptions. This is not as easy as you might think so I wanted to walk you through a solution I’ve used to accomplish this. Below we will walk through creating an Azure Logic App that runs on a schedule and inserts the current subscriptions into Log Analytics. Once we have the data in Log Analytics we can either visualize new subscriptions or alert on them.
Step 1: Create a Service Principal
Our Logic App will utilize a Service Principal to query for the existing subscriptions. For this solution to work as intended you need to create a new Service Principal and then give them at least “Read” rights at your root Management Group.
If you’ve never created a service principal, you can follow this article:
Create an Azure AD app & service principal in the portal – Microsoft identity platform | Microsoft Docs
You’ll need the following information from the service principal:
- Application (client) id
- Tenant id
- Secret
Once the service principal has been created you need to give it reader rights at the Management Group level.
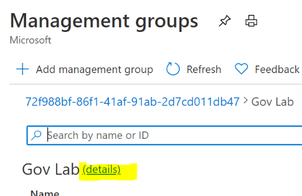
Open the “Management Group” blade in the Azure portal. From the root Management Group click on the (details) link.

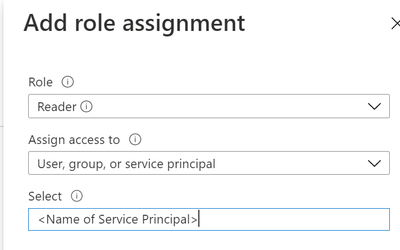
Click on “Access Control” | “Add” | “Add role assignment”

Grant the Service Principal the “Reader” role.
Step 2: Create the Logic App
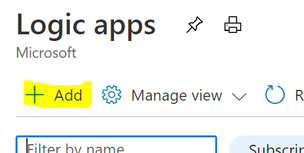
In the Logic App blade click on “Add”
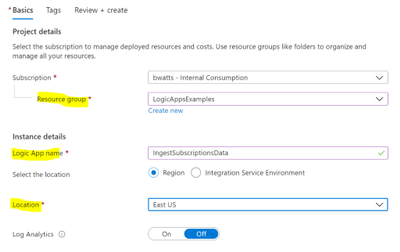
Fill in the required fields and create the Logic App.
In the Logic App Designer choose the “Recurrence” template.
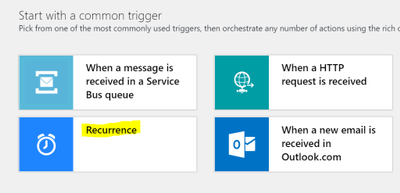
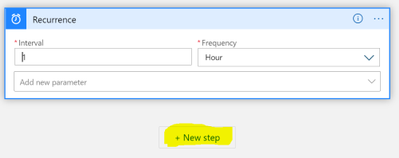
Configure the interval that you want to query for subscriptions. I chose to query every hour below. Then click on the “New step” button:
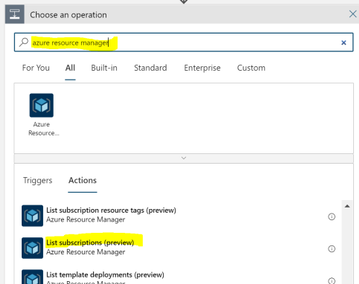
Search for “azure resource manager” and choose the “List subscriptions (preview)” action.
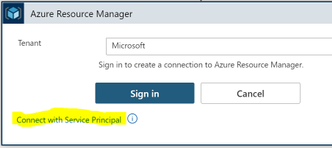
You want to connect with a service principal.
Fill in the information for your service principal (the “Connection Name” is just a display name):
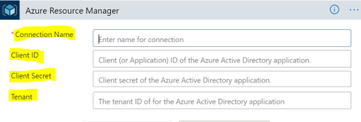
Note that this action doesn’t require any configuration besides setting up the connection. After configuring the service principal click on “New Step” and search for “Azure Log Analytics.” Choose the “Send Data (preview)” action.
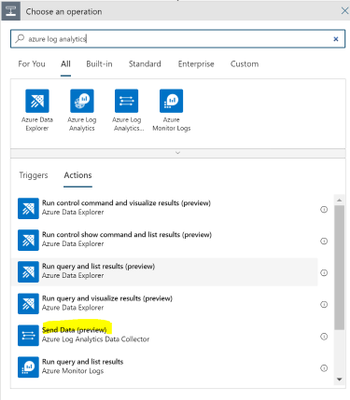
Connect to the Log Analytics workspace that you want to send the data to. You can get the workspace id and key within the Log Analytics blade in Azure:
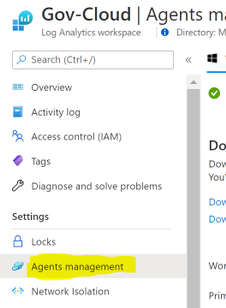
Once the connection is made to the Log Analytics Workspace you need to configure the connector:
- JSON Request Body: click in the box and then choose “Item” from the dynamic content

- Custom Log Name: Name of the log to be created in Log Analytics. Below I chose SubscriptionInventory
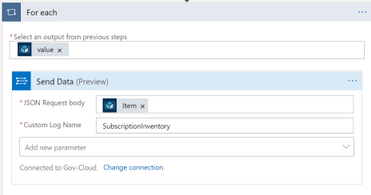
Note that when you choose “Item” it will put the “Send Data” action into a loop.
We can go ahead and save the Logic App and optionally run it to test the insertion of data into Log Analytics.
Step 3: Wait
This Logic App will need to run for a while before the data is useful. You can verify that the Logic App runs every hour and view the raw data in Log Analytics to verify everything is working.
Below is an example of viewing the table “SubscirptionInventory_CL” in Log Analytics

Step 4: Setting up Alerts
We will setup an alert for Subscriptions created in the last 4 hours.
Below is the Kusto query we can use to find the subscriptions created in the last 4 hours:
SubscriptionInventory_CL
| summarize arg_min(TimeGenerated, *) by SubscriptionId
| where TimeGenerated >= ago(4h)
| project TimeGenerated, displayName_s, state_s, SubscriptionId
The key to this query is using the arg_min to get the first time we see the subscription added to log analytics. When we setup the alert we will look back a couple days and get the first occurrence of the subscription and then if the first occurrence is within the last 4 hours create an alert.
Now we are ready to create the alert within Azure Monitor. Open your Log Analytics Workspace and go to the Logs tab. Run the above query in Log Analytics and then click on “New alert rule”

**Note: I find this easier than going through Azure Monitor to create the alert because this selects your workspace and puts the correct query in the alert configuration.
You’ll see a red exclamation point next to the condition. Click on the condition to finish configuring the alert. Below are the parts you need to configure highlighted.
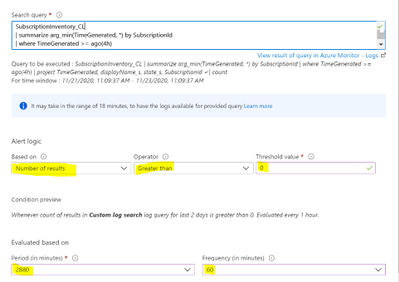
Now you just finish creating the alert. If you’ve never created an Azure Monitor Alert here is documentation to help you finish the process.
Create, view, and manage log alerts Using Azure Monitor – Azure Monitor | Microsoft Docs
**Note: Make sure you let the Logic App run for longer than the period you’re alerting on. In this example I’d need to let my Logic App run for at least 5 hours (4 hours is the alert threshold + 1 hour). The query relies on the history so if I run this before my Logic App has run long enough then it will trigger saying every subscription.
Step 5: Visualizing through Workbooks
We can utilize a simple Azure Workbook to visualize the data in Log Analytics. The below workbook has the following parameters:
- Created Since: set this to show all the subscriptions created since this date
- Subscription: Filter down to the subscription that has the Log Analytics Workspace with the data
- LA Workspace: Select the Log Analytics workspace that you’re Logic App is putting data into
**Note: This workbook is assuming that the table name that your using is SubscriptionInventory_CL. If you’re using a different table name then you’ll need to modify the queries in the workbook.
Once you fill in the parameters there will be a simple table showing the day we detected the subscription, the display name, the state and the subscription id.

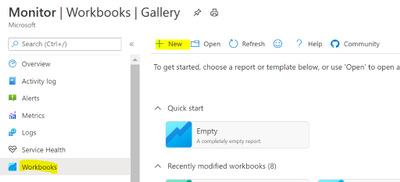
Open the Azure Monitor blade and go to the Workbook tab. Click on “New”
Click on the “Advanced Editor”
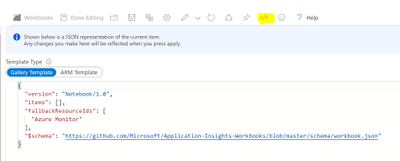
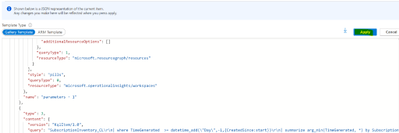
Replace the content from the following link:
https://raw.githubusercontent.com/bwatts64/Downloads/master/New_Subscriptions
Click on Apply:
You can now verify that you’re able to visualize the data in Log Analytics. Once you’ve verified that click on “Save” to save the newly created workbook.

Summary
Monitoring new subscription creating in your Azure Tenant is a common ask by customers. Here we have utilized a Logic App to insert our subscription data into Log Analytics. From there we can both alert and visualize new subscriptions that are created in your environment.
by Contributed | Dec 28, 2020 | Technology
This article is contributed. See the original author and article here.
If you’re not already running your electronic design automation (EDA) backend workflows in the cloud, you’ve no doubt been seriously exploring options that would let you take advantage of the scale of cloud computing. One large hurdle for most cloud infrastructure architects has been getting tools, libraries, and datasets in to Azure from on-premises storage. The magnitude and complexity of data movement and other issues—such as securing your intellectual property (IP)—are challenging to many teams that could otherwise benefit from running EDA verification workloads on Azure high-performance computing (HPC) resources.
With the availability of the Azure HPC Cache service, and orchestration tools like Terraform from Hashicorp, it’s actually much easier than you may think to safely present your tools, libraries, IP design, and other data to large Azure HPC compute farms managed by Azure Cycle Cloud.
Use Azure HPC Cache for high throughput, low latency access to on-premises NAS
Azure HPC Cache is the pivotal service that brings together the high performance and low latency file access experience needed to be able to leverage Azure for efficiently running EDA backend tools that demand high processor clock rates and present considerable file I/O overhead. The intelligent-caching file service enables a hybrid-infrastructure environment, meaning that you can burst your EDA backend compute grid into Azure with reliably high-speed access to your on-premises network-attached storage (NAS) data. Azure HPC Cache eliminates the need to explicitly copy your tools, libraries, IP, and other proprietary information, from on-prem storage into the cloud or to permanently store it there. The cached copy can be destroyed and/or re-cached at essentially the press of the button.
Use Terraform to orchestrate infrastructure provisioning and management
The availability of new cloud orchestration tools like Hashicorp’s Terraform make it much simpler to deploy cloud resources. These tools work by letting you express your infrastructure as code (IaC) so that IT and cloud architects are do not have to continually reinvent the wheel to set up new or expanding cloud environments.
Hashicorp Terraform is one of the most common IaC tools—you may even already be using it to manage your on-premises infrastructure. It’s an open-source tool (downloadable from Hashicorp) that codifies infrastructure in modular configuration files that describe the topology of cloud resources. You can use it to simultaneously provision and manage both on-premises and cloud infrastructure, including Azure HPC Cache service instances. By helping you quickly, reliably, and precisely scale infrastructure up and down, IaC automation helps ensure that you’ll pay for resources only when you actually need and use them.
Use Azure CycleCloud for compute scalability, pay-for-only-what-you-use elasticity, and because it’s easier than you thought
The obvious advantages to using Azure include unlimited access to virtual machines (VMs) and CPU cores that let you scale out backend EDA workflow jobs as fast and as parallel as possible. Azure CycleCloud can connect to IBM LSF to manage the compute farm deployment in unison with your LSF job scheduling. The HPC Cache component lets you maintain control of your data while providing low-latency storage access to keep cloud computing CPU cores busily productive. With high-speed access to all required data, your queued-up verification jobs will run continuously, and you’ll minimize paying for idle cloud resources.
Summarizing the benefits, Azure HPC Cache and automation tools like Terraform let you more easily take advantage of cloud compute by:
- Providing high-speed access to on-premises data with scalability to support tens of thousands of cloud-based compute cores
- Minimizing complex data movement processes
- Streamlining provisioning and management for rapid deployment and to maintain the familiarity of existing workflows and processes—push-button deployment means electronic design architects don’t have to change what they’re used to doing
- Ensuring proprietary data does not linger in the cloud afer compute tasks are finished
Azure solutions truly democratize technology, making massive, on-demand compute resources accessible to EDA businesses of every size, from small designers to mid-size semiconductor manufacturers and the largest chip foundries. With access to tens of thousands of compute cores in Azure, companies can meet surge compute demand with the elasticity they need.
Use validated architectures
Lest you’re concerned about blazing new territory, be assured that EDA customers are already running many popular tool suites in Azure. And, they’ve validated those workloads against the HPC Cache. To give you an idea of results, for workloads running such tools as Ansys RedHawk-SC, Cadence Xcelium, Mentor Calibre DRC, Synopsys PrimeTime, and Synopsys TetraMAX, users report behavior and performance similar to or better than running the same backend workloads on their own datacenter infrastructure. Our Azure and HPC Cache teams also routinely work with EDA software tools vendors to optimize design solutions for Azure deployment.
Build on reference architectures
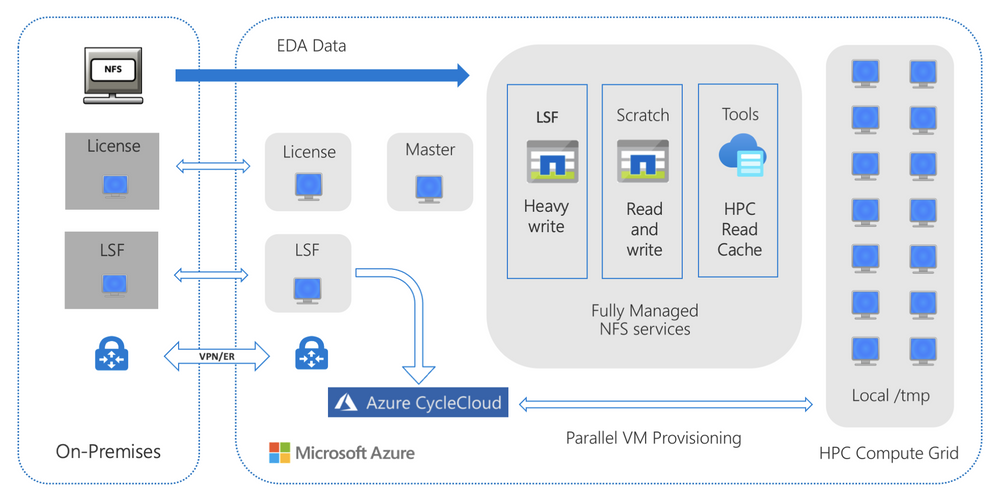
The reference architectures below illustrate how you can use HPC Cache for EDA workloads in both cloud-bursting (hybrid) and fully-on-Azure architectures.
 Figure 1. A general reference architecture for fully managed caching of on-premises NAS with the Azure HPC Cache service to burst verification workloads to Azure compute.
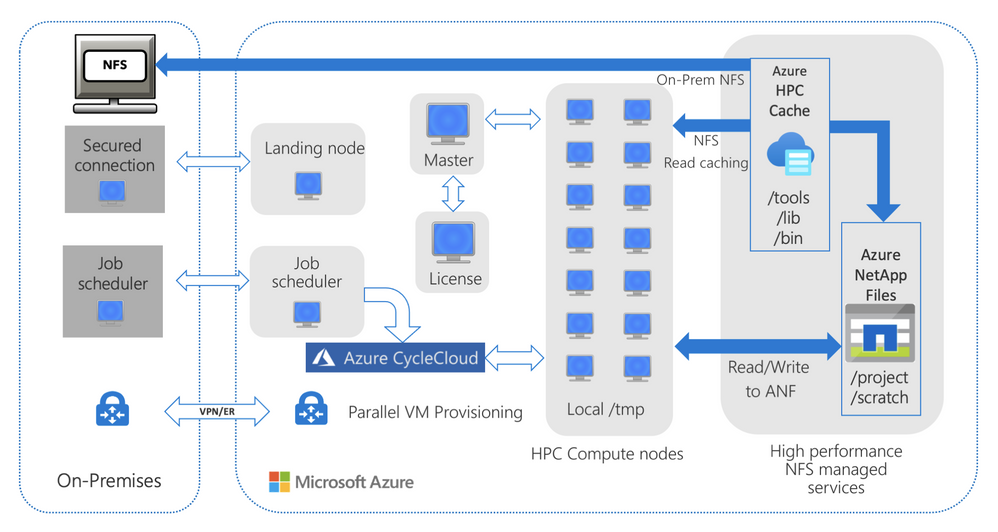 Figure 2. A general reference architecture with on-premises NAS and HPC Cache optimizing read access to tools and libraries hosted on-premises, and project data hosted on ANF.
Access additional resources
Follow the links below for additional information about Azure HPC Cache and related tools and services.
Azure for EDA
https://azure.microsoft.com/en-us/solutions/high-performance-computing/silicon/#solutions
Infrastructure as Code
https://docs.microsoft.com/en-us/azure/devops/learn/what-is-infrastructure-as-code
Azure HPC Cache
https://azure.microsoft.com/en-us/services/hpc-cache/
Terraform with Azure
https://docs.microsoft.com/en-us/azure/terraform/terraform-overview
Azure CycleCloud LSF Connector
https://docs.microsoft.com/en-us/azure/cyclecloud/lsf
Terraform and HPC Cache
https://github.com/Azure/Avere/tree/main/src/terraform/examples/HPC%20Cache
As always, we appreciate your comments. If you need additional information about Azure HPC Cache services, you can visit our github page or message our team through the tech community.


Recent Comments