by Contributed | Dec 11, 2020 | Technology
This article is contributed. See the original author and article here.
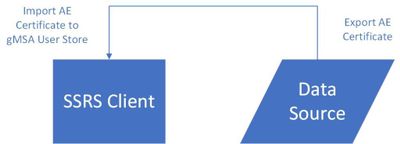
Let’s take a look at how to display Always Encrypted Data in SSRS with a gMSA (Group Managed Service Account). We are mixing some technologies and the one that throws a wrench into things is the gMSA. Here is the flow for moving the certificates.
Always Encrypted protects our data both at rest and in transit. To accomplish that, SQL only stores the encrypted data and cannot decrypt it; all the work is done by the client. In our case the client is SSRS and it is the account running the SSRS service that will need the certificate to decrypt data. Note that it is not the account running the report.
Certificate Stores
When configuring Always Encrypted, we have a choice between two key stores. In our example we will use the Windows Certificate Store. You can also use Azure Key Vault, but direct access with that method is not supported with SSRS. You could use the Windows Certificate Store, export the certificate, and import it into Azure Key Vault. However, SSRS cannot directly access Azure Key Vault.
The certificate is important because we must export it so we can later import it to our clients. Best practice is to run the Encrypt Column Wizard in SSMS from a server that is not the server hosting your data. This prevents us from accidentally leaving the cert on the server where if it gets compromised the attacker could get both the data and the certificate.
Always Encrypted Wizard
If you run the wizard from the client or application server, you have two choices. The first is to run SSMS as an administrator so you can store the certificate in the local machine store. This allows any application on the server to use the certificate if you give it permissions to do so. If you do not run SSMS as an administrator, you will only see the option to store the certificate in the local user store for the current user.

For our example we will use the Current User store to comply with the principal of “Least User Privilege“. Once we complete the Always Encrypted wizard, you can open Certificate Manager and export the cert making sure to include the private key.


Always Encrypted Certificate Import
We have our column encrypted and have exported the certificate. Next, we need to import it on the SSRS server. This is where the fun begins. You might be tempted to just import the certificate into the local machine store instead of the user store so all applications can use it. This does not work, and you will have to import into the user store for the account running the SSRS service. Normally you could right click the certificate manager and select “Run As” to be in the context of the account running SSRS. This does not work with a gMSA because you don’t know the password.
Get Creative
It’s time to get creative and break out some SysInternals tools. We are going to use PSExec to open Certificate Manager under the credentials of our SSRS gMSA account. We start by opening an administrative command prompt and executing the following from the location where we downloaded the SysInternals tools.

The first parameter -i is needed since we will be launching another command prompt interactively on the desktop. The second parameter -u provides our username and, in our case, the gMSA running the SSRS service. Remember that gMSA accounts need a $ sign at the end. The third parameter -p is the password for the gMSA account, but we do not know what it is. The ~ is allowed in place of the password. The last thing we provide is the executable we want to run. For us it will be another command prompt. Ideally, we would like to just run certmgr.exe from here, but that does not work.
Once you hit enter another command prompt will open where we can enter certmgr.exe to open the Certificate Manager under the context of our gMSA account. Now we can finally import the certificate.


View Your Reports
That’s it! Now you can go open your report in SSRS and see your Always Encrypted data displayed. These are some great security technologies, but it takes some outside of the box ideas to get them working together correctly.
by Contributed | Dec 11, 2020 | Technology
This article is contributed. See the original author and article here.
Purpose:
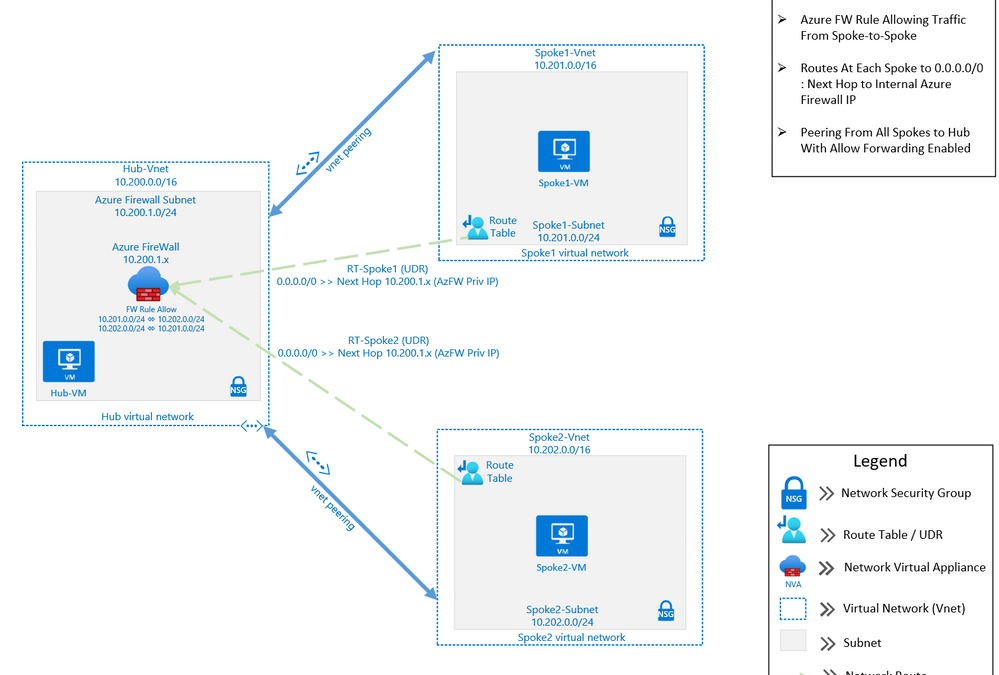
The purpose of this post is to demonstrate using Azure Firewall to control network traffic routing between Hub and Spoke networks in a Hub and Spoke Network Architecture. The Hub & Spoke Azure Architecture has become a common network topology for Azure deployments. The Cloud Adoption Framework describes this architecture in great depth. As with anything in cloud computing, there are several functional options to accomplish just about any goal but in this writing we will be focusing on how you can use the Azure Firewall as your routing device, also known as a Network Virtual Appliance, or NVA. We will walk through the process of building a Hub and Spoke Network Architecture that includes Spoke-to-Spoke routing. The key components that we will use to build this architecture are Azure Firewall, Route Tables (or UDR’s), and Virtual Network Peering (Vnet Peering).
This architecture can be used in many situations. A common scenario would be an enterprise network that may have resources that run between two or more Virtual Networks. In this scenario, there may be a web front-end, an application and a data tier that may need to communicate between with one another across those virtual networks. If these tiers are in different Virtual Networks, then routing will need to occur in order for network traffic to be able to cross those Virtual Network boundaries (e.g., data tier communicating with app or web tier). This writing will describe how to setup a solution to accomplish these goals.

Assumptions: Knowledge of creating Azure virtual machines and Azure virtual networks, as well as user-defined routes and peering is assumed. The firewall rules described in this writing will allow all outbound traffic from resources in Spoke1 and Spoke2. This configuration is for demonstration purposes only. Depending on the security posture needed for a production environment, this configuration would likely be more tightly controlled from the firewall. For our demonstration purposes, this configuration is being used for functionality and convenience.
Here are the required items to deploy this solution:
Resource Group:
Virtual Networks:
- Hub
- Address Space: 10.200.0.0/16
- Subnet named AzureFirewallSubnet : 10.200.1.0/24
- Subnet named hub-subnet: 10.200.0.0/24
- Spoke1
- Address Space: 10.201.0.0/16
- Subnet named spoke1-subnet: 10.201.0.0/24
- Spoke2
- Address Space: 10.202.0.0/16
- Subnet named spoke2-subnet: 10.202.0.0/24
Virtual Network Peering:
- Hub peers with Spoke1 (bi-directional)
- Forwarding must be enabled
- Hub peers with Spoke2 (bi-directional)
- Forwarding must be enabled
Route Tables:
- RT-Spoke1
- Attached to default subnet in Spoke1-Vnet.
- Routes:
- 0.0.0.0/0: Next Hop: <<Azure Firewall Private IP>>
- RT-Spoke2
- Attached to default subnet in Spoke2-Vnet.
- Routes:
- 0.0.0.0/0: Next Hop: <<Azure Firewall Private IP>>
Azure Firewall:
- NAT Rule Collection:
- Rule 1, priority 1000 allow:
- Spoke1-RDP, allow traffic from any source to destination firewall public IP address on port 3389 which is translated to Spoke1 VM private IP address on port 3389
- Network Rule Collections:
- Rule 1, priority 2000, allow:
- Spoke1-Outbound, allow all traffic from source 10.201.0.0/24 to any destination, all ports
- Spoke2-Outbound, allow all traffic from source 10.202.0.0/24 to any destination, all ports
Virtual Machines:
- (3) Windows VM’s
- (1) VM in Hub VNet, hub-subnet
- (1) VM in Spoke1 VNet, spoke1-subnet
- (1) VM in Spoke2 Vnet, spoke2-subnet
Step-by-step:
- Create the three virtual networks as outlined above: one hub and two spokes. Also create two Azure Virtual Machines of any size and without public IP addresses and place one on each spoke virtual network.
- Peer Spoke1 with the hub and peer Spoke2 with the hub. Do NOT peer Spoke1 and Spoke2. Enable the following settings on each peering:

Note: If you have a VPN gateway on the hub network and wish to use it to connect to an on-premise network, select “Use this virtual network’s gateway” on the hub peering.
When complete, the peering should indicate Connected:

- Create an Azure Firewall resource and place it in the hub virtual network. Assign an existing public IP address or add a new one. Since we are using the Azure Firewall as the virtual appliance, there is no need to enable Forced Tunneling to be able to send traffic to a secondary virtual appliance.
Azure Portal -> search for and click Firewalls -> click Add:

When the firewall resource is created, access it (Azure Portal -> search for and click Firewalls -> click the newly created firewall) and click Overview. Make note of the firewall’s public and private IP addresses as starred below:

- Create a user-defined route (UDR) route for Spoke1. The route will point all traffic (0.0.0.0/0) to the Azure Firewall private IP address gathered in step 3. To complete this step, you will need to create a Route Table with the following settings:
- Routes
- Address Prefix: 0.0.0.0/0
- Next Hop Type: Virtual Appliance
- Next Hop Address: <<Private IP of Azure Firewall>>
- Subnets
- Associate to the subnet for Spoke1, in our example 10.201.0.0/24
The completed routes should look like this:

- Create a similar route for Spoke2 and associate it to that subnet. It should look like this:
- Routes
- Address Prefix: 0.0.0.0/0
- Next Hop Type: Virtual Appliance
- Next Hop Address: <<Private IP of Azure Firewall>>
- Subnets
- Associate to the subnet for Spoke2, in our example 10.202.0.0/24.

- Within Azure Firewall, create a NAT rule collection for the Spoke1 VM with priority 1000. This will allow inbound RDP to the chosen VM. Note the Destination Address in the rule is the firewall’s public IP address gathered in step 3 and the Translated address is the Spoke1 VM private IP address. Use port 3389 for both the Destination and Translated ports. This rule effectively says, “For inbound traffic to my firewall’s public IP address on port 3389, translate it to my Spoke1 VM private IP address also on port 3389.”
Note: Allowing RDP to a VM is fine in our test setting but in a production environment another more secure arrangement (such as using a jump box) would be a better practice.
Azure Portal -> search for and click Firewalls -> click the newly-created firewall -> under Settings click Rules -> click NAT rule collection -> click Add NAT rule collection -> configure the rule using the settings below -> click Add to save the rule.

- Still in Azure Firewall, create a Network rule collection for the spokes with priority 2000 that will allow RDP traffic between the spokes and any destination.
Note it is possible to create just one rule to accomplish this but creating two rules, one per spoke, allows for changes to just one spoke, i.e., if you wanted to allow traffic from just one spoke to the other but not the internet.
In the firewall under Settings click Rules -> click Network rule collection -> click Add network rule collection -> configure the rule using the settings below -> click Add to save the rule.

- Now that everything is in place, let’s test it by using RDP to connect to the Spoke1 VM. Note to do this, you connect to the Spoke1 VM using the firewall public IP address in your RDP client. The sole NAT rule collection we created will send the traffic to the Spoke1 VM. Once logged in, perform the following tests:
- Ping the Spoke2 VM.
- Tracert to the Spoke2 VM -> verify the firewall private IP is the first hop, noting that sometimes the IP listed will not be the actual firewall IP but an IP in the same firewall subnet.
- Tracert to bing.com -> very the firewall private IP is the first hop (again, could be IP on same subnet)
- Open a web browser and visit https://whatismyipaddress.com/. Verify the public IP address this site returns matches the firewall’s public IP address listed on the firewall’s Overview page.
These tests show that intra-spoke and internet traffic goes through the Azure Firewall.
Conclusion:
If all tests are successful you have used Azure Firewall to route virtual network traffic between hub and spokes as well as the internet. Not only have you made your network more secure, but you have avoided a complex NVA solution and configuration.
Note the Azure Firewall has many deployment options, including using the Firewall Manager with Secure Virtual Networks and Hub Virtual Networks, each of which offers different security and deployment options. For further information, see the documentation for Azure Firewall and Azure Firewall Manager (links for both services found below).
Happy routing!
Further Reading:
Authors: @DJBartles / @PatrickHorn
by Scott Muniz | Dec 11, 2020 | Security
This article was originally posted by the FTC. See the original article here.
It’s the 6th day of Consumer Protection, and maybe you’re in a giving spirit. ‘Tis the season, right? If you like to donate to charities at the end of the year, ‘tis also time to make sure your donations get to the places you mean them to go. Because this year, lots of charities could really use the help.
Brought to you by Dr. Ware, Microsoft Office 365 Silver Partner, Charleston SC.
by Contributed | Dec 11, 2020 | Technology
This article is contributed. See the original author and article here.
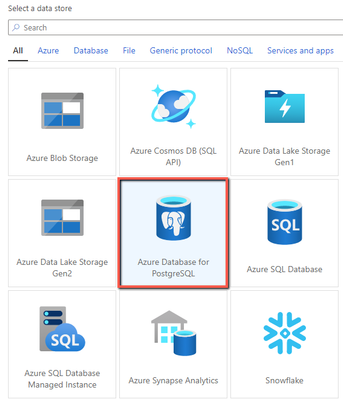
Azure Data Factory has enhanced the Azure Database for PostgreSQL, REST and Excel connectors to fulfill your emerging data integration need:
Azure Database for PostgreSQL in Data Flow
Now you can use Azure Database for PostgreSQL connector in Data Flow to build powerful ETL processes. You can read data directly from Azure Database for PostgreSQL and apply data transformations or join with other data, or post transformation you can perform inserts, updates, deletes, and upserts to publish the analytics result set into Azure Database for PostgreSQL. Learn more about Azure Database for PostgreSQL connector.
REST connector as sink
Generic REST connector is one of the most commonly used connectors in ADF to integrate with various SaaS applications or your own applications. It helps you easily extend and reach a great number of data sources than the built-in ones. Now using copy activity, not only you can use REST connector to retrieve data, ADF newly enables REST connector as sink so you can also write data via REST APIs. Learn more about REST connector.

Excel format – worksheet index
When parsing Excel files using copy activity or data flow, you have a new option to point to a worksheet by index in addition to by name. For example, if you just want to read the only worksheet in your Excel files and ignore its name, you can simply specify index as 0. Learn more about Excel format.

by Contributed | Dec 11, 2020 | Technology
This article is contributed. See the original author and article here.
Scenario:
Let us say, that you are regularly putting data into the storage, be it blob, or table, or queue, or file storage. You are performing read/write operations on the storage account using various applications/tools. Thus, there is regular ingest of data to the storage account and there are applications which are pulling data from the storage account. You want to know what are the transactions done on the storage account or amount of data written/read from the storage account. The easiest way to find any metric values for the storage account, is by referring to the Storage Metrices available on the Portal. It can be used to find what are the transactions done, or what is the egress/ingress values or what is the availability of the storage account.
But, when you specify the required time stamp and service for which you want to see metrices, you are unable to get any data. You are unable to understand whether why there is no metrices seen for the storage account or there are no transactions done on the account.
Let us understand how we can troubleshoot this scenario where we are unable to find the correct metrices for the storage account. There are many causes because of which you are not able to see the correct data in the metrices tab for the storage account. Let us explore the various causes for such issue:
Cause 1: Any monitoring data that you see for a given resource (in this case, storage account), comes from the Resource Provider Microsoft.Insights. If this resource provider is not registered for your subscription, then there is no metrices seen for any resources. To ensure that your subscription is registered with the given resource provider, navigate to Azure Portal -> Go to the subscription settings -> Go to the Resource Provider tab -> Check if Microsoft.Insights is registered. You can refer to the below screenshot:
Alternatively, you can execute a PowerShell command to see if the resource provider is registered or not.
PS script:
Connect-AzAccount
Get-AzResourceProvider -ProviderNamespace Microsoft.Insights
|

If you see that the resource provider is not registered, then you can use the below PowerShell script to register the resource:
PS script:
Connect-AzAccount
Register-AzResourceProvider -ProviderNamespace Microsoft.Insights
|
Alternatively, you can use the Azure Portal to register for the resource provider.
Cause 2: The timestamp specified for the metrices, is greater than 30 days. Please note that metrices values are saved for 93 days, but we can query 30 days’ worth data in a single query. It means that, if you need to query the metrices for past 90 days, you will need to break the timestamp into 3 slabs of 30 days each. If you are seeing blank chart or a same part of the chart is missing, please check that your start and end date is within 30days.

Cause 3: You have ensured that the required resource provider is registered with the Subscription and the timestamp value given to query the data is well with 30 days. But you are still seeing that there is dotted graph in metrices tab. You are seeing graph as below:

The dotted graph is seen when there is no data to present on metrices. Let’s say, you have set granularity to 1min and there is data for 6:30 PM, 6:31 PM, 6:33PM and 6:34PM. Now, as there is no data for 6:32PM, the dotted line is plotted between the data point of 6:31PM and 6:33PM. This dotted line helps us in understanding when there are no data/transactions seen for the storage account. The dashed line value is zero when the metric used is count and sum aggregation. But for the avg, min or max aggregations, the dashed line will connect to the two nearest known data points.
When there is no data to represent on graph, dotted line will be seen.
Please note that this is by design. If you still want to see the “correct data” on the metrices, then you can make use of the scatter chart. The scatter chart will represent metrices for only those time period when data is available. For more details, you can refer to the link.
Cause 4: You are seeing that there is a “Error” message written across the metrices tab. You want to know if there is any issue with the storage account performance or whether the storage account is unavailable. As many critical applications are using the storage account, you want to ensure that there is no performance degradation for the storage account. But, the metrices tab is showing “Error” message and you are unsure of what to do next. In such scenarios, you can collect Fiddler trace while reproducing the issue. Fiddler is 3rd party tool used to capture the traffic and investigate the calls made. You can download the tool from the link.
In the Fiddler trace you can check the call made to the storage metrices and see what the response on it was. If you see that the request is successful, then you can be sure that the storage account is working. Then, we can check if the storage account is emitting the metrices details or not. For the request made to access the storage metrices, in the response tab, you can select “Web View”. If you see that the data is present in it, then the storage account is emitting metrices values. Thus, the issue is not with the Azure Storage Account but with the Portal not able to render the result. Hence, you can reach out to the Azure Portal Team for assistance.

The web view will contain details as such:

If you cannot make use of the Fiddler tool due to company/security restriction, you can collect HAR traces using browser. You can refer to the link for more details on how to capture HAR traces.
Cause 5: You are seeing that “Error” message is seen for the classic metrices.
When you put the storage account in Firewall or do VNet settings on it, you need to ensure that the trusted service is enabled in the firewall settings of the storage account. The classic metrices uses the Insight provider for listing the metrices. If is it is not enabled and the storage account is having VNet or Firewall settings done, then you will see “error” message for the classic metrics.


Cause 6: All the metrices values are saved in the table storage. There is dedicated table for each storage service. These tables consist of the transaction information, minute transaction information and capacity information. The transaction and minute transaction table will contain the information of request and response data. The capacity table will contain details of storage usage data. These table consists for both primary and secondary storage account.
Please note that these tables are not seen under table storage in Portal. You need to access these tables from the Azure Storage Explorer. If you do not find the metrices values in the Portal, you can access these tables to see the value.
Let’s say that you are seeing values in the table storage for the respective service, but the values is not seen in the Portal Metrices. It essentially means that the storage service is emitting the metric values but is not being rendered properly on the Portal. In such a case, you can reach out to the Azure Monitoring team via Support Ticket to see if there is any issue seen at their side.

Recent Comments