
by Contributed | Jan 27, 2021 | Technology
This article is contributed. See the original author and article here.
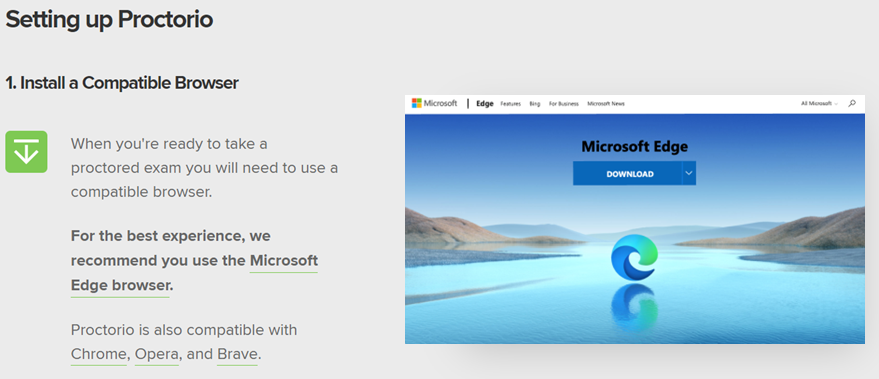
Hello Education IT admins! Today, we are pleased to announce the general availability release of the Proctorio browser extension for Microsoft Edge on Windows 10 PCs. Powered by Microsoft Edge, Windows 10 and Microsoft Azure, Proctorio offers a scalable, online proctoring solution for exam administrators and instructors while keeping the privacy of the test takers (i.e. students) in mind. Trusted by millions of test takers globally each month, the Proctorio Learning Integrity Platform includes ID verification, browser lock-down, automated proctoring, recording and verification settings, faculty controls, and more.

“We are super excited with the partnership between the Microsoft Edge and Windows 10 engineering teams. Since we share the same philosophies on system security and end-user privacy regarding the Windows 10 operating system and the Microsoft Edge browser, we have decided to make Edge the recommended browser choice for Proctorio.”
Mike Olsen, Founder and CEO of Proctorio.
HOW IT WORKS
Proctorio is a cloud-based service that offers a variety of customizable Lock Down, Recording, and Verification settings that allow instructors to lock browsers or record the test taker’s video, audio and screen during an exam attempt. To ensure test-taking integrity, virtual machines and proxy connections will not work with the Proctorio platform. After submission of an exam, Proctorio will alert exam administrators of any potential activities that may have violated exam integrity within the Proctorio Gradebook.
1. Configuring Remote Exams – Exam administrators dictate the combinations of settings needed for their exams. Proctorio offers three set of options:
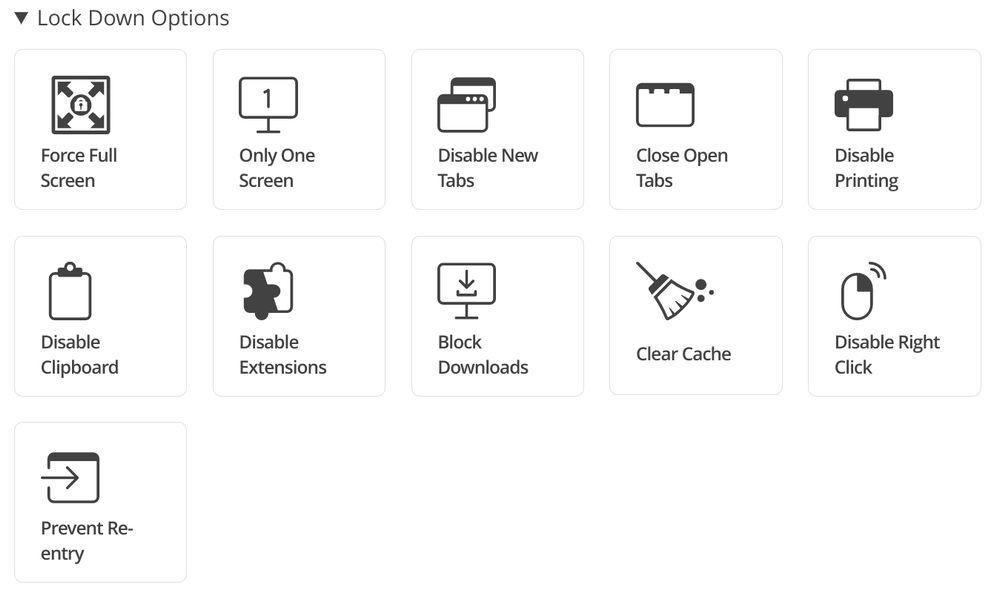
- Lock Down Options: Force Full Screen, Only One Screen, Disable New Tabs, Close Open Tabs, Disable Printing, Disable Clipboard, Disable Extensions, Block Downloads, Clear Cache, Disable Right Click, and Prevent Re-Entry.
- Recording Options: Record Video, Record Audio, Record Screen, Record Web Traffic, and Record Room. Please note that due to Zero-Knowledge Encryption, only authorized school officials can access exam recordings. Proctorio has no access to test-taker recordings collected during the exam.
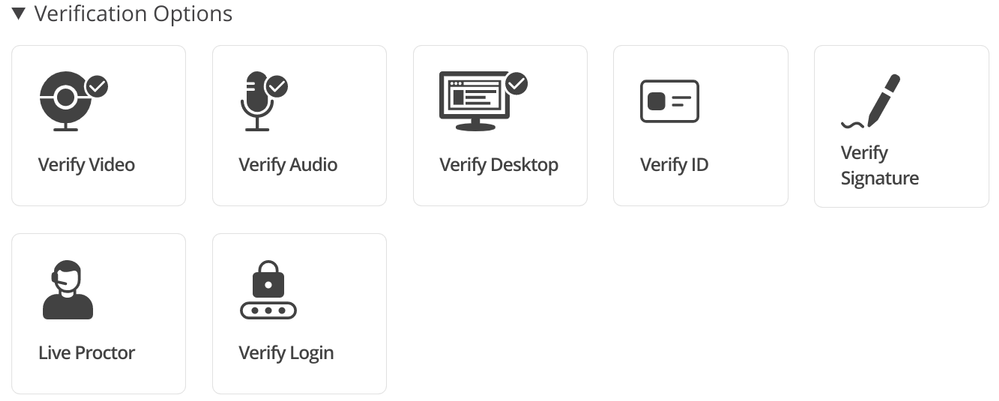
- Verification Options: Verify Video, Verify Audio, Verify Desktop, Verify ID, Verify Signature, and Verify Login.

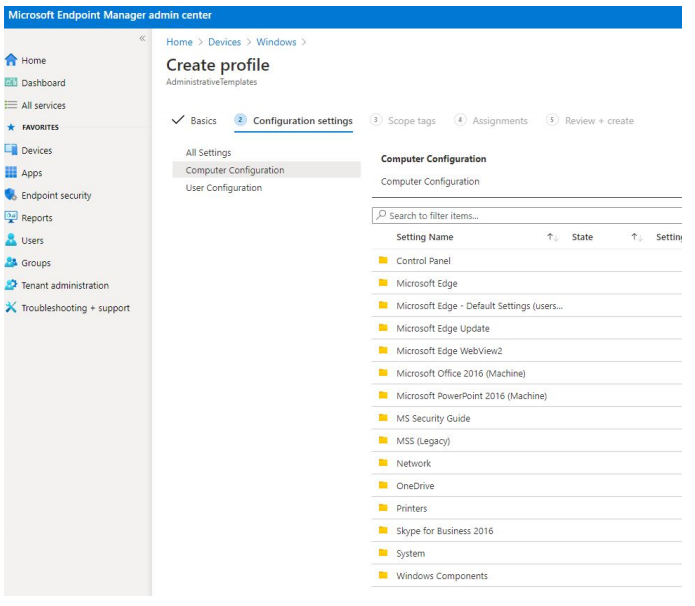
2. Setting up Windows PCs – In order to ensure the students’ Windows 10 PCs are configured correctly, Education IT admins will need to deploy the Proctorio extension with Microsoft Edge browser by using a scalable device management solution such as Microsoft Endpoint Manager. The IT Admin Guide for Proctorio and Microsoft Edge is now available here to help you get started.
3. Taking a Practice Exam – We highly recommend students to use approved Windows 10 PCs with Microsoft Edge to conduct a practice exam. This will ensure the PC environment and connection to the Proctorio service is ready to go.
4. Taking the Test – During the day of the exam, test takers will be asked to bring an institution-approved identification card for the live proctor or the instructor to validate.
NEXT STEPS
As you start planning for the semester/quarter end remote exams, we highly recommend that you proceed with these steps to get started:
1. Visit the Proctorio web site and check out the new Proctorio Extension for Microsoft Edge on Windows 10 PCs. If you are interested, contact their sales team for a demo.
2. Look for helpful blog posts on topics such as Proctorio’s Zero Knowledge Encryption.
3. Start evaluating the latest Microsoft Edge browser for your schoolwide deployment to all of your staff, teachers and students. Download and review theProctorio IT Admin Guide for Microsoft Edge and Windows 10.
4. Check out the latest affordable Windows 10 PCs for schools.
Thank you!
Baldwin Ng
Worldwide Education Apps Lead | Windows Engineering | Microsoft Corporation
by Contributed | Jan 27, 2021 | Technology
This article is contributed. See the original author and article here.
Today, and every Wednesday Data Exposed goes live at 9AM PT on LearnTV. Every 4 weeks (mostly the first week of each month), we’ll do a News Update. We’ll include product updates, videos, blogs, etc. as well as upcoming events and things to look out for. We’ve included an iCal file, so you can add a reminder to tune in live to your calendar. If you missed the episode, you can find it at https://aks.ms/AzureSQLYT along with other videos.
Along with the News Update on Data Exposed Live, you can read this blog to get the guide and links to all the things discussed in the show. Here’s the February 2021 update:
Product updates
Confidential computing using Always Encrypted with secure enclaves went into public preview last week. This expands Always Encrypted by enabling in-place encryption and rich confidential queries, including pattern matching, range comparisons, and sorting. This announcement is available in the new DC-series hardware configuration in preview for Azure SQL Database. Jakub Szymaszek came on the show to explain more and show a demo. You can read more in the blog here.
Also related to security is the topic of Azure Defender for SQL. Over the past month, a few updates and enhancements were made to Azure Defender for SQL in the Azure Security Center:
A great resource which I have recently found is the Release notes for Azure Security Center. Not always related to SQL, but oftentimes relevant in some form or fashion.
Also slightly unrelated but at the same time very much related to Azure SQL was the announcement that Microsoft will establish a new datacenter region in Chile as part of a “Transforma Chile” initiative.
Microsoft recently released a website dedicated to the topic of .NET application migration. Of course, Azure SQL plays a big part here, so you might find the new site and resources interesting.
Alan Yu came on the show to talk about the latest updates to Azure Data Studio including some sneak peeks.
Videos
We continued to release new and exciting Azure SQL videos this month. Here is the list, or you can just see the playlist we created with all the episodes!
- What is aka.ms/sqlworkshops? – Buck Woody
- [MVP Edition] Always Encrypted in SQL Server 2019 – Mladen Prajdic
- Azure SQL Connectivity Performance Tips & Tricks – Silvano Coriani
- Simplify Authentication with Managed Identities for Azure Resources – Silvano Coriani
- How to Troubleshoot Elastic Job in Azure SQL Database – Kate Smith
Blogs
As always, our team is busy writing blogs to share with you all. Blogs contain announcements, tips and tricks, deep dives, and more. Here’s the list I have of SQL-related topics you might want to check out.
- Azure Blog
- SQL Server Tech Community
- Azure SQL Tech Community
- Azure SQL Devs’ Corner
- Azure Database Support (SQL-related posts)
- Microsoft Learn Tech Community
- Chris Testa-O’Neill came on the show to talk to use about Microsoft Azure certification updates. This included the announcement of two new Data & AI related exams, DP-203 and AI-102. For more information, see the Microsoft Learn Blog with all the details.
Upcoming events
As always, there are lots of events coming up this month. Here are a few to put on your calendar and register for:
2/3: Data Exposed Special: The Azure SQL and Azure Data Factory engineering teams are partnering for an all-day learning event where the community can come together to learn about Azure SQL and Azure Data Factory, connect with the experts, and participate in a Hackathon, all across two time zones – America and Asia. Learn more
2/11: Azure Webinar Series: Gain Economic Value Migrating to Azure SQL
2/20: Multicloud4U
SQL Edge to Cloud, Bob Ward
2/27: Scottish Summit
Notebooks 101 for SQL People, Julie Koesmarno
In addition to these upcoming events, here’s the schedule for Data Exposed Live:
2/3: Around the Clock with Azure SQL & Azure Data Factory
2/10: Deep Dive: Best practices assessment for Azure SQL VMs, Managed Instances, and SQL Servers
2/17: Azure SQL Security: The What, Why & How of Securing your Data with Azure SQL
2/24: Something Old, Something New with Buck Woody
Plus find new, on-demand Data Exposed episodes released every Thursday, 9AM PT at aka.ms/DataExposedyt
Featured Microsoft Learn Module
Learn with us! This month I highlighted the Deploy and configure servers, instances, and databases for Azure SQL module. Check it out!
Anna’s pick of the month: SQL Server Virtual Conference by C# Corner
This pick of the month is technically in January, but it’s at the very end and it hasn’t happened yet, so here we are. This is an awesome, community-run event taking place this Friday. When you register, you can buy a ticket (for only $5!) or donate to a charity focused on helping food-insecure children related to COVID 19. I am a big fan of C# Corner already but using this event to help raise money for the kids is special. Additionally, the SQL Server and Azure SQL product group leader, Asad Khan, will be delivering the keynote! Get your tickets here, the event is January 29-30th.
Until next time…
That’s it for now! Be sure to check back next month for the latest updates, and tune into Data Exposed Live every Wednesday at 9AM PST on LearnTV. We also release new episodes on Thursdays at 9AM PST and new #MVPTuesday episodes on the last Tuesday of every month at 9AM PST at aka.ms/DataExposedyt.
Having trouble keeping up? Be sure to follow us on twitter to get the latest updates on everything, @AzureSQL. You can also download the iCal link with a recurring invite!
We hope to see you next time, on Data Exposed!
–Anna and Marisa
by Scott Muniz | Jan 27, 2021 | Security
This article was originally posted by the FTC. See the original article here.
You may know the FTC for its consumer information, and for taking action against shady companies that violate the law. But did you know the FTC returns millions of dollars to people because of those actions? Last year, the FTC's cases returned $483 million to people nationwide and in 64 countries.
Brought to you by Dr. Ware, Microsoft Office 365 Silver Partner, Charleston SC.

by Contributed | Jan 27, 2021 | Dynamics 365, Microsoft 365, Technology
This article is contributed. See the original author and article here.
Today, we published the 2021 release wave 1 plans for Microsoft Dynamics 365 and Microsoft Power Platform, a compilation of new capabilities that are planned to be released between April 2021 and September 2021. This first release wave of the year offers hundreds of new features and enhancements, demonstrating our continued investment to power digital transformation for our customers and partners.
Highlights from Dynamics 365
- Microsoft Dynamics 365 Marketing focuses on deeper personalization to engage customers, more channels to reach customers with the right messages, and analytics to improve results and achieve your business goals.
- Microsoft Dynamics 365 Sales is adding enhancements to save time so sellers can focus on selling, to provide more access to data insights, and to enhance the mobile experience for sellers on-the-go. Look out for updates to automation and sequencing, Conversation Intelligence, and many exciting updates to the mobile app!
- Microsoft Dynamics 365 Customer Service is delivering the all-in-one contact center, now with first-party voice built on Azure Communication Services and intelligent, skill-based, omnichannel routing across channels. In addition, we are enhancing agent productivity capabilities in knowledge management, timeline, email, and agent dashboards.
- Microsoft Dynamics 365 Field Service introduces a comprehensive experience for customers that will allow them to self-schedule service and rate technicians to ensure the maximum satisfaction. These investments matched with enhanced productivity capabilities for technicians through the new knowledge management module will enable the best technician and customer relationship.
- Microsoft Dynamics 365 Finance brings our intelligent cash flow offering to preview with automation based on predictive results. Users will experience out of the box machine learning showing when customers are predicted to pay, forecasting what budget should be, and viewing forecasted cash positions. We continue to expand localizations; this release adds Egypt, extending the number of out-of-the-box countries and regions to 43 and the number of languages to 48. We are also shipping the general availability of Electronic Invoicing Add-on for Dynamics 365the first configurable globalization microservice that extends existing capabilities in Dynamics 365 Finance, Dynamics 365 Supply Chain Management, and Dynamics 365 Project Operations. This will provide better scalability and agility for customers to adapt to changing regulatory requirements.
- Microsoft Dynamics 365 Supply Chain Management provides a unified real-time view across finance, manufacturing, supply chain, warehouse, inventory, and transportation management in one single application for running a business. The cloud asset management software leverages scale units in the cloud to run mission-critical processes without interruption. Advanced predictive analytics and Power Platform tie-ins have allowed us to optimize and automate asset management, IoT, machine telemetry, planning, warehousing, material sourcing, and logistics. Other notable features for this release are in the areas of rebates, inbound landed cost, and global inventory accounting.
- Microsoft Dynamics 365 Project Operations delivers rich new experiences with the ability to forecast, use, and invoice non-stocked materials on projects and enables the ability to setup contractual commitments like billing methods and chargeability rules by task or a work breakdown schedule element. Customers using Dynamics 365 Project Service Automation will be able to upgrade to Dynamics 365 Project Operations when upgrade scripts become available.
- Microsoft Dynamics 365 Guides is focusing on intelligent workflows. By taking further advantage of data captured with Microsoft HoloLens as well as AI innovations, users can get to work and confirm their results faster and simpler than ever.
- Microsoft Dynamics 365 Human Resources continues to broaden the Human Capital Management (HCM) ecosystem through integration APIs and strategic partnerships. The employee experience expands to support additional enhancements for benefits management such as notifications, summary statements, and a consolidated view of employee’s enrollments.
- Microsoft Dynamics 365 Commerce has released new capabilities that are now available in preview to support B2B operational flows for the e-commerce channel. This B2B offering provides our customers with an integrated B2B and B2C e-commerce offering in a single commerce solution with unified merchandising and site management capabilities enabling a wide range of business models across industries and verticals. Also, generally available in this wave are multiple functional and usability enhancements to the existing buy online, pickup in store (BOPIS) processing flows. These new BOPIS enhancements will allow organizations more flexibility to offer their shoppers multiple pick-up delivery options and allows for configuration and selection of pickup timeslots.
- Microsoft Dynamics 365 Fraud Protection adds behavioral and mobile fingerprinting improving the accuracy of fraud management rules.
- Microsoft Dynamics 365 Business Central delivers a set of new features designed to simplify and improve the way our partners administer tenants, and the way administrators manage licensing and permissions. Application enhancements expands the integration with Teams and adds country and regional expansions.
- Microsoft Dynamics 365 Customer Voice expands the capabilities to collect feedback with pre-filled answers, file upload support, drill down question type, and customized survey header. Additional capabilities designed to improve survey response rate includes pause and resume survey to enable users to complete the survey on a different device, automated survey reminders for recipients who have not filled the survey, and over-surveyed management to avoid sending too many surveys to the same person within a given period. Finally, creating a follow up action workflow is made easier with Microsoft Power Automate survey response trigger.
- Microsoft Dynamics 365 Customer Insights audience insights capabilities enables every organization to unify and understand their customer data. Audience Insights added support for on-premises data ingestion including new Power Query connectors, additional controls for AI-based data unification, new first- and third-party enrichments like Experian, new predictive models for transaction churn, and support for new first- and third-party activation destinations like Marketo. The engagement insights capability (preview) in Dynamics 365 Customer Insights enables organizations to interactively understand how their customers are using their products and servicesboth individually and holisticallythrough their website, mobile apps, and connected products touchpoints. Engagement insights expands to multi-channel analytics over data from other channels for richer customer analytics, downstream actions, and optimizations.
Industry accelerators
- Dynamics 365 education accelerator adds a marketing and communications feature which will allow districts and ministries of education to effectively take a proactive communication approach with various stakeholders such as educators, community members, and parents.
- Dynamics 365 media and communications accelerator further expands on the “fan engagement” theme adding additional support for virtual events and health and hygiene at physical venues. This release includes features to aid in registering and participating in virtual sessions and Teams-based events as well as additions for importing content metadata enabling search personalization and other key enhancements.
Highlights from Power Platform
- Microsoft Power BI continues to invest in three key areas that drive a data culture: amazing data experiences, integrations where teams work, and modern enterprise BI.
- Power BI Pro delivers AI infused insights to help everyone easily discover insights. We will also continue to make authoring Power BI content easier than ever through the new Quick Create experiences while continuing to evolve our advanced capabilities like small multiples and composite models. Power BI will further expand the integration with Teams with new experiences in Teams channels, meetings, and chat.
- Power BI Premium continues to deliver features that help organizations accelerate the delivery of insights at scale, meeting the most demanding needs of an enterprise. This release adds flexible licensing models for organizations to choose between per user and per capacity licensing options.
- Power BI Embedded delivers a new generation of the product helping customers increase their ROI, scale rapidly, and get up to 16x faster performance. Customers will also get visibility into utilization at the workspace level, enabling consistent utilization analysis and cost management. In addition, Embedded Generation 2 introduces a lower entry level for paginated reports and AI workloadsstart with an A1 SKU and grow as you need!
- Microsoft Power Apps combines the flexibility of a blank canvas that can connect to any data source with the power of rich forms, views, and dashboards modeled over data in Microsoft Dataverse. This release adds Monitor for end-user app debugging capabilities, printing support (one top ask from our maker community), and mixed reality capabilities for canvas apps. We are also enhancing the global relevance search experience and adding in-app notifications for model-driven apps. Power Apps portals enhances Power BI integration to support Microsoft Azure Analysis Services live connections and enables the ability to send custom data objects, which provide additional context for personalizing reports and dashboards for end users. On the Dataverse for Teams front, we added the ability to share apps with colleagues outside a team and enabled editing of table data in excel.
- Microsoft Power Automate enhances cloud flow integration with other Microsoft products. For example, there is a new trigger when an action is performed in Microsoft Dataverse. This feature improves working with the common events model and provides better integration with Dynamics 365 Finance + Operations. Power Automate Desktop was released to general availability in December 2020, and it enables makers to automate the diversity of applications on their desktops. Going forward, we will provide migration for existing Softomotive and UI flows customers, secure credential management, and much more. Finally, there are improved experiences in Process advisor, a process mining capability in Power Automate that reveals insights into how people work, provides rich visualizations where users can identify repetitive, time-consuming processes best suited for automation.
- Microsoft Power Virtual Agents brings improvements in the authoring experience with topic suggestions from bot sessions, image and video support, and new topic trigger management to improve your bot’s triggering capabilities. For Power Virtual Agents (PVA) bots authored in Teams we are adding the “@mention” capability, and the ability to share your bot with a security group. We are also building on our Power Automate integration with better error handling. Finally, we will acquire PCI and HITRUST certifications and support for the government cloud.
- AI Builder, a Power Platform capability, will introduce new AI functionalities in preview as well as form processing improvements. New capabilities include new region availability and signature detection in form processing in order to detect if a signature is present at a specific location in a document.
For a complete list of new capabilities, check out the Dynamics 365 and Power Platform 2021 release wave 1 plans.
Early access period
Starting February 1, 2021, customers and partners will be able to validate the latest features in a non-production environment. These features include user experience enhancements that will be automatically enabled for users in production environments during April 2021. Take advantage of the early access period, try out the latest updates in a non-production environment, and get ready to roll out updates to your users with confidence. To see the early access features, check out the Dynamics 365 and Power Platform pages. For questions, visit the Early Access FAQ page.
We’ve done this work to help youour partners, customers, and usersdrive the digital transformation of your business on your terms. Get ready and learn more about latest product updates and plans, and share your feedback in the community forum for Dynamics 365 or Power Platform.
The post 2021 release wave 1 plans for Dynamics 365 and Power Platform now available appeared first on Microsoft Dynamics 365 Blog.
Brought to you by Dr. Ware, Microsoft Office 365 Silver Partner, Charleston SC.
by Contributed | Jan 27, 2021 | Technology
This article is contributed. See the original author and article here.
Create Azure Data Explorer Dashboards for IoT Data and Alarm Visualisation
We show how to configure simple but effective Azure Data Explorer (ADX) dashboards on streaming data ingested from Azure IoT Hub with the aim of creating visual indication of alarm conditions (e.g. temperature exceeding a threshold). ADX is a natural destination for IoT data as it provides managed ingestion from IoT Hub and advanced analytics/ad-hoc queries on the ingested data. Recently, the ADX team has added a powerful dashboarding feature that allows the mapping of ADX Kusto Query Language (KQL) queries into dashboards within the ADX Web UI. The native dashboards allow the user to seamlessly export queries from the Web UI, optimise dashboard rendering performance and provides auto refresh capability for near real-time visualisation experience.
The starting point is having an IoT Hub with sensors transmitting data to its device to cloud endpoint. Once data starts flowing into the IoT Hub, start configuring the ingestion into an ADX table and building the dashboards using the typical end to end scenario in the following steps:
- Create an ADX cluster by following the steps here.
- Enable streaming ingestion on the ADX cluster as explained here. Streaming ingestion is a powerful feature in situations where low latency between ingestion and query is needed as is typical for IoT scenarios.
- Create an ADX database by following the steps here.
For the remaining steps use the ADX web interface to run the necessary queries and view the dashboards. Add the ADX cluster to the web interface as explained in the previous link. One of the great features of the ADX Web UI is that it can be hosted by other web portals as an HTML iframe.
- Create a table in ADX to put the ingested data in. In this example a simple message json structure is used with many sensors identified by “sensorName”, where, for example, “sensor1” carries Temperature values:
{
    "sensorName": "sensor1",
    "SensorReading": 21.171
}
The following ADX query creates a table ‘iot_parsed’ with three columns. Note that since the message does not carry a timestamp, the ‘iothub-enqueuedtime’ property, which is generated by the IoT Hub, is used for that purpose:
.create table iot_parsed (Timestamp: datetime, Sensor: string, Value: real)
Add a json ingestion mapping to instruct the ADX cluster to place the message components in the correct table columns:
.create table ['iot_parsed'] ingestion json mapping
'iot_parsed_mapping' '[{"column":"Timestamp","path":"$.iothub-enqueuedtime","datatype":"datetime"},{"column":"Sensor","path":"$.sensorName","datatype":"string"},{"column":"Value","path":"$.SensorReading","datatype":"real"},]'
This link provides more information on ingestion mapping in ADX. The table is now ready to receive data from the IoT Hub.
- Next use the instructions here to connect the IoT Hub to the ADX cluster and start ingesting the data into the staging table.
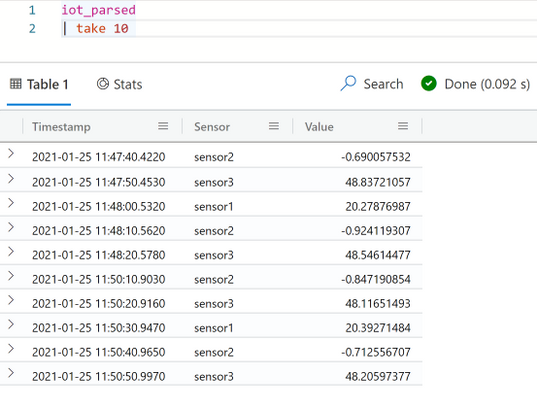
- Once the connection is verified, data will start flowing to the table. Use the following query in the ADX Web UI to examine a data sample of 10 rows:
iot _parsed
| take 10

It is important to note at this point that since a very simple telemetry message structure is used in this example, it is straightforward to create a table with a specific schema to ingest the data directly from the IoT Hub. In scenarios where the message structure is more complex, and probably variable over time, it is good practice to first ingest the data into a staging table with one ‘dynamic’ column. The staging table can then be processed into other tables each of which with a specific schema to serve different analytics use-cases. This processing can be carried out as new data arrives in the staging table using update policies.
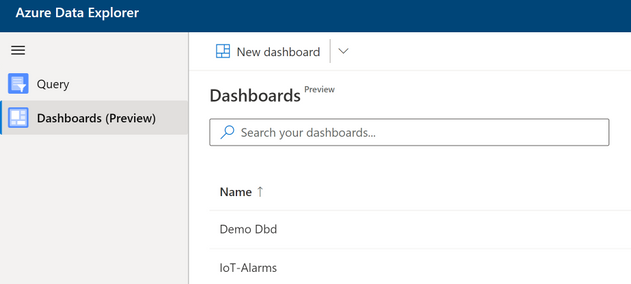
- Now that the data is streamed regularly into the table, start building dashboards to display the data and to indicate alarm conditions in near real-time. The dashboard experience is available in the web UI and can be accessed in the left menu. Select “Dashboards (Preview)” and then select the option to build a new dashboard. Specify the ADX cluster URI and the database to use as a data source for the dashboards.
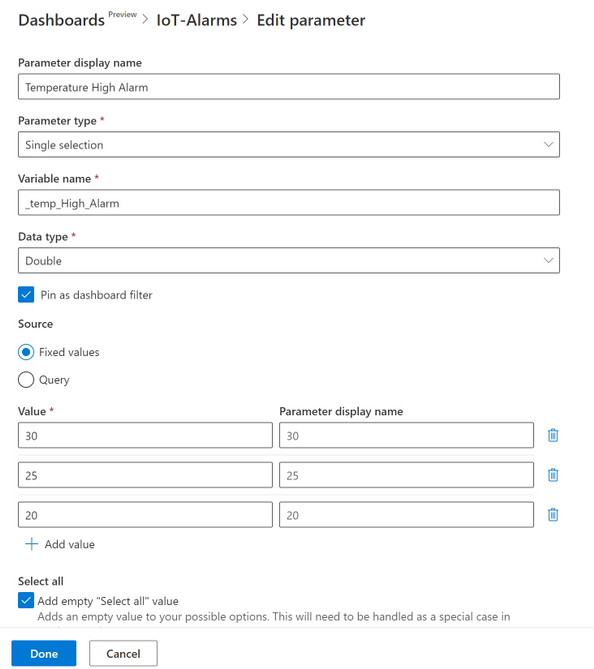
- In order to add flexibility and filtering capabilities to the dashboards, parameters can be configured for use in the visuals. After selecting “Parameters” add two single selection parameters one representing the limit to trigger a high temperature alarm and the other as a limit for triggering a low temperature alarm. Note that by default there are two parameters defined for the start and end of the time period that is used in the time charts. Each parameter in this case can have a number of values from which one value can be selected to use in the dashboards at any time (e.g. to change the alarm threshold at any time without having to re-build the dashboards).
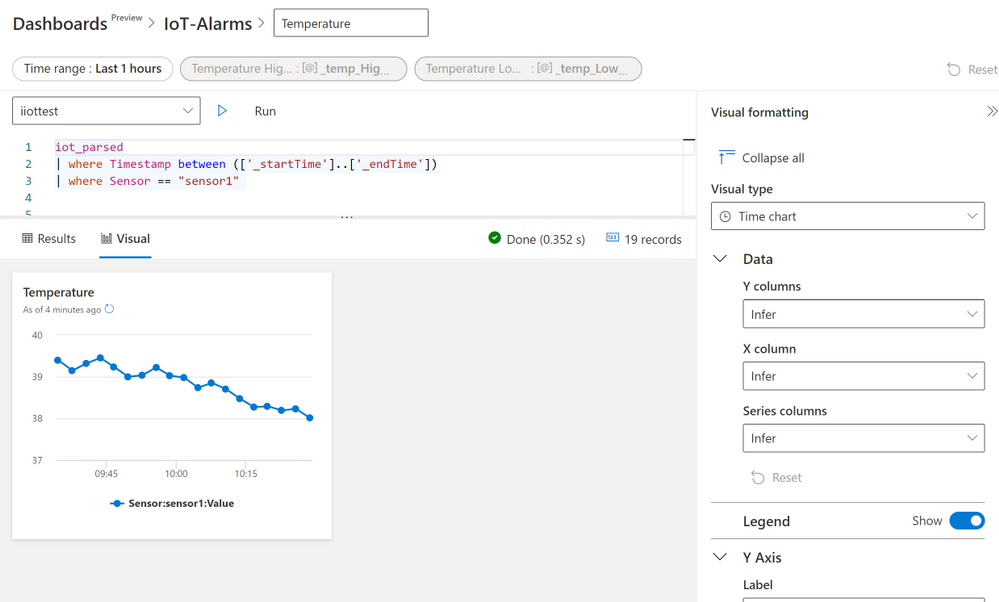
- Add a time chart of the temperature values (sensor1 in this case) between time values represented by the built-in parameters _startTime and _endTime. Use the query:
iot_parsed
| where Timestamp  between (['_startTime'] .. ['_endTime'])
| where Sensor =="sensor1"
On the “Visual formatting” section use the “Time chart” visual type. For the other fields leave the “Infer” option so that ADX can decide the values needed as shown below. Next click “Run” to see the time plot for sensor1. Apply the changes to use the visual in the dashboard.
(Note: inferring the axes parameters for the plot is straightforward in this case as the table has a simple schema. In cases where there is a more complex table structure it is advisable to specify the values by the developer).
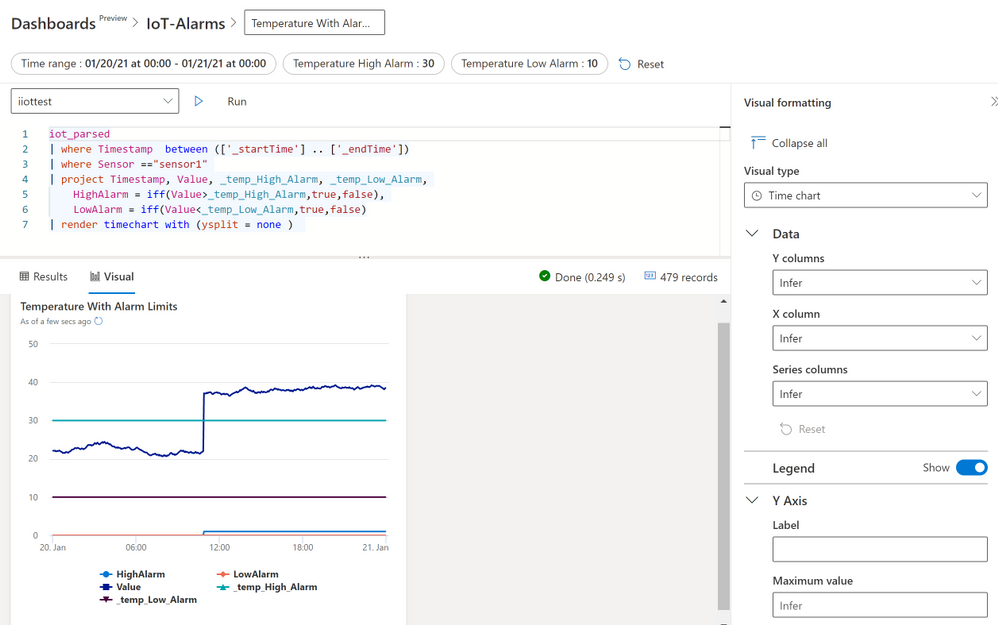
- Extend the time chart of the first visual by adding values from the parameters that represent the alarm thresholds. In addition, add two logic variables (true or false) that would be set by the query if the actual temperature reading is larger than the high threshold or lower than then low threshold. The latter is achieved using the “iff” operator.
iot_parsed
| where Timestamp  between (['_startTime'] .. ['_endTime'])
| where Sensor =="sensor1"
| project Timestamp, Value, _temp_High_Alarm, _temp_Low_Alarm,
    HighAlarm = iff(Value>_temp_High_Alarm,true,false),
    LowAlarm = iff(Value<_temp_Low_Alarm,true,false)
| render timechart with (ysplit = panels)
Examining the resulting charts observe that the “HighAlarm” variable becomes “True” as soon as the temperature goes above the “_temp_High_Alarm” parameter value. By changing the parameter value, alarm thresholds can change immediately and applied in the visual.
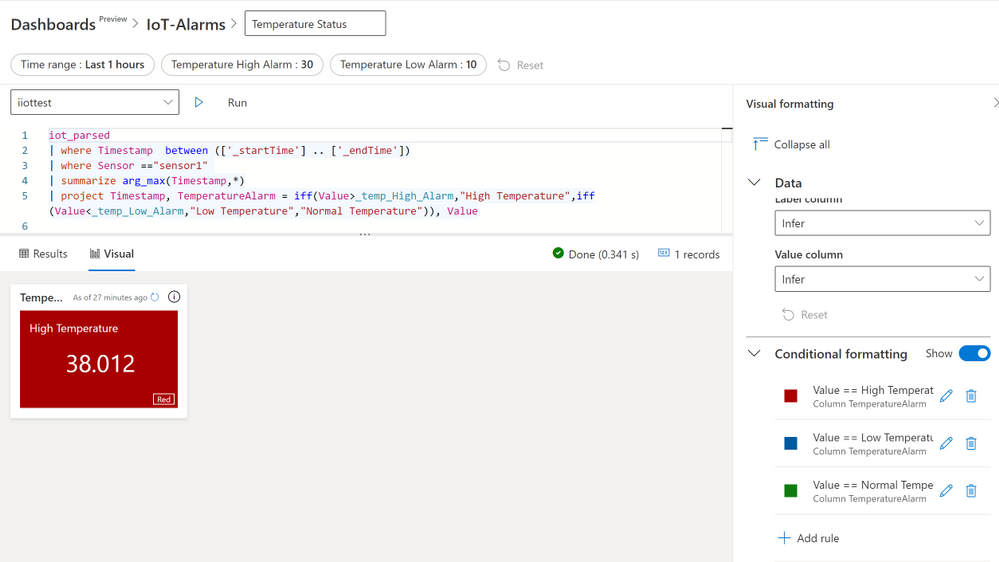
- Finally use the “Conditional Formatting” feature for the “Multi Stat” visual to build a coloured alarm indicator where a panel changes colour according the whether the temperature is above the high threshold, below the low threshold or in the normal region between the two thresholds. The query to use here is:
iot_parsed
| where Timestamp  between (['_startTime'] .. ['_endTime'])
| where Sensor =="sensor1"
| summarize arg_max(Timestamp,*)
| project Timestamp, TemperatureAlarm = iff(Value>_temp_High_Alarm,"High Temperature",iff(Value<_temp_Low_Alarm,"Low Temperature","Normal Temperature")), Value
The above query uses the “summarize arg_max(Timestamp,*)” operation to get the latest temperature value, then a nested “iff” statement is used to set a variable called “TemperatureAlarm” to one of three values (“High Temperature”, “Low Temperature” or “Normal Temperature”). Use the value of “TemperatureAlarm” in the Conditional Formatting rule panel to set the visual colour to red, blue or green as shown below.
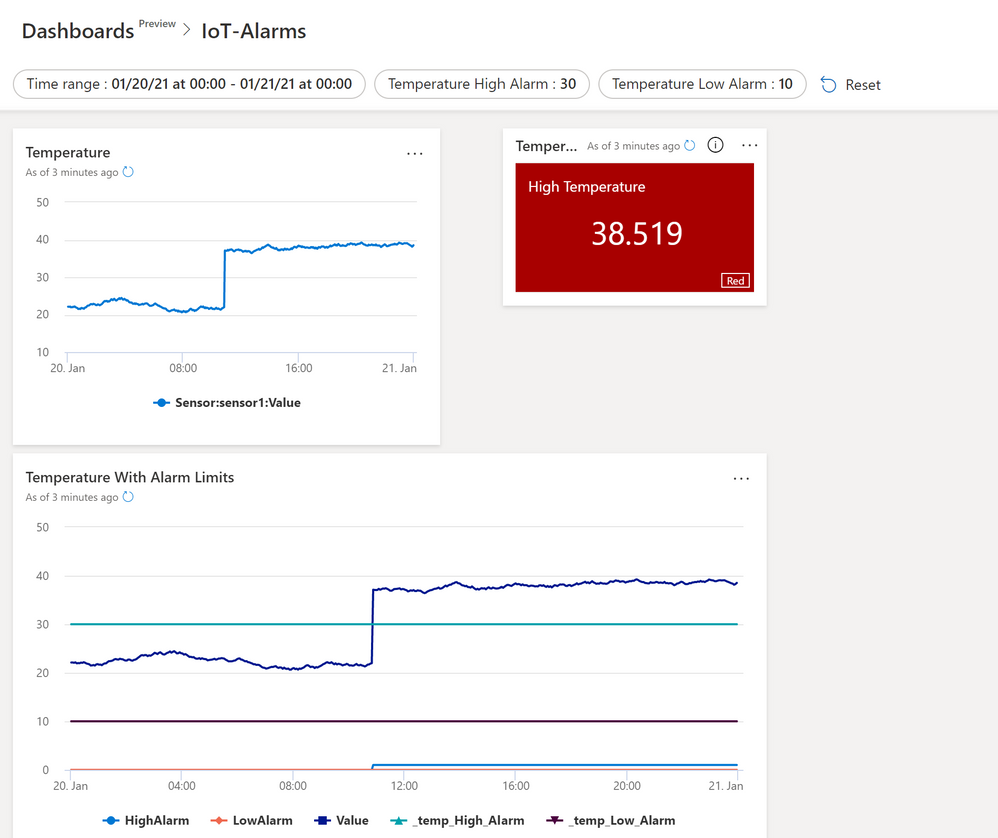
- Below is the final dashboard with all the three visuals together. Set this dashboard to update at regular time interval using the auto refresh feature to achieve a fast and near real time data and alarm display.
- Clean up resources: If the Azure resources used in this example are no further needed then remove the ADX cluster as explained here.
ADX is an excellent destination for IoT data and we have demonstrated one reason for that in building these versatile dashboards. But this is not the end of the story and we highly recommend considering how to combine these dashboards with more advanced features of ADX such as Time Series Analysis and Anomaly Detection. Additionally, we can combine the Azure Industrial IoT platform with ADX to build a truly powerful solution for ingestion, analysing and displaying OPC-UA data from the factory floor. ADX also has powerful integration features that allow us, for example, to extend the alarm detection logic by sending emails or triggering other business processes using other Azure capabilities such as Logic Apps.


Recent Comments