
by Contributed | Jan 25, 2021 | Technology
This article is contributed. See the original author and article here.
Today, we are pleased to share an update on the roll out status of the Windows 10 Team 2020 Update. Our last update that was shared in December can be found here.
With the start of a new year, we continue to hear from our customers that they are navigating hybrid work environments. While some companies around the world have begun their returns to the office, many are still working from home and other remote locations. From higher education to manufacturing, customers are relying on Surface Hub more than ever to stay connected and maintain business continuity. We feel a deep sense of responsibility to support our customers in this time, by providing a quality experience and ongoing transparency.

In this time of increased reliance on Surface Hub we have been laser focused on providing a high-quality rollout of the Windows 10 Team 2020 Update. We are continuously working with customers and partners and actively monitoring the deployment of the Windows 10 Team 2020 update globally.
As we look at the data, combined with the continuous efforts of our engineering teams to resolve known issues, we plan to continue the deployment of Windows 10 Team 2020 as detailed below:
Surface Hub 2S
- Windows Update will be available for the remaining throttled regions in late February 2021.
- Windows Update for Business is currently available globally and will remain available.
- Bare Metal Recovery (BMR) image is currently available for download and will remain available.
Surface Hub (first-generation)
- Windows Update will become available based on throttle regions for both 55” and 84” devices in late February 2021.
- Windows Update for Business will be available globally for both 55” and 84” devices beginning late February 2021.
- Surface Hub Recovery Tool (SHRT) with the Windows 10 Team 2020 image is currently available for download and will remain available.
Quality updates and fixes for known issues are expected to land for all devices during the same timeframe. Windows 10 Team, version 1703 (RS2) will remain supported through March 16, 2021. Please make sure to read the known issues list before updating your devices to Windows 10 Team 2020.

by Contributed | Jan 25, 2021 | Technology
This article is contributed. See the original author and article here.
With an uncompromised goal to provide our customers with the ideal, fast, and smooth user experience, we’re excited to announce the latest significant performance improvements in Excel for the web.
We have addressed and improved several scenarios, including opening workbooks, navigating within a workbook, and other interactions. Check out all the improvements we’ve made below:
Loading – We’ve significantly reduced the time it takes to load a workbook, making it faster for you to start working in Excel for the web.
Scrolling – Scrolling is a fundamental part of working in Excel. Now, even in incredibly complex sheets, scrolling is smooth and fast.
 Scrolling in Excel for the Web
Selection – Even more fundamental than scrolling, is the need to interact with content in your workbook. We have optimized the speed of cell selection, so you’ll experience less lag and a more fluid experience when working in the grid.
 Selection in Excel for the Web
Navigating – We optimized several navigation actions: find/search, Go-To, page-up and page-down are all now faster.
Modifying – We developed faster cell editing and formatting experiences.
Our team is always working on performance improvements and we’re dedicated to improve the user experience for Excel for the web. Your input is vital to help us ensure that we continue to address the areas of improvement that customers like you have communicated through Send us a Smile or Frown. Want to be more involved in the process? Stay connected with us and other Excel enthusiasts in the Excel Tech Community, read and comment on our Excel blog posts, and send us your ideas and suggestions for the next version of Excel through UserVoice. Don’t forget to follow Excel on Facebook and Twitter!
Want to learn more on Excel for the web? Stay informed on recent changes by regularly visiting What’s New in Excel for the web.
Thanks for reading, and for your interest in Excel!
Danielle Rifinski Fainman
Dror Yashar
-Microsoft Excel Team
by Contributed | Jan 25, 2021 | Technology
This article is contributed. See the original author and article here.
By Anusha Ammaluru
This time we bring you a blog article about Cucumber, Selenium and Integration with Azure DevOps, let’s get started and welcome to the journey to learn Cucumber.
The blog post will cover the following topics:
- Cucumber Introduction
- Setup Cucumber with Selenium in Eclipse
- Cucumber Basics
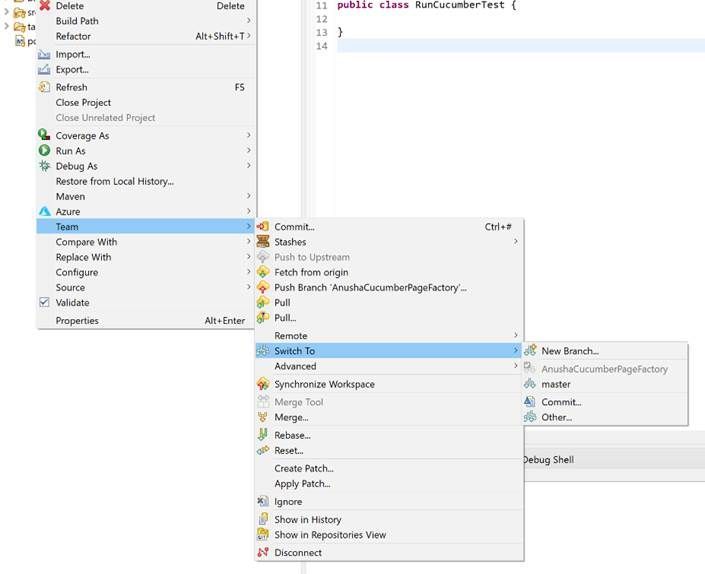
- Eclipse Integration with Azure DevOps
Cucumber Introduction
Cucumber is a tool that supports Behaviour-Driven Development(BDD). It lets us define application behavior in plain meaningful English text using a simple grammar defined by a language called Gherkin. Cucumber itself is written in Ruby, but it can be used to “test” code written in Ruby or other languages.
Cucumber is one of the most powerful tools. It offers us the real communication layer on top of a robust testing framework. The tool can help run automation tests on wide-ranging testing needs from the backend to the frontend. Moreover, Cucumber creates deep connections among members of the testing team, which we hardly found in other testing frameworks.
What is Gherkin? It is a simple, lightweight, and structured language, which uses regular spoken language to describe user requirements and scenarios. Examples of regular spoken language are English, French, and around 30 more languages. Gherkin contains a set of syntax/keywords
Feature: Defines the feature (generally a user story)
Given: Specifies the pre-condition of the test
And: Defines additional conditions of the test
Then: States the post-condition/expected result of the test
Key points to note:
- The test is written in plain English, which is common to all the domains of your project team.
- This test is structured that makes it capable of being read in an automated way. Thereby creating automation tests at the same time while describing the scenario.
Setup Cucumber with Selenium in Eclipse
- Setup java
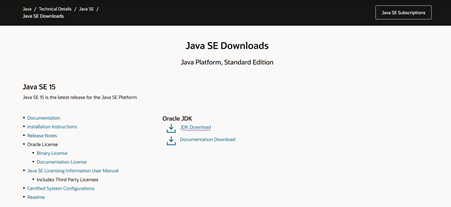
- Download the latest version of Java from https://www.oracle.com/technetwork/java/javase/downloads/index.html

Download .exe file

- Install Java by double-clicking on the .exe file and proceed with default options
- Set up Java Environment Path
- Type Env in the windows search and click on the ‘Environment Variables’ option
- Click on Path in the System variables and click the ‘Edit’ button
- Add folder path where the JDK is installed and click the ‘OK’ button
- Go to Command Prompt and type java -version If you see a screen like below, Java is installed
- Setup Eclipse
- Download Eclipse Photon from https://www.eclipse.org/downloads/packages/release/photon/rc3, if you are going to maintain the repo in Azure DevOps, I had faced issues earlier with other bundles.
- Select Eclipse IDE for Java Developers and Install
- Launch the eclipse and select a workspace folder to save your repo
- Install Cucumber Plugin for Eclipse
- Launch the Eclipse IDE and from the Help menu, click “Install New Software”.
- You will see a dialog window, click the “Add” button.
- Enter the name “Cucumber” and location as “http://cucumber.github.com/cucumber-eclipse/update-site”. Click the ‘OK’ button.
- Check the ‘Cucumber Eclipse Plugin’ and click next to install
- You may or may not encounter a Security warning, but if you do just click the ‘OK’ button.
- Restart Eclipse for the changes to take effect
- Download Cucumber JARS from Maven Repo
- Go to https://search.maven.org.
- Search for cucumber-core in the Central Maven Repository.
- Download jar file
- Similarly, search for all the below libs in the Maven repo and download JAR’s
- Download Selenium
- Download WebDriver Java client from Selenium website
- Extract the files and save it in your local folder
- Configure Eclipse with Cucumber and Selenium WebDriver libs
- Go to Eclipse : File-> New -> Project -> Select Maven
- Click the ‘Next’ button
- Filter Cucumber and select cucumber-archetype
- Enter Group Id and Artifact Id and click the ‘Finish’ button
- Add Selenium Jars
- Right-click on Project ‘CucumberTest > Select Properties > Java build path. Then navigate to the Libraries tab and click Add External JARs.
- Browse to the local folder where the selenium jars are saved and select all the jars and add
- Go to the lib folder and add all the remaining Jars
- Click ok
- Add Cucumber Jars
- Right-click on Project ‘CucumberTest > Select Properties > Java build path. Then navigate to the Libraries tab and click Add External JARs.
- Browse to the local folder where the cucumber jars are saved and select all the jars and add
- Click the ‘Ok’ button
- Now we are all set :smiling_face_with_smiling_eyes:
Cucumber Basics
- Cucumber Feature File
- An entry point to the Cucumber tests. It contains a list of scenarios/test cases written in natural English language using Gherkin keywords
- Create a package in eclipse project -> name it as ‘Features’
- Right-click on the ‘Features’ package and create a file -> name it as ‘DemoTest.feature’
- Add a Feature: Name and description and a scenario underneath like the below example
- Step Definitions
- Add selenium java code in the step definition methods corresponding to feature files.
- Sample code:
@Given(“user is on home page“)
public void user_is_on_home_page() {
driver.get(“https://pul-ai-anu.azurewebsites.net/“);
driver.manage().timeouts().pageLoadTimeout(100, TimeUnit.SECONDS);
}
@When(“I click on login link“)
public void i_click_on_login_link() {
login = new LoginPage(driver);
login.lnk_Login.click();
driver.manage().timeouts().implicitlyWait(20, TimeUnit.SECONDS);
}
@When(“I enter username {string}“)
public void i_enter_username(String email) {
login = new LoginPage(driver);
login.txtbx_UserName.sendKeys(email);
driver.manage().timeouts().implicitlyWait(20, TimeUnit.SECONDS);
}
@@When(“I enter password {string}“
public void i_enter_password(String password) {
login = new LoginPage(driver);
login.txtbx_Password.sendKeys(password);
driver.manage().timeouts().implicitlyWait(20, TimeUnit.SECONDS);
}
@When(“I click on login button“)
public void i_click_on_login_button() {
login = new LoginPage(driver);
login.btn_Login.click();
driver.manage().timeouts().pageLoadTimeout(100, TimeUnit.SECONDS);
}
@Then(“I verify the login is successful“)
public void i_verify_the_login_is_successful() {
login = new LoginPage(driver);
assert(login.lnk_profile.isEnabled());
}
Junit Test Runner Class
package runner;
import io.cucumber.junit.Cucumber;
import io.cucumber.junit.CucumberOptions;
import org.junit.runner.RunWith;
@RunWith(Cucumber.class)
@CucumberOptions(plugin = {“pretty“},
features= “srctestresourcesfeatures” ,
glue= “stepDefinitions“)
public class RunCucumberTest {
}
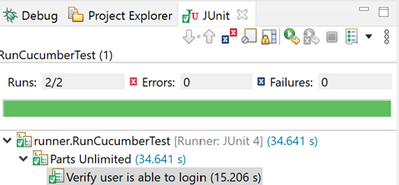
Right-click on TestRunner class and Click Run As > JUnit Test Application
Test Run Report will be shown like this
Eclipse Integration with Azure DevOps
Conclusion
I have created a sample Java Maven project using the Selenium Page factory and Cucumber in GitHub https://github.com/anu-01/CucumberSelenliumPageFactory. This is a great place to get started with a Cucumber-based framework.

by Contributed | Jan 25, 2021 | Technology
This article is contributed. See the original author and article here.

We are pleased to announce, a public community group for leaders, innovators, professionals, and end-users across both industry and government who are interested in Microsoft 365!
The goal of this group is to foster community, share knowledge, and networking around security, collaboration, governance, identity, communication, development, process automation, and much more! Anyone with an interest in government, and digital transformation using Microsoft 365 will want to participate! Please join our MeetUp.com group today for more information, communication, and events. https://aka.ms/m365govmeetup
Join Microsoft US Security CTO @Steve Faehl and Microsoft Cyber security Architect Mark Simos to hear perspectives on supply chain attacks, and how modern cyber security architectures and practices can disrupt the kill chain and reduce risk. Learn applicable remedies to mitigate and reduce exposure from supply chain and other trending threats. Live Q&A to follow.


Recent Comments