
by Contributed | Feb 24, 2021 | Technology
This article is contributed. See the original author and article here.
How to manage SAP IQ License in HA Scenario
This blog is an extension to Deploy SAP IQ-NLS HA Solution using Azure NetApp Files on SUSE Linux Enterprise Server
As part of this blog, we will learn how to manage the SAP IQ license when configured for High-Availability on ANF.
Problem Statement:
The SAP IQ High Availability Architecture on ANF proposes to hosts the SAP IQ database on ANF Volume.
As part of failover, the database filesystem [ANF Volume] moves from Node1 to Node2. The files including the license file on ANF Volume remain static, meaning the license will have Node1 hostname [Old Primary node] when it failovers to Node2 [New Primary node] stopping SAP IQ from start-up on Node2 as part of failover.
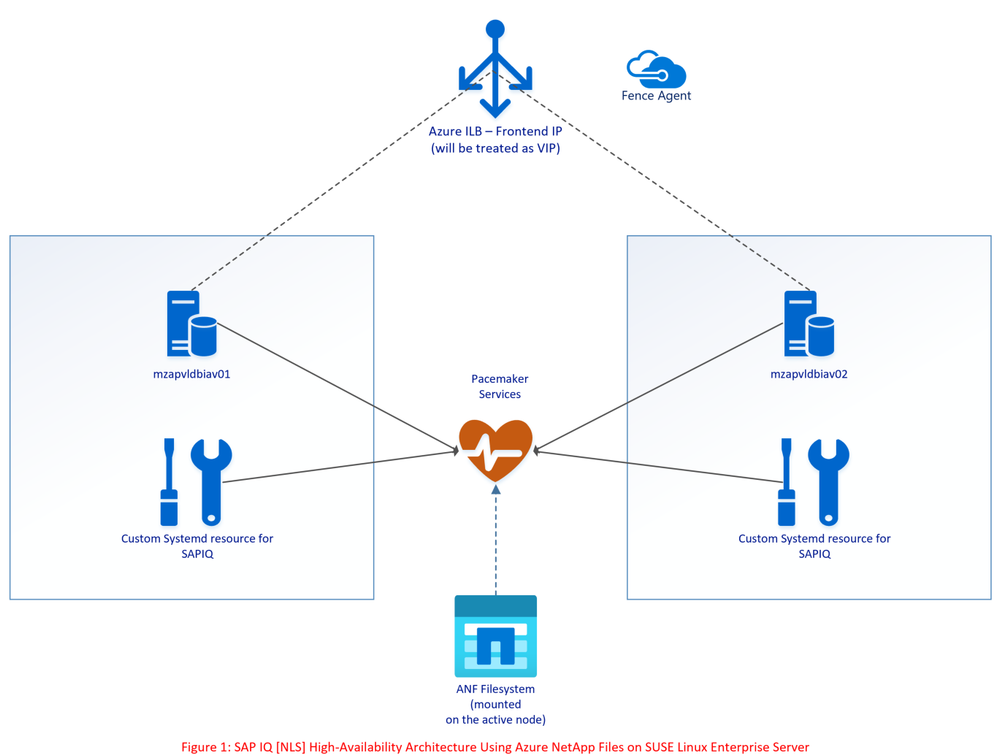
The above architecture points to an update (option) where SBD VM’s can be replaced with Azure Fencing Agent to simplify the architecture.
Solution:
Please refer to SAP Note 2628620, 2376507 to understand further on SAP IQ License generation and options.
Follow the below steps to update the license key for ANF volume
1. Based on the SAP IQ system, generate Production type CP license or non-production type DT for Primary node.
2. Generate Standby license type SF for Secondary node. System type must be Backup system & License Type should be Standby Instance [IB] [On SAP Portal, the selection will be IB].

3. Create two separate .lmp files with below format <hostname1>.lmp
In this LT should be equal to CP (for prod) and DT (for non-prod)

<hostname2>.lmp
In this LT should be equal to SF (for Standby node)

4. Change IQ startup script (sapiq_start.sh) and add below code lines into the script cd <path to database directory
hostnm=`hostname`
if [ -f ./${hostnm}.lmp ]; then
cp ${hostnm}.lmp SAPIQDB_<SID>.lmp fi

5. Start the cluster and execute HA test cases for validation.

by Contributed | Feb 24, 2021 | Technology
This article is contributed. See the original author and article here.
When operating an IoT solution, you have to be able to predict and identify operational malfunction and security issues in your IoT fleet. By using Time Series analysis to surface anomalies on IoT device telemetry data as described below you will be able to enhance your control over your IoT solution.
Using diagnostics logs from the Azure IoT Hub and Sentinel query capabilities, you can create custom ML (Machine Learning) based anomaly detection on your IoT telemetry data. See below the description for various functions used when compiling the Kusto Query Language (KQL) queries and how to use queries to either visualize the output or transform it to tabular data outputs.
In addition to using the information in this article, you can gain a more comprehensive and complete solution for securing and monitoring your IoT solution, by using Azure Defender for IoT. Defender for IoT is built to enhance your security capability for your entire IoT environment. Natively integrated with Azure IoT Hub and Azure Sentinel, Azure Defender for IoT will enrich your environment with unprecedented comprehensive investigation, monitoring and response capabilities.
Practical Time Series Analysis Applications on IoT Device Telemetry
Overview
As part of security monitoring and incident response, analysts often develop several detections based on static thresholds within a specified time interval window. Traditionally these threshold values are identified manually by an historical trend of events and are configured as a static value in the detection.
In addition, even though static thresholds are reached/exceeded slightly, the results are often uninteresting and generate false positives for analysts. As part of triage, analysts improve detections via Allow list creation to reduce the false positive rate.
This approach is not scalable. The good news is that time series analysis-based detections can effectively replace static detections. The results are robust to outliers and perform very well at scale due to vectorized implementation to process thousands of time series in seconds.
A typical Time Series analysis workflow involves the following:
- Select the data source table that contains raw events defined for the scope of the analysis. In this case it’s Device Telemetry.
- Define the field from the schema against which numeric data points will be calculated (such as count of device connection by device id’s).
- using make-series operator which transforms base logs into series of aggregated values of specified data points against time windows.
- Use Time Series functions (e.g., series_decompose_anomalies) to apply decomposition transformation on an input data series and extract anomalous points.
- Joining the anomalous points with other related data that can add context to the anomalies detected. In this case, getting the protocol and masked IP address related to the anomalous data points.
- Plot the output in a time chart by splitting seasonal, trend, and residual components in the data. This will visualize the outliers and help with understanding why these values were flagged.
For the demonstration purposes, we will run it against sample data from a lab and split the query to display various results step-by-step.
Requirements: Export IoT Hub Diagnostic logs into Azure Log Analytics.
Before starting, you need to create a diagnostic setting in the relevant IoT Hub to export its logs to a Log analytics workspace. These logs contain device communication telemetry of the IoT Hub. Based on this data, you can create different detections to locate security and operational issues on the entire IoT device fleet. The relevant logs for the scenario in this article are “Connections” and “Device Telemetry”. To more details on IoT Hub Diagnostic setting, see Set up and use metrics and logs with an Azure IoT hub.
Scenario: Device Telemetry Anomaly by Device ID.
This scenario will detect anomalies across your entire IoT fleet. Each IoT device will be compared to his own telemetry history based an hour time frame aggregation. This detection is suitable for meaningful deviations from the normal telemetry activity and detects trend changes in a specific device and time across the entire IoT fleet. Examples for use cases that can be detected: device down times, device malfunctions, device communication out of hours and configuration changes.
First Query – Transform the original telemetry table to a set of time series:
The first part of the query will prepare the time series data per each “deviceConnect” event by using make-series operator.
let starttime = 29d;
let endtime = 1d;
let timeframe = 1h;
let scorethreshold = 3;
let TimeSeriesData=
AzureDiagnostics
| where TimeGenerated between (startofday(ago(starttime))..startofday(ago(endtime)))
| where ResourceProvider == "MICROSOFT.DEVICES" and ResourceType == "IOTHUBS"
| where Category == "Connections" and OperationName == "deviceConnect"
| extend DeviceId = tostring(parse_json(properties_s).deviceId)
| make-series Total=count() on TimeGenerated from startofday(ago(starttime)) to startofday(ago(endtime)) step timeframe by DeviceId;
TimeSeriesData
Results:
Sample results will look like the results shown below. Total and TimeGenerated columns are vector of multi-value array per telemetry. You can also notice 0 values which are filled by make-series operator for missing values in the Total column.

Second Query – finding anomalous points on a set of time series:
The next part of the query will detect seasonality and trends in your data automatically and will use it to flag spikes as anomalies based on provided parameters. (3 as threshold, -1 to detect auto-seasonality, linefit for trend analysis).
let TimeSeriesAlerts=TimeSeriesData
| extend (anomalies, score, baseline) = series_decompose_anomalies(Total, scorethreshold, -1, 'linefit')
| mv-expand Total to typeof(double), TimeGenerated to typeof(datetime), anomalies to typeof(double),score to typeof(double), baseline to typeof(long)
| project TimeGenerated, Total, baseline, anomalies, score, DeviceId;
TimeSeriesAlerts
| where anomalies != 0
Results:
Sample results will look like the results shown below. The total column indicates the actual count observed in that hour and the baseline count indicates the expected count in that hour. Note that since the timestamps are aggregated per hour, timestamp will show only round hours. The results shown are the anomalies detected.

Third Query – Enriching data on the anomalous points:
The next part of the query will correlate the results of the anomalies with base data to populate additional fields. This provides additional context to determine if the anomaly detected is malicious or not.
TimeSeriesAlerts
| where anomalies != 0
| join (
      AzureDiagnostics | where OperationName contains "deviceConnect"
      | extend DeviceId = strcat(parse_json(properties_s)["deviceId"])
| extend RemoteAddress = strcat(parse_json(properties_s)["maskedIpAddress"])
| extend protocol = strcat(parse_json(properties_s)["protocol"])
  | where TimeGenerated between (startofday(ago(starttime))..startofday(ago(endtime)))
  | extend DateHour = bin(TimeGenerated, 1h)
  | summarize TimeGeneratedMax = arg_max(TimeGenerated, *), RemoteIPlist = make_set(RemoteAddress, 100), ProtocolList = make_set(protocol, 100) by DeviceId, TimeGeneratedHour= bin(TimeGenerated, 1h)
  ) on   DeviceId, $left.TimeGenerated == $right.TimeGeneratedHour
  | project DeviceId, RemoteIPlist, ProtocolList, TimeGeneratedMax, TimeGenerated, Total, baseline, anomalies , score
Results:
Sample results will look like the results shown below, with IP address, port and protocol details seen in the respective hour. The screenshot below is filtered to interesting events for demo purposes.

Fourth Query – Visualizing time series data:
This part of the query will further investigate the results of the anomalies on a specific device. You can use chart rendering options to visualize the telemetry data over time. You can use different Y – axis values, to understand what normal and abnormal behavior is.
TimeSeriesAlerts
| where DeviceId == "specific device"
| render timechart
Results:
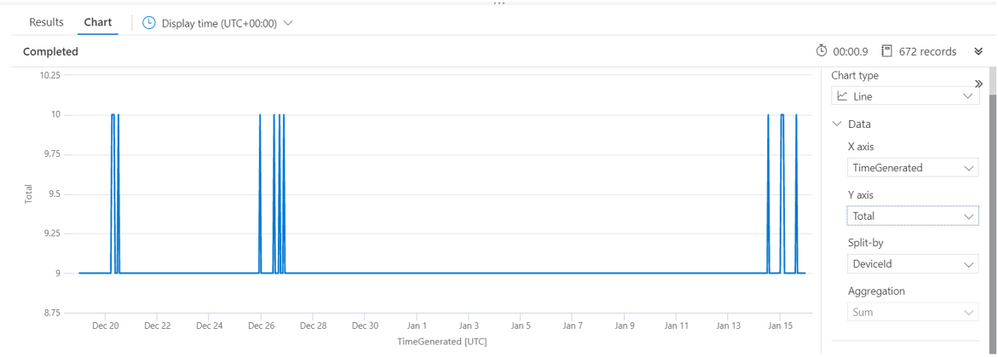
Sample results will look like the results shown below. The chart renders the device trend and seasonality of IoT device communication with the IoT Hub and can shed light on why the algorithm decided to mark certain timeframes as anomalies. In this example, you can see very clearly what the anomalies in this device communication are.
Creating an Analytic rule on Azure Sentinel:
When finding the detection that suits your needs, you can create a custom analytic rule on Azure Sentinel based on the same detection. Using the scheduled query rule feature, create a detection that will run every day and look for anomalies from last 24 hours on top of your IoT device telemetry data.
Conclusion
Time series analysis is an effective technique for understanding various time-based patterns in your data. Applying time series analysis technique on various telemetry data provides unique capability compared to traditional detection mechanisms which are atomic or static in nature. Together with Azure Sentinel, this detection can become an integrated part of your IoT security solution.
In this article, we investigated practical example where we analyzed different series of IoT device telemetry data across a fleet of IoT assets.
To explore more on security features on the IoT platform, Join IoT Security community.
References:
by Contributed | Feb 24, 2021 | Technology
This article is contributed. See the original author and article here.
Azure Firewall Premium is now in Public Preview and offers many new and powerful capabilities that can be used in your Windows Virtual Desktop environment. Several of these capabilities are Intrusion Detection and Prevention System (IDPS) and Web Categories. You can learn more about these capabilities and how they protect Windows Virtual Desktop environments plus some sample application and network rules and their anatomy in this post.
Assets created in this article can be found here:
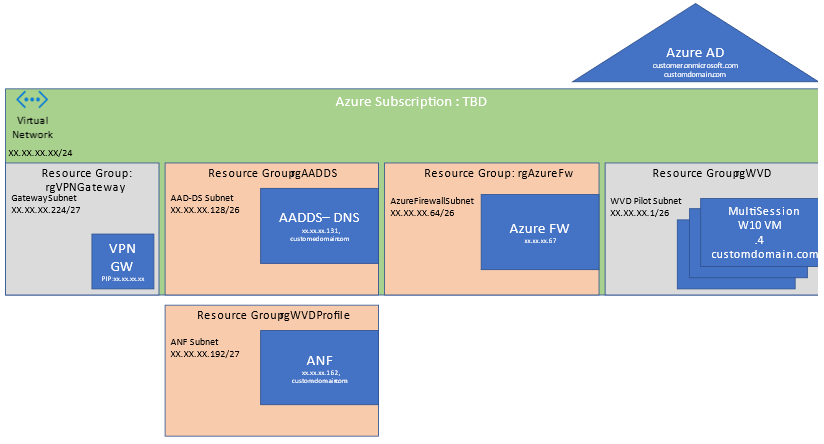
If you would like to test along check out the instructions on how to deploy Azure Firewall premium. Be sure to take in consideration the WVD Virtual network and that there is dedicated subnet for Azure Firewall. The minimum IP address space in CIDR notation needed is /26 for the dedicated Azure Firewall subnet. The subnet must also be named AzureFirewallSubnet .Below is a sample template I use in pilots using a single Virtual Network with multiple subnets and segmentation for Windows Virtual Desktop.

After Azure Firewall Premium is deployed be sure to create a User Defined Route by creating a Route Table in Azure
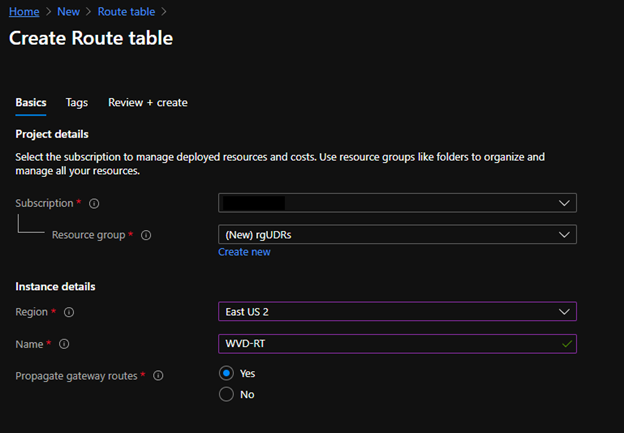
Once created go to the route table and add a route.
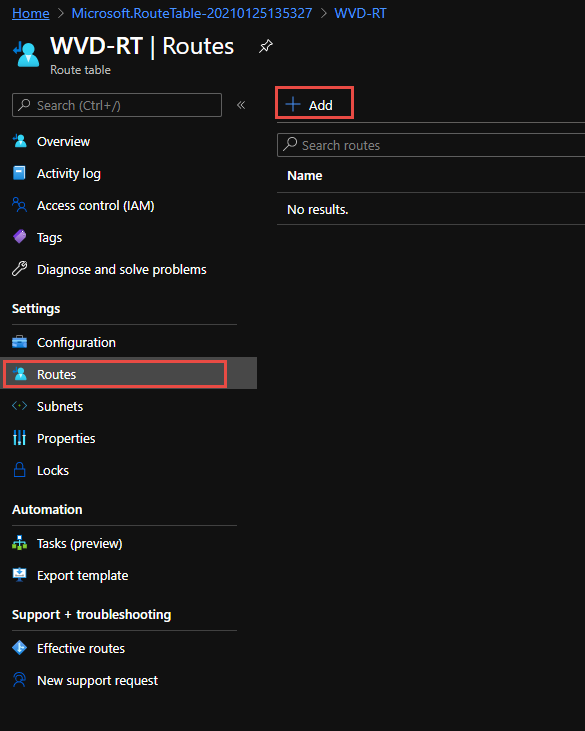
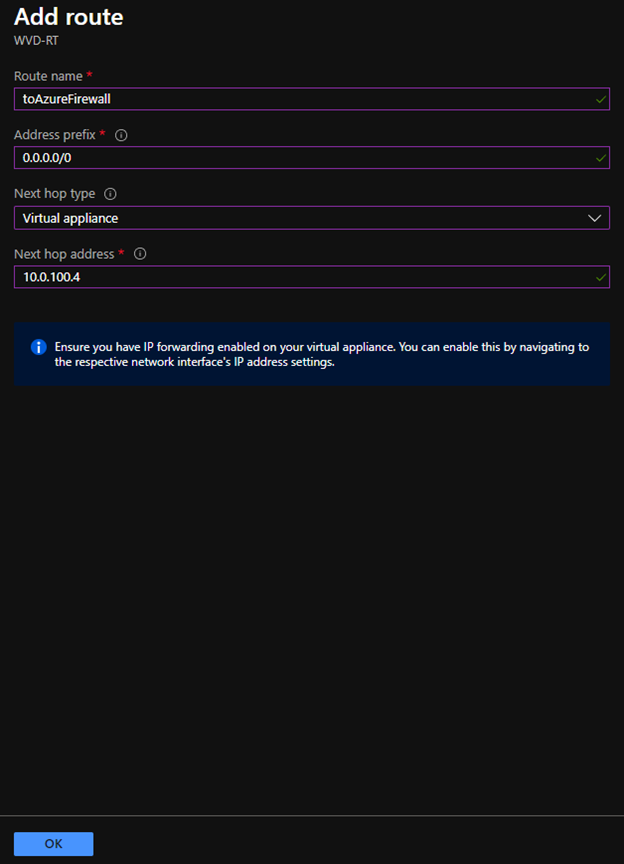
When adding the route you can in testing add a quad zero route of 0.0.0.0/0 which will steer all public traffic public to a next hop address of the Azure Firewall Premium private IP address.
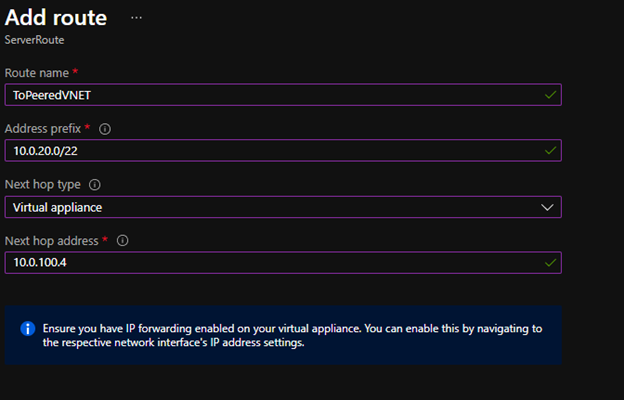
If you have additional VNETs or Subnets for testing, add more granular routes xx.xx.xx.xx/yy to each Azure private IP address space that needs to pass to the Azure Firewall, be sure to include next hop address of the Azure Firewall Premium private IP address.
Once added we can associate the route to the Windows Virtual Desktop subnet. Once associated the traffic will flow to Azure Firewall Premium as next hop.

Intrusion Detection and Prevention System (IDPS)
Azure Firewall Premium now brings Intrusion Detection and Prevention System (IDPS) to your virtual network and Windows Virtual Desktop Host Pool internet bound communications. Under the hood is an abstracted Suricata engine and the signatures fed by powerful third party watchlists. IDPS is a great feature to use as you may allow some openness to your Internet bound traffic within Windows Virtual Desktop. As employees surf the web or execute programs, IDPS can scan each network connection against its rules and then Audit or Audit and Deny traffic based on signature matches.
To turn on this feature with Azure Firewall policy applied to it, you will find a new blade for IDPS (preview). Please note this will only work for Azure Firewall premium. In addition, be sure to review configuring your Azure Firewall policies to use KeyVault and certificates to do TLS inspection, this will greatly enhance IDPS.
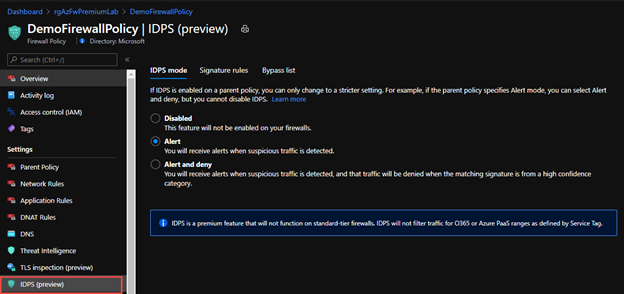
Once turned on you will want to send the Azure Firewall Diagnostic traffic to Log Analytics or your SIEM of choice. This is because it will help record the Signatures discovered that were audited or denied in IDPS so you can use Signature Rules.
You can set this up by going to the Azure Firewall resource and to the Diagnostic Settings blade and Add Diagnostic Settings.
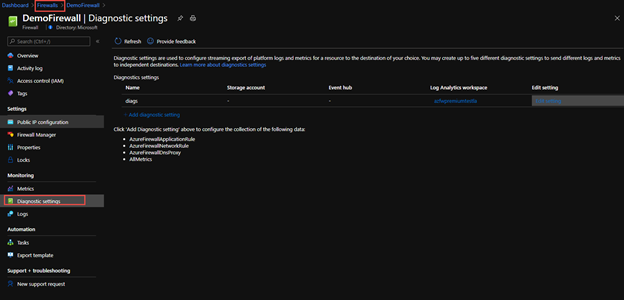
Then define and send the logs to Log Analytics workspace
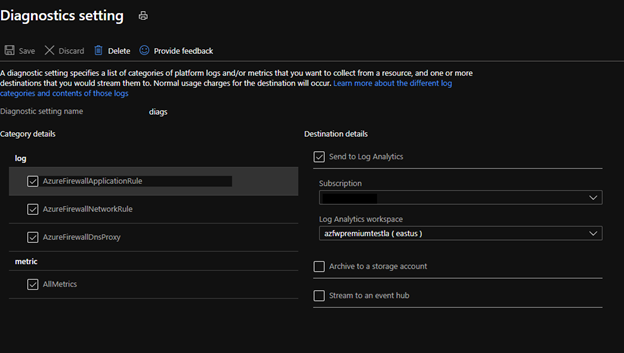
Within Log Analytics you can use the following Query to look at the traffic that was alerted or alerted and denied on with IDPS, including the signature in the event you need to tweak the Signature to allow or deny.
AzureDiagnostics
| where TimeGenerated >= ago(90d)
| where Category == "AzureFirewallNetworkRule"
| where OperationName == "AzureFirewallIDSLog"
| parse msg_s with * "TCP request from " Source " to " Destination ". Action: " ActionTaken ". Rule: " IDPSSig ". IDS: " IDSMessage ". Priority: " Priority ". Classification: " Classification
| project TimeGenerated, Source, Destination, ActionTaken, IDPSSig, IDSMessage, Priority, Classification
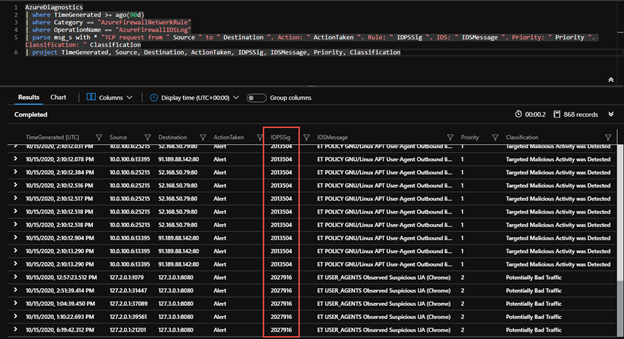
Once you have a signature, you can use this in Azure Firewall polies and IDPS (Preview) blade further to help with over riding the default mode you set IDPS on earlier via the signatures. This can help with false positives if Deny is default for IDPS mode or for adding to blocklists you generate in a permissive Alert Only IDPS mode
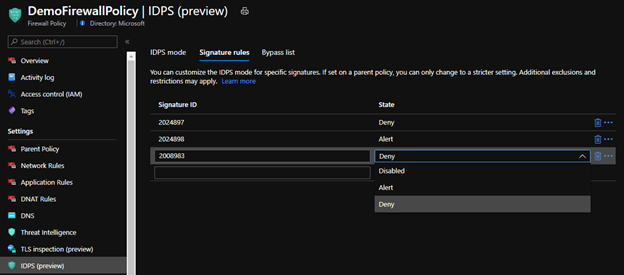
Finally if you need certain WVD Host Pool Members or other Components of the architecture to bypass IDPS all together you can set this within the Bypass list. You may have a WVD Host Pool that includes a legacy application that does not have methods of supporting certificates from the Azure Firewall. Most modern applications and web browsers support this but if you do encounter one you can use this bypass list. The Bypass list allows a 5 tuple network rule configuration. Once configured the servers originating traffic will no longer pass through IDPS.

Web Categories
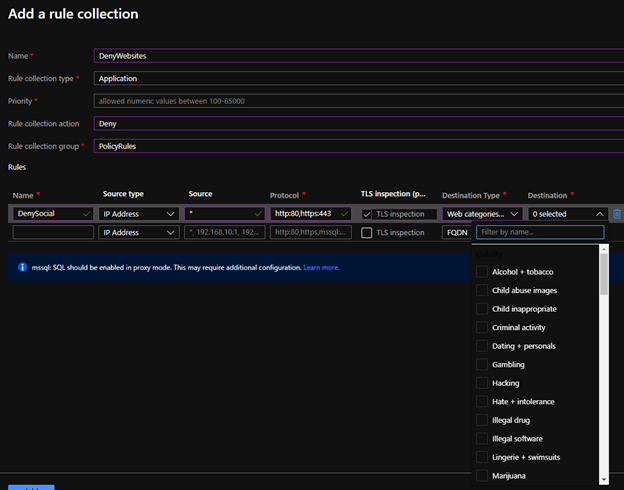
Another approach is to use web categories to deny or allow traffic based on website characteristics like social media sites or gambling websites as an example. There are 64 web categories across differing classifications for selection. This is certainly appealing to block or allow web content to your employees utilizing their Windows 10 interface to the Internet through Windows Virtual Desktop. Below is an example of creating a rule collection and using web categories to deny traffic from Windows Virtual Desktop host pools. An even interesting feature is if you were to block News for instance under Azure Firewall premium a URL like www.google.com/news would be blocked under the web category so it extends beyond the FQDN and into the URL path.

{
    "ruleType": "ApplicationRule",
    "name": "AllowNews",
    "protocols": [
        {
            "protocolType": "Https",
            "port": 443
        }
    ],
    "webCategories": [
        "business",
        "webbasedemail"
    ],
    "sourceAddresses": [
         "*"
    ],
    "terminateTLS": true
}
Anatomy of a Firewall Rule Collection
When using Azure Firewall to protect your Windows Virtual Desktop host pools, there are special rules that have to be implemented beyond the Windows Virtual Desktop tag to allow for the host pools to communicate properly with the Host Traffic. The needed WVD rules are outlined here but you can use the rules as an example to walkthrough the anatomy of Azure Firewall rule as code.
One of the capabilities of Azure Firewall is configuration as code, in particular ARM Template code in Declarative JSON. As an example you will walk through the firewall rule as code.
You will need a couple rule collections to allow traffic for the Windows Virtual Desktop host pools to communicate outbound to the management plane. A rule collection code is very simple, it allows you to define a collection of rules for the Azure Firewall, the priority they will take, the action of allowing or denying traffic in those rules and the rules themselves. An example below.
{
    "name": "AllowAdditionalWVDApp",
    "priority": 203,
    "ruleCollectionType": "FirewallPolicyFilterRuleCollection",
    "action": {
        "type": "Allow"
    },
    "rules": []
}
In the next section you will want to define those rules that fit within the collection.

According to the Azure documentation you will use an Application rule and a FQDN tag. The following rule code fits into the rule collection code “rules”: […]
{
    "ruleType": "ApplicationRule",
    "name": "AllowWVDTag",
    "protocols":[
        {
            "protocolType":"Https",
            "port":443
        },
    ],
    "fqdnTags": [
        "WindowsVirtualDesktop"
    ],
    "targetFqdns": [],
    "sourceAddresses":[
        "XX.XX.XX.XX/YY"
    ],
    "sourceIpGroups": [],
    "terminateTLS":false
},
“sourceAddress”: [ xx.xx.xx.xx/yy ] is the Network CIDR range of the subnet where your Azure Virtual Desktop host pools are located in.
This rule will allow HTTPS traffic from the Windows Virtual Desktop host pool VMs to communicate with the management plane of WVD via the Tag.
You need to add some additional rules as well into the rule collection set, these allow the Windows Virtual Desktop host pool VMs to communicate with the data plane of WVD.

According to the documentation, the data plane of the WVD can be unique per instance. The first example may be a bit too wide open for your security posture and risk. In order to have more restrictive rules that are granular to only allow specific access to the data plane of WVD; the documentation provides you with a KQL query you can run against the Azure Firewall’s diagnostic logs.
AzureDiagnostics
| where Category == "AzureFirewallApplicationRule"
| search "Deny"
| search "gsm*eh.servicebus.windows.net" or "gsm*xt.blob.core.windows.net" or "gsm*xt.table.core.windows.net"
| parse msg_s with Protocol " request from " SourceIP ":" SourcePort:int " to " FQDN ":" *
| project TimeGenerated,Protocol,FQDN
Another method to find these specific FQDNs of the WVD data layer can also be found on the Host Pool VM themselves in the Event Viewer. Many thanks to Eric Moore who discovered this technique. This can be useful if you are putting in an Azure Firewall into an existing WVD host pool to prevent interruption.
On the WVD Host Pool VM Open Event Viewer, go to Windows Logs and Application
Filter on Source: WVD-Agent and Event ID: 3701
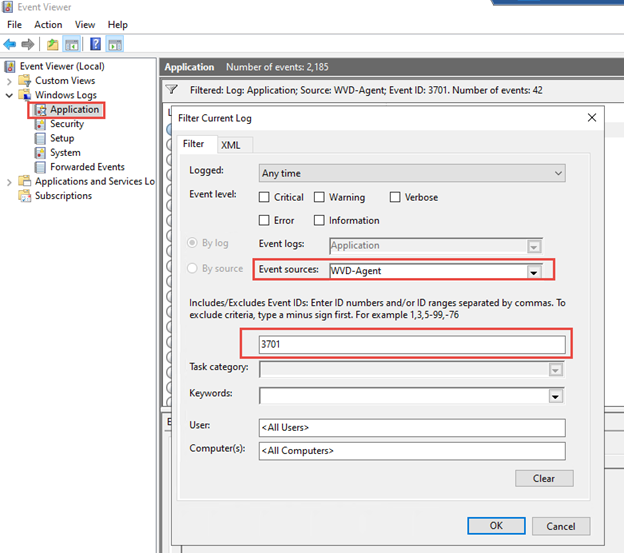
Scroll through the events until you come across one that exposes a larger list more then 4 FQDNs
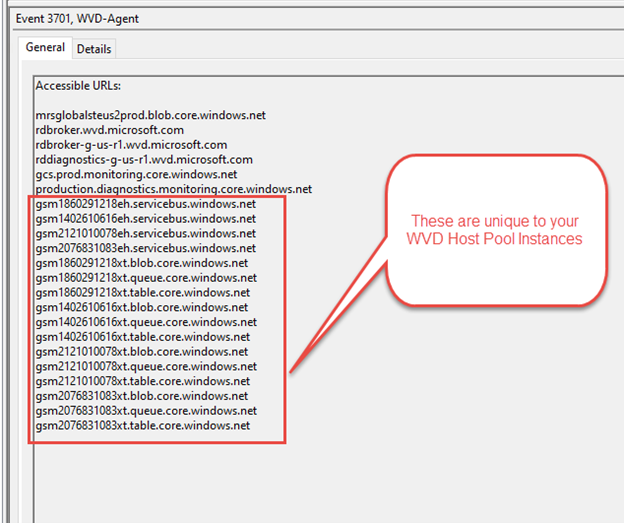
Now that you have obtained the FQDNs unique to your WVD instances you can create additional Application Rules to allow the Windows Virtual Desktop host pools to communicate on the data access layer. The WVD Data access layer consists of unique Azure Service Bus, Storage Accounts blobs, tables, and queues.
{
    "ruleType": "ApplicationRule",
    "name": "AllowWVDServicebus",
    "protocols":[
        {
            "protocolType":"Https",
            "port":443
        }
    ],
    "targetUrls":[
        "gsm1860291218eh.servicebus.windows.net/*",
        "gsm1402610616eh.servicebus.windows.net/*",
        "gsm2121010078eh.servicebus.windows.net/*",
        "gsm2076831083eh.servicebus.windows.net/*"
    ],
    "sourceAddresses":[
        "XX.XX.XX.XX/YY"
    ],
    "terminateTLS":true
},
{
    "ruleType": "ApplicationRule",
    "name": "AllowWVDBlob",
    "protocols":[
        {
            "protocolType":"Https",
            "port":443
        }
    ],
    "targetUrls":[
        "gsm1860291218xt.blob.core.windows.net/*",
        "gsm1402610616xt.blob.core.windows.net/*,",
        "gsm2121010078xt.blob.core.windows.net/*",
        "gsm2076831083xt.blob.core.windows.net/*"
    ],
    "sourceAddresses":[
        "XX.XX.XX.XX/YY"
    ],
    "terminateTLS":true
},
{
    "ruleType": "ApplicationRule",
    "name": "AllowWVDTable",
    "protocols":[
        {
            "protocolType":"Https",
            "port":443
        }
    ],
    "targetUrls":[
        "gsm1860291218xt.table.core.windows.net/*",
        "gsm1402610616xt.table.core.windows.net/*",
        "gsm2121010078xt.table.core.windows.net/*",
        "gsm2076831083xt.table.core.windows.net/*"
    ],
    "sourceAddresses":[
        "XX.XX.XX.XX/YY"
    ],
    "terminateTLS":true
},
{
    "ruleType": "ApplicationRule",
    "name": "AllowWVDQueue",
    "protocols":[
        {
            "protocolType":"Https",
            "port":443
        }
    ],
    "targetUrls":[
        "gsm1860291218xt.queue.core.windows.net/*",
        "gsm1402610616xt.queue.core.windows.net/*",
        "gsm2121010078xt.queue.core.windows.net/*",
        "gsm2076831083xt.queue.core.windows.net/*"
    ],
    "sourceAddresses":[
        "XX.XX.XX.XX/YY"
    ],
    "terminateTLS":true
},
“sourceAddress”: [ xx.xx.xx.xx/yy ] is the Network CIDR rage of the subnet where your Azure Virtual Desktop host pools are located in.
This rule will allow HTTPS traffic from the Windows Virtual Desktop host pool VMs to communicate with the unique data plane of WVD.
Be sure to review configuring your Azure Firewall policies to use KeyVault and certificates to do TLS inspection, this will allow the use of the URL / within the application rules.
The rules above are reflected in the Azure Portal within the Firewall Policy under Application Rules

You will now create a new rule collection set for the Network based rules to allow certain traffic from the Windows Virtual Desktop host pools.
{
    "name": "AllowAdditionalWVDNetwork",
    "priority": 103,
    "ruleCollectionType": "FirewallPolicyFilterRuleCollection",
    "action": {
        "type": "Allow"
    },
    "rules": [...]
}
Azure documentation states the following for Network based rules

Those rules will look like the following in code between the rule collection code “rules”: […]
{
    "ruleType": "NetworkRule",
    "name": "AllowADDNS",
    "ipProtocols": [
        "TCP",
        "UDP"
    ],
    "sourceAddresses": [
        "XX.XX.XX.XX/YY"
    ],
    "destinationAddresses": [
        "ZZ.ZZ.ZZ.ZZ"
    ],
    "sourceIpGroups": [],
    "destinationIpGroups": [],
    "destinationFqdns": [],
    "destinationPorts": [
        "53"
    ]
},
“sourceAddress”: [ xx.xx.xx.xx/yy ] is the Network CIDR range of the subnet where your Azure Virtual Desktop host pools are located in.
This first network rule in the ruleset Allows the WVD Host Pools to communicate TCP 53 with Local AD DNS servers. ZZ.ZZ.ZZ.ZZ is the AD DNS Server(s). Note if you are restrictive in the communication between Host Pool and Active Directory Domain Services subnet, you may want to also open additional ports outlined here for Active Directory.
An example of the next rule is below
{
    "ruleType": "NetworkRule",
    "name": "AllowAzureKMS",
    "ipProtocols": [
        "TCP"
    ],
    "sourceAddresses": [
        "XX.XX.XX.XX/YY"
    ],
    "destinationAddresses": [],
    "sourceIpGroups": [],
    "destinationIpGroups": [],
    "destinationFqdns": [
        "kms.core.windows.net"
    ],
    "destinationPorts": [
        "1688"
    ]
},
The second network rule is allowing the WVD Host Pools to communicate with the Azure KMS service. What is interesting here is the use of a FQDN in a Network Rule rather than an IP address for destination. A couple months back Azure Firewall introduced this capability which allows the Azure Firewall to Leverage Azure DNS or a Custom DNS to lookup answers for the network rule. This can simplify a lot of rules now since many Azure services or Microsoft Services or 3rd party cloud services have a FQDN service that’s IP addresses can change from time to time.
If you are using a Network rule like this with FQDN, please take note you need to update the Azure Firewall to utilize FQDNs in network rules, the following article goes into more detail.
The ARM template and Infrastructure as code looks like this under the resource Microsoft.Network/firewallPolicies
"properties": {
	"threatIntelMode": "Alert",
	"dnsSettings": {
		"servers": []
	},
	"transportSecurity": {
		"certificateAuthority": {
			"name": "cacert"
		}
	}
}
In the Azure portal if you go to the Azure Firewall policy and under Setting > DNS the equivalent configuration.

A final network rule will allow the WVD host pool communicate with NTP servers using the FQDN as a destination.
{
    "ruleType": "NetworkRule",
    "name": "AllowWindowsNTP",
    "ipProtocols": [
        "UDP"
    ],
    "sourceAddresses": [
        "*"
    ],
    "destinationAddresses": [],
    "sourceIpGroups": [],
    "destinationIpGroups": [],
    "destinationFqdns": [
        "time.windows.com"
    ],
    "destinationPorts": [
        "123"
    ]
}
The rules above are reflected in the Azure Portal within the Firewall Policy under Network Rules

All of the rule collections and application and network rules discussed here can also be found on Azure Network Security GitHub repo as a deployable Azure Fw Policy. There will be continuing improvement on the WVD Azure Firewall Policy sample to include the Active Directory, Azure NetApp, and Office 365 Allow Rules. For now the deployable sample will include the items discussed in the Azure documentation.
In this post you learned how to use the new features of Azure Firewall premium with Windows Virtual Desktop. Features like IDPS and Web Categories which enhance your security posture for Windows Virtual Desktop. You also learned some examples of Application and Network rules for Windows Virtual Desktop.
Be sure to check out other examples at Azure Network Security GitHub and if interested please upload your Azure Firewall Sample patterns here as well via a pull request.
Special thanks to:
@Nyler Gaskins for GitHub assets and testing and reviewing this post
@Ashish Kapila for testing and reviewing the post
@Eric Moore for how to find the WVD data plane communication technique
by Contributed | Feb 24, 2021 | Technology
This article is contributed. See the original author and article here.
The rapid adoption of Azure globally has resulted in a need to provide strong security assurances to customers on the state of their workloads and Azure’s ability to protect their data. Azure confidential computing offers a state-of-the-art hardware, software & services platform to protect sensitive customer data in-use while minimizing the Trusted Computing Base (TCB). Microsoft Azure Attestation reinforces the security promises made by cutting-edge security paradigms such as confidential computing.
Azure Attestation offers a simple PaaS experience to enable customers solve the complicated problem of gaining trust and verifying the identity of an environment before they interact with it. The ability to gain this trust allows customers to develop applications and create business models that require uncompromising trust where they were previously unable to create them — in the cloud.
What is Azure Attestation?
Azure Attestation is a unified solution that supports attestation of platforms backed by Trusted Platform Modules (TPMs) alongside the ability to attest to the state of Trusted Execution Environments (TEEs) such as Intel® Software Guard Extensions (SGX) enclaves and Virtualization-based Security (VBS) enclaves.
Azure Attestation receives evidence from an environment, validates it with Azure security standards and configurable user-defined policies, and produces cryptographic proofs (termed as attestation tokens) for claims-based applications. These tokens enable relying parties to gain confidence in trustworthiness of the environment, integrity of the software binaries running inside it and make trust-based decisions to release sensitive data to it. The tokens generated by Azure Attestation can be consumed by services in scenarios such as enclave validation, secure key sharing, confidential multi-party computation etc.
Why use Azure Attestation?
Azure Attestation provides the following benefits:
- Offers a unified solution for attesting multiple TEEs or platforms backed by TPMs
- Provides regional shared attestation providers to simplify the attestation process without the need for additional configuration
- Allows creation of custom attestation providers and configuration of policies to customize attestation token generation
- Provides ability to securely communicate with the attested platform with the help of data embedded in an attestation token using industry-standard formatting
- Highly available service with Business Continuity and Disaster Recovery (BCDR) configured across regional pairs
How does Azure Attestation work?
An attestation provider is a service endpoint of Azure Attestation that provides REST contract. You can choose to use the regional shared providers or create your own custom provider. Attestation provider comes with a default policy for each supported attestation type. Azure Attestation also lets you enforce custom rules in your custom provider via a configurable policy. If configured, an attestation policy is used to process the attestation evidence and determines whether the service shall issue an attestation token.
The following actors are involved in an Azure Attestation workflow:
Client: The component which collects evidence from an environment and sends attestation requests to Azure Attestation.
Azure Attestation: The component which accepts evidence from the client, validates it with Azure security standards, evaluated it against the configured policy and returns attestation token to the client.
Relying party: The component which relies on Azure Attestation for remotely attesting the state of an environment supported by TPM/enclave.
Consider a multi-party data sharing use-case where organizations (relying party) want to share data with its partners and achieve great insights by running inference models on the aggregated information. To protect data confidentiality while leveraging mutual benefits, data in-use can be encrypted and stored in TEEs like SGX enclaves. However before giving access to the encrypted content, organizations would like to validate trust worthiness of the enclave and then securely transfer secrets to the enclave. Azure Attestation enables in the remote verification process.
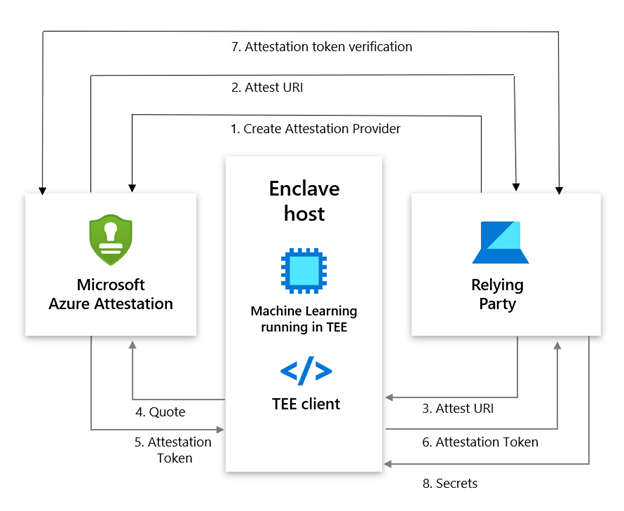
Below is the workflow example for confidential computing scenario based on Azure Attestation:
- The user creates an provider using PowerShell/Portal/CLI
(Note: Regional shared attestation providers can be used to perform attestation when there is no requirement for custom policies)
- Attest URI is returned to the user
- Attest URI is shared with the TEE client as a reference to Azure Attestation
- The client collects enclave evidence and sends attestation request to Azure Attestation
- The service validates the submitted information and evaluates it against a configured policy. If the verification succeeds, it issues an attestation token and returns it to the client
- The client sends the attestation token back to the relying party
- The relying party calls public key metadata endpoint of Azure Attestation to retrieve signing certificates of the attestation token. The relying party then verifies the signature of the attestation token and refers the claims inside it
- The public key generated within an enclave is embedded in the attestation token. Relying party can use this key from the verified response to encrypt the secrets and share with the enclave

Getting started with Azure Attestation
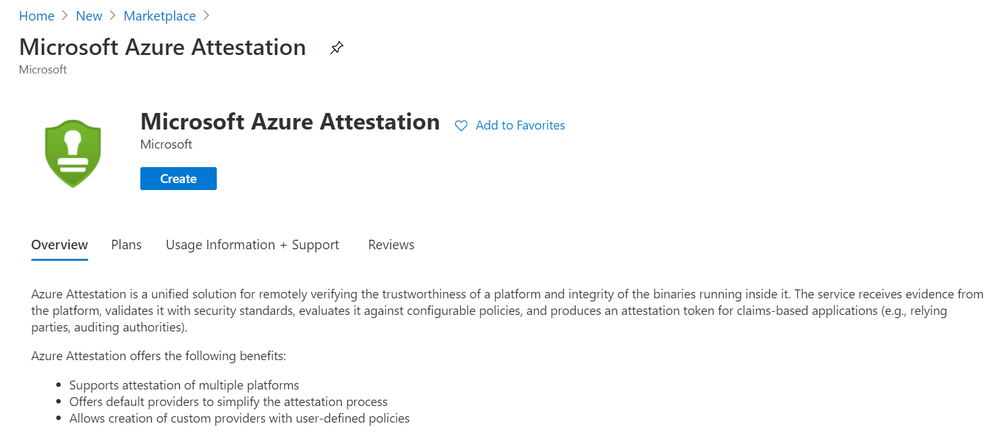
- To create an attestation provider via the Azure portal, select Azure Attestation in the Azure portal Marketplace menu and click Create
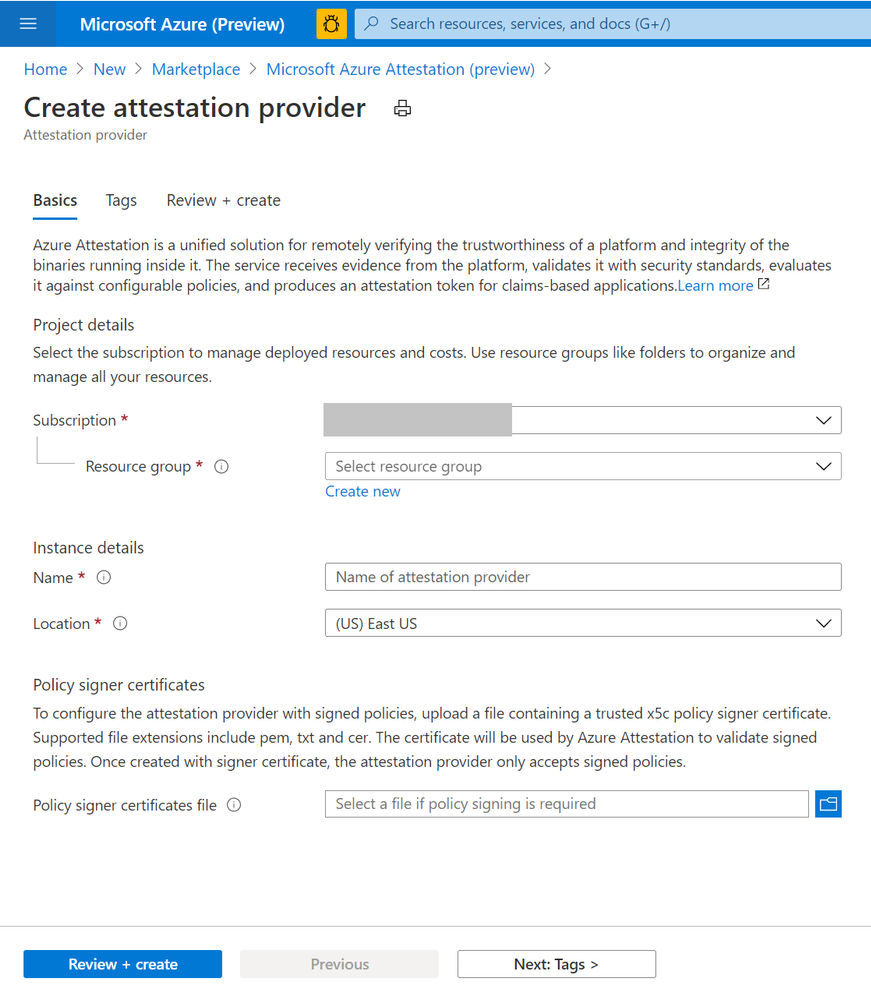
- Provide a name, location, subscription and resource group and proceed with the creation of your attestation provider. (Upload policy signer certificates file to configure the attestation provider with signed policies. Learn more)
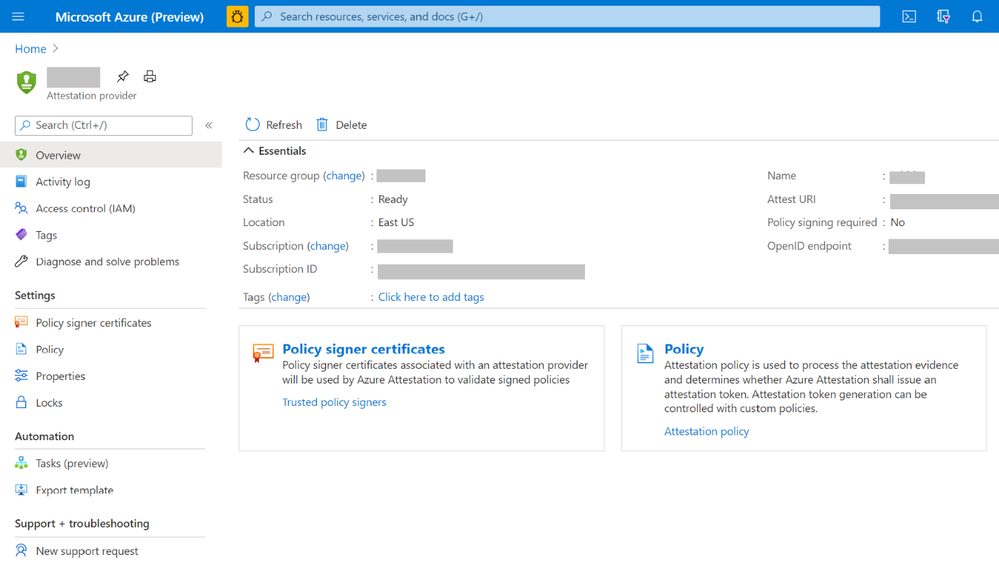
- Once created, details of the provider can be seen on the Overview page.
- To view the default policy of your attestation provider, select Policy in the left-hand side Resource Menu. You see a prompt to select certificate for authentication. Please choose the appropriate option to proceed.
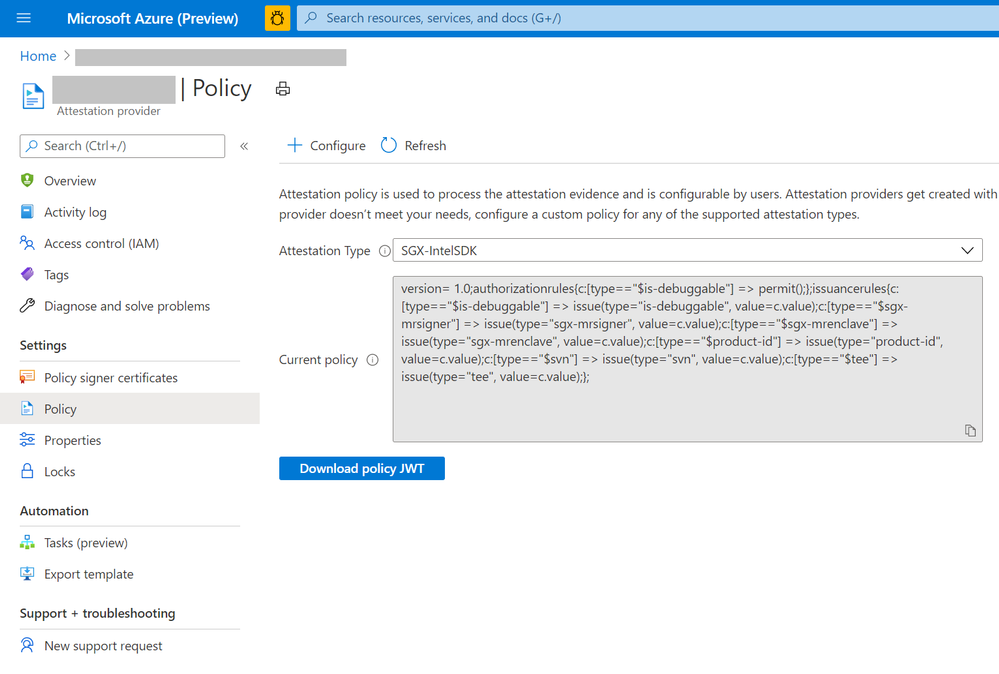
- To configure a custom policy to meet your requirements, click configure. Provide policy information in text/JSON Web Token format and click Save.
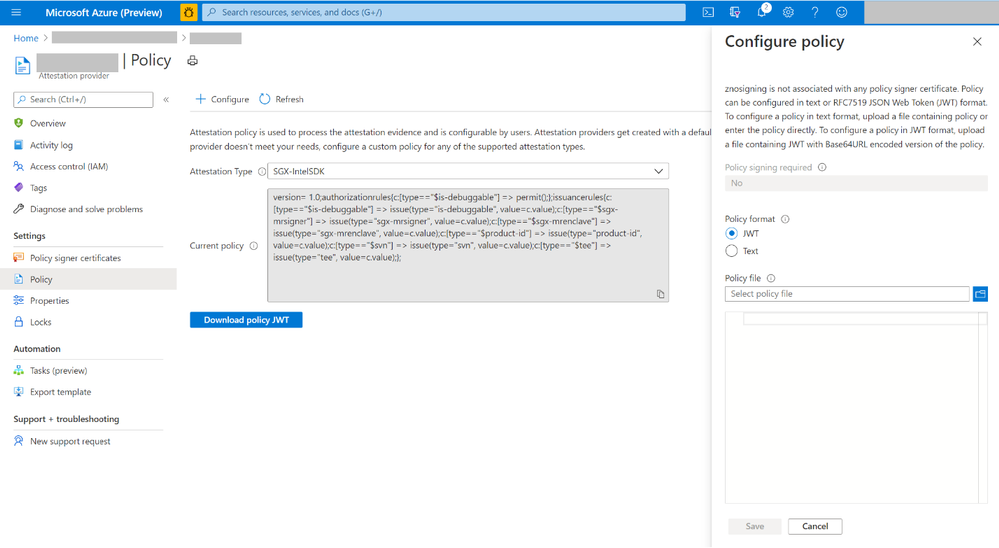
- Click the Refresh button to view the updated policy
Creation and management of attestation providers can also be performed using Command Line Interface (CLI) or Azure PowerShell.
Customer success stories
We are excited to multiple scenarios benefiting from Azure Attestation. Some of them include:
SQL Always Encrypted with secure enclaves
“Microsoft Azure Attestation is a key component of a solution for confidential computing provided by Always Encrypted with secure enclaves in Azure SQL Database. Azure Attestation allows database users and applications to attest secure enclaves inside Azure SQL Database are trustworthy and therefore can be confidently used to process queries on sensitive data stored in customer databases.”
– Joachim Hammer, Principal Group PM Manager, Azure SQL
ISV partners
Microsoft also works with platform partners who specialize in creating scalable software running on top of Azure confidential computing environments. The partners like Fortanix, Anjuna, and Scone have expressed great interest in leveraging the services offered by Azure Attestation.
Future roadmap for Azure Attestation
Our long-term aspiration is partnering with people and organizations around the planet to help them achieve more, and more securely with Microsoft Azure Attestation. Azure Attestation will be the one Microsoft service that attests multiple platforms used by Azure customers such as Confidential Containers, Confidential VMs, IOT edge devices and more. We expect Azure Attestation to be the leading cloud service for customers to establish unconditional trust in infrastructure and runtime across Azure, on-prem and edge. It will drive the adoption of Microsoft services while strengthening customer data governance.
Learn more about Azure Attestation.


Recent Comments