by Contributed | Mar 30, 2021 | Technology
This article is contributed. See the original author and article here.
In this video, we’ll go through the details of how data is ingested into FHIR from an EMR. Marc Kuperstein walks through the different ways data can be ingested such as batch ingestion or realtime ingestion and why you would want to use each process. He will also go over the ingestion pipeline and different ways to get the data out of FHIR.
by Contributed | Mar 30, 2021 | Technology
This article is contributed. See the original author and article here.
We are bringing together Microsoft, SAP and a select number of Global System Integrator partners in a jointly led, live webinar series now through June 2021, to showcase how SAP and Microsoft technologies along with our partner solutions, solve a unique business challenge for our customers. We invite you to participate in the upcoming live webinar and view the on-demand webinars. Stay tuned for new webinar topics in May & June!
Upcoming Webinar on Tue Apr 27 at 11 am ET:
Real-Time Inventory Replenishment powered by T-systems with SAP on Azure
Digital Transformation is in the middle of historic acceleration, fueled by a pandemic, and it has brought up new ways of collaboration, disruption, and innovation. Organizations must fundamentally adapt and change their business models so they can be nimble, agile, and responsive. T-Systems believes that tech intensity will play a key role in enhancing business resilience and the transformation of organizations amid the pandemic and beyond.
Join experts from T-systems, Microsoft, and SAP on this webinar, who will showcase their collective innovation and technology capabilities to demonstrate a Real-time Inventory Replenishment solution. The solution brings a perspective of how a responsive supply chain dynamically flexes itself to avoid business disruption and alerts a low stock inventory within the retail landscape, and the insights gained results in issuing a real-time order with SAP to fulfill new sales orders. The entire process is transparent such that customer satisfaction and experience is safeguarded from stock out situation. Register here.
Available On Demand
Imagine What’s Possible: Real Success Stories for Business Leaders Seeking SAP Modernization on Microsoft Azure
Join Microsoft, SAP and DXC Technology on this webinar to explore the possibilities enterprises realize from migrating their SAP workloads to S/4HANA on Azure. Sharing real customer stories, DXC illustrates how customers have transformed and modernized their SAP applications and derived greater business insights from their SAP data through Azure cloud native analytics, while achieving the resiliency required for these mission critical applications. Watch the webinar
Maximize your investment in SAP and Azure Synapse to create a cost-effective data analytics strategy
Many businesses struggle trying to wrangle multiple data sources into a cohesive data analytics strategy. Bringing together SAP and non-SAP data can be complex and require significant technical resources. IBM can help you bring this data together in data fabric that maximizes your investment in SAP combined with Azure Synapse creating a cost- effective data analytics strategy and implementation.
Join this webinar to learn:
- How to build a cost-effective data fabric across your SAP and non-SAP data that delivers business insights.
- Utilize the Microsoft & SAP reference architectures and data patterns to reduce complexities of duplication and maximize insights.
- Understand how Azure Synapse brings together data integration, enterprise data warehousing, and big data analytics for unified experience. Watch the webinar.
Understand the phased path to SAP S/4HANA and the differentiated benefits of running SAP on Microsoft Azure
SAP S/4HANA offers simplifications, efficiency, and compelling features such as planning and simulation options in many conventional transactions. Yet because moving your complete application portfolio from on-premises to cloud-based SAP S/4HANA is a big investment, it can be difficult to get organizational buy-in, let alone know where to start. SAP, Microsoft, and Infosys have come together in this interactive webinar to help answer business decision maker questions such as where to start, how to scope the project for your company’s unique needs, choosing the right path of transition versus transformation. View the webinar on demand.
To learn more about Infosys solutions for SAP, visit SAP End to End Consulting, Implementation, Support Services | Infosys
by Contributed | Mar 30, 2021 | Technology
This article is contributed. See the original author and article here.
The Workplace Analytics team is excited to announce our feature updates for April 2021. (You can see past blog articles here). This month’s update describes a coming attraction: Collaboration and Manager metrics with Teams IM and call data.
Coming soon: Collaboration and manager metrics with Teams IM and call data
Overview
We are pleased to announce a new feature release for April 19, 2021. The new release includes a few exciting updates:
- Integration of Microsoft Teams chats and Teams calls into the Collaboration hours metric and refined Collaboration hours logic to better accommodate overlapping activities
- New “is person’s manager” and “is person’s direct report” attributes available in Person query participant filters
Additionally, we’ve implemented a handful of improvements to other metrics:
- Outlier improvements to Email hours and Call hours metrics
- Better alignment of After-hours collaboration hours and Working hours collaboration hours to total Collaboration hours, and of After-hours email hours and Working hours email hours to total Email hours
These updates reflect customer feedback and help leaders better understand how collaboration in Microsoft Teams impacts wellbeing and productivity.
How do these changes impact you?
For Workplace Analytics analysts
- Adjusted results – If you are accessing insights in Microsoft Viva Insights app in Teams or the Workplace Analytics web application, running custom queries, or using Workplace Analytics Power BI templates, some of the aggregated results might show different numbers than previously seen.
These changes will not impact any queries that have already been run and saved, and starting April 19, 2021, new queries and calculated insights will use the new logic over the entire historical period of collaboration data. If you are in the middle of an active project that uses these metrics, we recommend re-running your queries to update the results with the new versions of the impacted metrics.
- “Unstacking” the Collaboration hours metric – You might be used to seeing or using visualizations that “stack” the components of collaboration time (like Meeting hours and Email hours) to get to the total collaboration time. But since emails and Teams chats and calls can occur during meetings and Teams calls, we’ve refined the logic so that these “overlapping activities” only count toward total collaboration time once.
As a result, expect to see Collaboration hours that is no longer just the sum of its parts – Email hours, Call hours, Teams chat hours, and Meeting hours. If you have reports and visuals that compare collaboration hours with its parts, you might want to adjust the report to show these components side by side instead. For example, the Workplace Analytics Ways of working assessment and Business continuity templates for Power BI both previously included examples of this “stacked” view, which will reflect revised visuals when you download the newest versions of the templates.
- New manager measures – Want to know how many emails the average manager sends to their directs? Or whether managers on a team tend to use unscheduled calls instead of scheduled 1:1s? You are no longer limited to just the “built-in” manager meeting metrics in Workplace Analytics.
If you are interested in understanding how employees communicate with their direct managers, you can create new custom measures in a Person query to measure the meeting, email, call, and chat activity where any or all participants are the measured employee’s direct manager or direct report.
- Impact on Plans – If you are currently running a Wellbeing plan to reduce after-hours collaboration, you might observe a shift in the baseline After-hours collaboration hours metric, which might cause the goal that was selected for the plan to no longer make sense. If this is the case, we recommend requesting a deferral of this feature so that ongoing plans can finish running undisturbed.
For manager or leader insights
Shifting points of reference – If you are used to seeing a specific result for some metrics (for example, “I know that our average email hours are usually around 8 hours per week, and that’s something we’d like to reduce.”), the new changes will likely change the results. However, that baseline number might shift as a result of the improved methodology. If you are working directly with a Workplace Analytics practitioner from Microsoft, a partner, or your own organization, they can help you evaluate whether this raises any new considerations for ongoing projects.
What if you want to get these features sooner than April 19, 2021?
To sign up for early access, please complete this online form.
Can you defer this release?
Expect to see some shifts in the results for metrics impacted by these changes (full list below). If you are in the middle of an active project that uses these metrics, we recommend re-running your queries to update the results with the new version of collaboration hours.
If this shift would be disruptive to your project, you can optionally request a one-time deferral of this feature release for up to three months. Please complete the online form by April 15, 2021, if you would like to request a one-time, three-month deferral.
Additional details about the changes
Integrates Microsoft Teams chats and calls into Collaboration hours and related metrics
The legacy Collaboration hours metric simply added email hours and meeting hours. However, in reality, these activities can overlap. Collaboration hours now reflect the total impact of different types of collaboration activity, including emails, meetings, Teams chats, and Teams calls. With this release, Collaboration hours capture more time and activity, and adjusts the results so that any overlapping activities are counted only once.
The following queries and metrics will reflect this new logic:
Person query and Peer analysis query
- Collaboration hours
- Working hours collaboration hours
- After hours collaboration hours
- Collaboration hours external
Person-to-group query
Group-to-group query
The following join the other metrics that already include Teams activity:
Person query and Peer analysis query
- Workweek span
- Internal network size
- External network size
- Networking outside organization
- Networking outside company
Network: Person query
Network: Person-to-person query
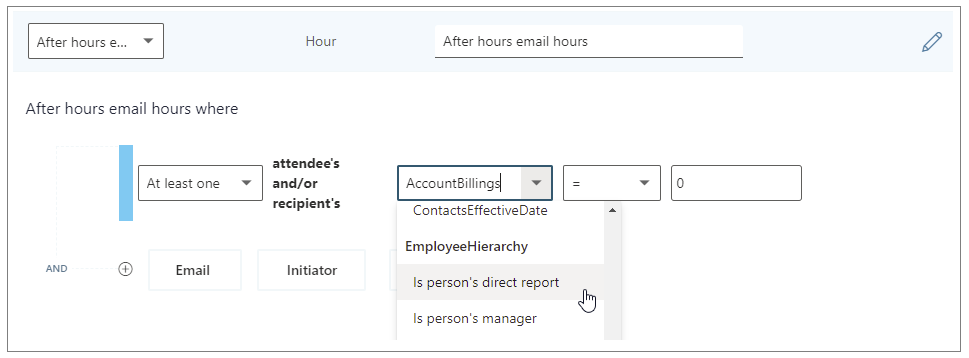
Adds new “Is person’s manager” and “Is person’s direct report” metric filter options
We’re adding new participant filter options to our email, meeting, chat, and call metrics for Person queries. These new options enable you to filter activity where all, none, or at least one participant includes the measured employee’s direct manager or their direct report.
You can use the new filters to customize any base metric that measures meeting, email, instant message, or call activity (such as Email hours, Emails sent, Working hours email hours, After hours email hours, Meeting hours, and Meetings).
Selecting the “Is person’s direct report” filter to customize a metric
The following are examples of some custom metrics you can create in a Person query with these new filters.
Analysis question
|
Definition
|
Base metric
|
Customized filter
|
How much time do employees spend chatting with their manager?
|
The number of hours the person’s manager spent talking to the person through IMs
|
Instant message hours
|
(Participant: At least one participant’s: Is person’s manager = True)
|
How often do managers use unscheduled calls for 1:1s with their direct reports?
|
Total number of hours that a manager spent in 1:1 calls with their direct reports
|
Call hours
|
(Call: Participant Count =2) AND (Participant: At least one participant’s: Is person’s direct report = True) AND
(Call: IsScheduled = FALSE)
|
How much discussion between employees and their manager occurs via email?
|
Total number of hours that a person spent in emails with their manager
|
Email hours
|
(Participant: At least one participant’s: Is person’s manager = True)
|
Improves outlier handling for Email hours and Call hours
When actual received email data is not available, Workplace Analytics uses logic to impute an approximation of the volume of received mail. We are adjusting this logic to reflect the results of more recent data science efforts to refine these assumptions. Further, we have received reports about measured employees with extremely high measured call hours. This was a result of “runaway calls” where the employee joined a call and forgot to hang up. We have capped call hours to a maximum of three hours to avoid attributing excessive time for these scenarios.
The following queries and metrics will use the new logic:
Person query and Peer analysis query
- Collaboration hours
- Working hours collaboration hours
- After hours collaboration hours
- Collaboration hours external
- Email hours
- Working hours email hours
- After hours email hours
- Call hours
Person-to-group query
- Collaboration hours
- Email hours
Group-to-group query
- Collaboration hours
- Email hours
Better aligns working hours and after-hours metrics with their respective overall metrics
Previously, After-hours email hours plus Working hours email hours and After-hours collaboration hours plus Working hours collaboration hours did not add up to total Email hours or Collaboration hours, because of limitations attributing certain types of measured activity to a specific time of day. We improved the algorithm to better attribute time for these metrics, resulting in better alignment between working hours and after-hours metrics.
The following queries and metrics will reflect the new logic:
Person query and Peer analysis query
- Working hours collaboration hours
- After hours collaboration hours
- Working hours email hours
- After hours email hours
Impacted metrics by query type
Person and Peer analysis queries
|
Collaboration hours
|
The number of hours the person spent in meetings, emails, IMs, and calls with at least one other person, either internal or external, after deduplication of time due to overlapping activities (for example, calls during a meeting).
- Updated with time-journaling logic to deduplicate time due to overlapping activities
- Improved logic for imputation of reads from unlicensed employees
- Added a cap to prevent outliers for call hours.
|
Working hours collaboration hours
|
The number of hours the person spent in meetings, emails, IMs, and calls with at least one other person, either internal or external, after deduplication of time due to overlapping activities (for example, calls during a meeting), during working hours.
- Updated with time-journaling logic to deduplicate time due to overlapping activities
- Improved logic for imputation of reads from unlicensed employees
- Improved logic to attribute email read time to time of day
- Added a cap to prevent outliers for call hours
|
After hours collaboration hours
|
The number of hours the person spent in meetings, emails, IMs, and calls with at least one other person, either internal or external, after deduplication of time due to overlapping activities (for example, calls during a meeting), outside of working hours.
- Updated with time-journaling logic to deduplicate time due to overlapping activities
- Improved logic for imputation of reads from unlicensed employees
- Improved logic to attribute email read time to time of day
- Added a cap to prevent outliers for call hours
|
Collaboration hours external
|
The number of hours the person spent in meetings, emails, IMs, and calls with at least one other person outside the company, after deduplication of time due to overlapping activities (for example, calls during a meeting).
- Updated with time-journaling logic to deduplicate time due to overlapping activities
- Improved logic for imputation of reads from unlicensed employees
- Added a cap to prevent outliers for call hours.
|
Email hours
|
The number of hours the person spent sending and receiving emails.
- Improved logic for imputation of reads from unlicensed employees
|
After hours email hours
|
The number of hours the person spent sending and receiving emails outside of working hours.
- Improved logic for imputation of reads from unlicensed employees
- Improved logic to attribute email read time to time of day
|
Working hours email hours
|
The number of hours the person spent sending and receiving emails during working hours.
- Improved logic for imputation of reads from unlicensed employees
- Improved logic to attribute email read time to time of day
|
Generated workload email hours
|
The number of email hours the person created for internal recipients by sending emails.
- Improved logic for imputation of reads from unlicensed employees
|
Call hours
|
The number of hours the person spent in scheduled and unscheduled calls through Teams with at least one other person, during and outside of working hours.
- Added a cap to prevent outliers for call hours
|
After hours in calls
|
The number of hours a person spent in scheduled and unscheduled calls through Teams, outside of working hours.
- Added a cap to prevent outliers for call hours
|
Working hours in calls
|
The total number of hours a person spent in scheduled and unscheduled calls through Teams, during working hours.
- Added a cap to prevent outliers for call hours
|
Person-to-group queries
|
Collaboration hours
|
The number of hours that the time investor spent in meetings, emails, IMs, and calls with one or more people in the collaborator group, after deduplication of time due to overlapping activities (for example, calls during a meeting). This metric uses time-allocation logic.
- Updated with time-journaling logic to deduplicate time due to overlapping activities
- Improved logic for imputation of reads from unlicensed employees
- Added a cap to prevent outliers for call hours.
|
Email hours
|
Total number of hours that the time investor spent sending and receiving emails with one or more people in the collaborator group. This metric uses time-allocation logic.
- Improved logic for imputation of reads from unlicensed employees
|
Group-to-group queries
|
Collaboration hours
|
The number of hours that the time investor spent in meetings, emails, IMs, and calls with one or more people in the collaborator group, after deduplication of time due to overlapping activities (for example, calls during a meeting). This metric uses time-allocation logic.
- Updated with time-journaling logic to deduplicate time due to overlapping activities
- Improved logic for imputation of reads from unlicensed employees
- Added a cap to prevent outliers for call hours.
|
Email hours
|
Total number of hours that the time investor spent sending and receiving emails with one or more people in the collaborator group. This metric uses time-allocation logic.
- Improved logic for imputation of reads from unlicensed employees
|
by Contributed | Mar 30, 2021 | Technology
This article is contributed. See the original author and article here.
Introduction
Recent attacks highlight the fact that in addition to implementing appropriate security protection controls to defend against malicious adversaries, continuous monitoring, and response for every organization. To implement security monitoring and response from a networking perspective, you need visibility into traffic traversing through your network devices and detection logic to identify malicious patterns in the network traffic. This is a critical piece for every infrastructure/network security process.
Readers of this post will hopefully be familiar with both Azure Firewall which provides protection against network-based threats, and Azure Sentinel which provides SEIM and SOAR (security orchestration, automation, and response) capabilities. In this blog, we will discuss the new detections for Azure Firewall in Azure Sentinel. These new detections allow security teams to get Sentinel alerts if machines on the internal network attempt to query/connect to domain names or IP addresses on the internet that are associated with known IOCs, as defined in the detection rule query. True positive detections should be considered as Indicator of Compromise (IOC). Security incident response teams can then perform response and appropriate remediation actions based on these detection signals.
Scenario
In case of an attack, after breaching through the boundary defenses, a malicious adversary may utilize malware and/or malicious code for persistence, command-and-control, and data exfiltration. When malware or malicious code is running on machines on the internal network, in most cases, it will attempt to make outbound connections for command-and-control updates, and to exfiltrate data to adversary servers through the internet. When this happens, traffic will inevitably flow out through the network egress points where it will be processed and logged by the by devices or ideally a firewall controlling internet egress. The data logged by devices/firewalls processing internet egress traffic can be analyzed to detect traffic patterns suggesting/representing command-and-control or exfiltration activities (also called IOCs or Indicator of Compromise). This is the basis of network-based detections discussed in this blog.
When customers use Azure Firewall for controlling their internet egress, Azure Firewall will log all outbound traffic and DNS query traffic if configured as a DNS Proxy, to the defined Log Analytics workspace. If a customer is also using Azure Sentinel, they can ingest log data produced by Azure Firewall and run built-in or custom Analytic Rules templates on this data to identify malicious traffic patterns representing IOCs, that these rules are defined to detect. These rules can be configured to run on a schedule and create an incident (or perform an automated action) in Azure Sentinel when there is a match. These incidents can then be triaged by the SOC for response and remediation.
What’s New
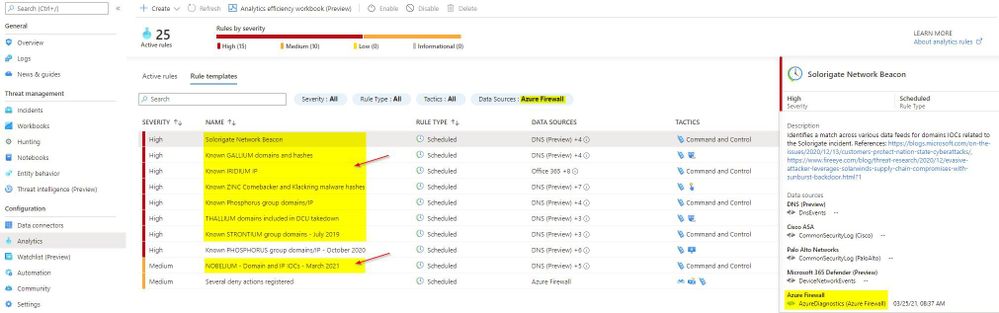
Up until now, there were only a couple of Analytic Rule based detections for Azure Firewall available in Azure Sentinel. We are excited to announce availability of eight new detections for well-known IOCs in Azure Sentinel based on traffic patterns flowing through the Azure Firewall. The table below provides a list of new detections which have been added recently and are available to you at the time of publishing this blog.
The screenshot below shows the new Azure Firewall detections in the Azure Sentinel Analytic Rule blade
Azure Firewall Detection Rules in Azure Sentinel
How Network Based Detection Work
To understand how these detections work, we will examine the “Solorigate Network Beacon” detection which indicates a compromise associated with the SolarWinds exploit. The query snippet below identifies communication to domains involved in this incident.
- We start by declaring all the domains that we want to find in the client request from the internal network
let domains = dynamic(["incomeupdate.com","zupertech.com","databasegalore.com","panhardware.com","avsvmcloud.com","digitalcollege.org","freescanonline.com","deftsecurity.com","thedoccloud.com","virtualdataserver.com","lcomputers.com","webcodez.com","globalnetworkissues.com","kubecloud.com","seobundlekit.com","solartrackingsystem.net","virtualwebdata.com"]);
- Then we perform a union to look for traffic destined for these domains in data from multiple sources which include Common Security Log (CEF), DNS Events, VM Connection, Device Network Events, Azure Firewall DNS Proxy, and Azure Firewall Application Rule logs
(union isfuzzy=true
(CommonSecurityLog
        | parse ..
),
(DnsEvents
        | parse ..
),
(VMConnection
        |parse ..
),
(DeviceNetworkEvents
        | parse ..
),
(AzureDiagnostics
    | where ResourceType == "AZUREFIREWALLS"
    | where Category == "AzureFirewallDnsProxy"
    | parse msg_s with "DNS Request: " ClientIP ":" ClientPort " - " QueryID " " Request_Type " " Request_Class " " Request_Name ". " Request_Protocol " " Request_Size " " EDNSO_DO " " EDNS0_Buffersize " " Responce_Code " " Responce_Flags " " Responce_Size " " Response_Duration
    | where Request_Name has_any (domains)
    | extend DNSName = Request_Name
    | extend IPCustomEntity = ClientIP
    ),
  (AzureDiagnostics
    | where ResourceType == "AZUREFIREWALLS"
    | where Category == "AzureFirewallApplicationRule"
    | parse msg_s with Protocol 'request from ' SourceHost ':' SourcePort 'to ' DestinationHost ':' DestinationPort '. Action:' Action
    | where isnotempty(DestinationHost)
    | where DestinationHost has_any (domains)
    | extend DNSName = DestinationHost
    | extend IPCustomEntity = SourceHost
    )
    )
- When this rule query is executed (based on schedule), it will analyze logs from all the data sources defined in the query which also includes the Azure Firewall DNS Proxy and Application Rule logs. The result will identity hosts in the internal network which attempted to query/connect to one of the malicious domains which were declared in Step 1
Instructions to Configure Azure Firewall Detections in Sentinel
These detections are available as Analytic Rules in Azure Sentinel and can be quickly deployed by following the steps below.
- Open the Azure Sentinel blade in the Azure Portal
- Select the Sentinel workspace where you have the Azure Firewall logs
- Select Analytics blade and then click on Rule templates
- Under Data Sources, filter by Azure Firewall
- Select the Rule template you want to enable and click Create rule and configure rule settings to create a rule
 Steps to Configure Azure Firewall Rules in Azure Sentinel
Summary
Azure Firewall logs can help identify patterns of malicious activity and Indicators of Compromise (IOCs) in the internal network. Built-in Analytic Rules in Azure Sentinel provide a powerful and reliable method for analyzing these logs to detect traffic representing IOCs in your network. With added support for Azure Firewall to these detections, you can now easily detect malicious traffic patterns traversing through Azure Firewall in your network which allows you to rapidly respond and remediate the threats. We encourage all customers to utilize these new detections to help improve your overall security posture.
As new attack scenarios surface and associated detections are created in future, we will evaluate them and add support for Azure Firewall or other Network Security products, where applicable. You can also contribute new connectors, detections, workbooks, analytics and more for Azure Firewall in Azure Sentinel. Get started now by joining the Azure Network Security plus Azure Sentinel Threat Hunters communities on GitHub and following the guidance.
Additional Resources
by Contributed | Mar 30, 2021 | Technology
This article is contributed. See the original author and article here.
Getting started with Azure Speech and Batch Ingestion Client
Batch Ingestion Client is as a zero-touch transcription solution for all your audio files in your Azure Storage. If you are looking for a quick and effortless way to transcribe your audio files or even explore transcription, without writing any code, then this solution is for you. Through an ARM template deployment, all the resources necessary to seamlessly process your audio files are set-up and set in motion.
Why do I need this?
Getting started with any API requires some amount of time investment in learning the API, understanding its scope, and getting value through trial and error. In order to speed up your transcription solution, for those of you that do not have the time to invest in getting to know our API or related best practices, we created an ingestion layer (a client for batch transcription) that will help you set-up a full blown, scalable and secure transcription pipeline without writing any code.
This is a smart client in the sense that it implements best practices and optimized against the capabilities of the Azure Speech infrastructure. It utilizes Azure resources such as Service Bus and Azure Functions to orchestrate transcription requests to Azure Speech Services from audio files landing in your dedicated storage containers.
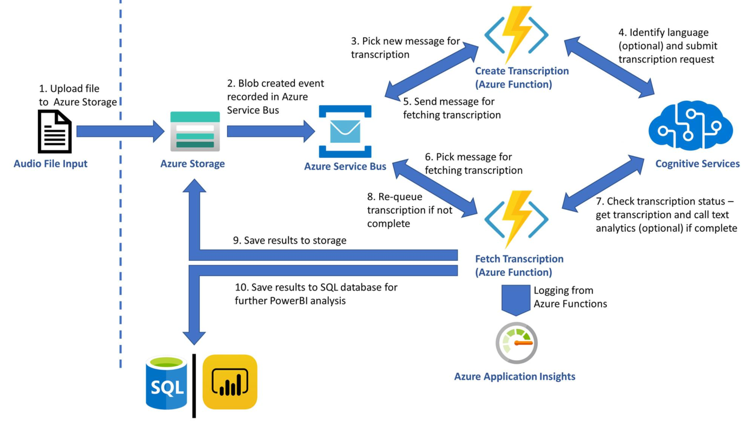
Before we delve deeper into the set-up instructions, let us have a look at the architecture of the solution this ARM template builds.
The diagram is simple and hopefully self-explanatory. As soon as files land in a storage container, the Grid Event that indicates the complete upload of a file is filtered and pushed to a Service bus topic. Azure Functions (time triggered by default) pick up those events and act, namely creating Tx requests using the Azure Speech Services batch pipeline. When the Tx request is successfully carried out an event is placed in another queue in the same service bus resource. A different Azure Function triggered by the completion event starts monitoring transcription completion status and copies the actual transcripts in the containers from which the audio file was obtained. This is it. The rest of the features are applied on demand. Users can choose to apply analytics on the transcript, produce reports or redact, all of which are the result of additional resources being deployed through the ARM template. The solution will start transcribing audio files without the need to write any code. If -however- you want to customize further this is possible too. The code is available in this repo.
The list of best practices we implemented as part of the solution are:
- Optimized the number of audio files included in each transcription with the view of achieving the shortest possible SAS TTL.
- Round Robin around selected regions in order to distribute load across available regions (per customer request)
- Retry logic optimization to handle smooth scaling up and transient HTTP 429 errors
- Running Azure Functions economically, ensuring minimal execution cost
Setup Guide
The following guide will help you create a set of resources on Azure that will manage the transcription of audio files.
Prerequisites
An Azure Account as well as an Azure Speech key is needed to run the Batch Ingestion Client.
Here are the detailed steps to create a speech resource:
NOTE: You need to create a Speech Resource with a paid (S0) key. The free key account will not work. Optionally for analytics you can create a Text Analytics resource too.
- Go to Azure portal
- Click on +Create Resource
- Type Speech and
- Click Create on the Speech resource.
- You will find the subscription key under Keys
- You will also need the region, so make a note of that too.
To test your account, we suggest you use Microsoft Azure Storage Explorer.
The Project
Although you do not need to download or do any changes to the code you can still download it from GitHub:
git clone https://github.com/Azure-Samples/cognitive-services-speech-sdkcd cognitive-services-speech-sdk/samples/batch/transcription-enabled-storage
Make sure that you have downloaded the ARM Template from the repository.
Batch Ingestion Client Setup Instructions
- Click on +Create Resource on Azure portal as shown in the following picture and type ‘ template deployment ’ on the search box.

2. Click on Create Button on the screen that appears as shown below.
3. You will be creating the relevant Azure resources from the ARM template provided. Click on click on the ‘Build your own template in the editor’ link and wait for the new screen to load.
You will be loading the template via the Load file option. Alternatively, you could simply copy/paste the template in the editor.
Saving the template will result in the screen below. You will need to fill in the form provided. It is important that all the information is correct. Let us look at the form and go through each field.

NOTE: Please use short descriptive names in the form for your resource group. Long resource group names may result in deployment error
- First pick the Azure Subscription Id within which you will create the resources.
- Either pick or create a resource group. [It would be better to have all the resources within the same resource group so we suggest you create a new resource group].
- Pick a region [May be the same region as your Azure Speech key].
The following settings all relate to the resources and their attributes
- Give your transcription enabled storage account a name [you will be using a new storage account rather than an existing one]. If you opt to use existing one then all existing audio files in that account will be transcribed too.
The following 2 steps are optional. Omitting them will result in using the base model to obtain transcripts. If you have created a Custom Speech model using Speech Studio, then:
- Enter optionally your primary Acoustic model ID
- Enter optionally your primary Language model ID
If you want us to perform Language identification on the audio prior to transcription you can also specify a secondary locale. Our service will check if the language on the audio content is the primary or secondary locale and select the right model for transcription.
Transcripts are obtained by polling the service. We acknowledge that there is a cost related to that. So, the following setting gives you the option to limit that cost by telling your Azure Function how often you want it to fire.
- Enter the polling frequency [There are many scenarios where this would be required to be done couple of times a day]
- Enter locale of the audio [you need to tell us what language model we need to use to transcribe your audio.]
- Enter your Azure Speech subscription key and Locale information
Spoiler (Highlight to read)
NOTE: If you plan to transcribe large volume of audio (say millions of files) we propose that you rotate the traffic between regions. In the Azure Speech Subscription Key text box you can put as many keys separated by column ‘;’. In is important that the corresponding regions (Again separated by column ‘;’) appear in the Locale information text box. For example if you have 3 keys (abc, xyz, 123) for east us, west us and central us respectively then lay them out as follows ‘abc;xyz;123’ followed by ‘east us;west us;central us’
NOTE: If you plan to transcribe large volume of audio (say millions of files) we propose that you rotate the traffic between regions. In the Azure Speech Subscription Key text box you can put as many keys separated by column ‘;’. In is important that the corresponding regions (Again separated by column ‘;’) appear in the Locale information text box. For example if you have 3 keys (abc, xyz, 123) for east us, west us and central us respectively then lay them out as follows ‘abc;xyz;123’ followed by ‘east us;west us;central us’
The rest of the settings related to the transcription request. You can read more about those in our docs.
- Select a profanity option
- Select a punctuation option
- Select to Add Diarization [all locales]
- Select to Add Word level Timestamps [all locales]
Do you need more than transcription? Do you need to apply Sentiment to your transcript? Downstream analytics are possible too, with Text Analytics Sentiment and Redaction being offered as part of this solution too.
If you want to perform Text Analytics please add those credentials.
- Add Text analytics key
- Add Text analytics region
- Add Sentiment
- Add data redaction
If you want to further analytics we could map the transcript json we produce to a DB schema.
- Enter SQL DB credential login
- Enter SQL DB credential password
You can feed that data to your custom PowerBI script or take the scripts included in this repository. Follow this guide for setting it up.
Press Create to trigger the resource creating process. It typically takes 1-2 mins. The set of resources are listed below.
If a Consumption Plan (Y1) was selected for the Azure Functions, make sure that the functions are synced with the other resources (see this for further details).
To do so, click on your StartTranscription function in the portal and wait until your function shows up:
Do the same for the FetchTranscription function
Spoiler (Highlight to read)
Important: Until you restart both Azure functions you may see errors.
Important: Until you restart both Azure functions you may see errors.
Running the Batch Ingestion Client
Upload audio files to the newly created audio-input container (results are added to json-result-output and test-results-output containers). Once they are done you can test your account.
Use Microsoft Azure Storage Explorer to test uploading files to your new account. The process of transcription is asynchronous. Transcription usually takes half the time of the audio track to be obtained. The structure of your newly created storage account will look like the picture below.

There are several containers to distinguish between the various outputs. We suggest (for the sake of keeping things tidy) to follow the pattern and use the audio-input container as the only container for uploading your audio.
Customizing the Batch Ingestion Client
By default, the ARM template uses the newest version of the Batch Ingestion Client which can be found in this repository. If you want to customize this further clone the repo
To publish a new version, you can use Visual Studio, right click on the respective project, click publish and follow the instructions.
What to build next
Now that you’ve successfully implemented a speech to text scenario, you can build on this scenario. Take a look at the insights Text Analytics provides from the transcript like caller and agent sentiment, key phrase extraction and entity recognition. If you’re looking specifically to solve for Call centre transcription, review this docs page for further guidance

Recent Comments