by Contributed | Apr 23, 2021 | Technology
This article is contributed. See the original author and article here.
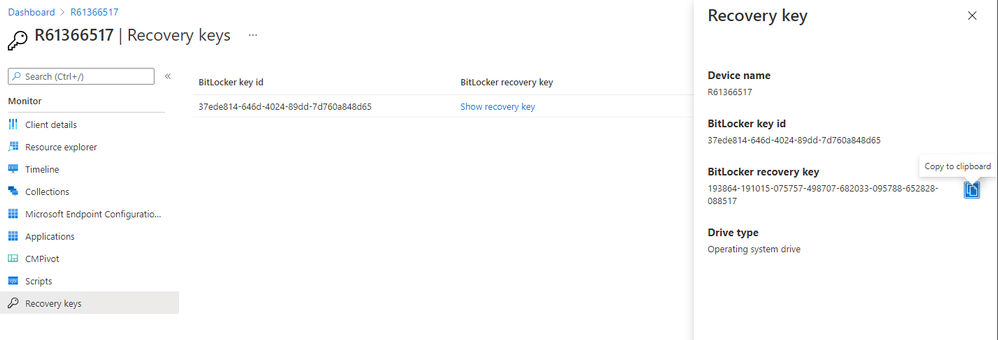
Update 2104 for the Technical Preview Branch of Microsoft Endpoint Configuration Manager has been released. You can now get BitLocker recovery keys for a tenant-attached device from the Microsoft Endpoint Manager admin center. For example, a help desk technician who doesn’t have access to Configuration Manager could use the web-based admin center to help an end user get a recovery key for their device. Since this feature is still in preview, you need to access it from the Admin center preview option from the Configuration Manager console of the technical preview branch.
 bitlocker recovery keys in mem admin center
For more information, see Tenant attach: BitLocker recovery keys.
This preview release also includes:
Tenant Attach: Historical inventory data in resource explorer – Resource explorer can display a historical view of the device inventory in the Microsoft Endpoint Manager admin center. Since this feature is still in preview, you’ll need to access it from the Admin center preview option from the Configuration Manager console of the technical preview branch.
Tenant attach: Offboarding – While we know customers get enormous value by enabling tenant attach, there are rare cases where you might need to offboard a hierarchy. For example, you may need to offboard following a disaster recovery scenario where the on-premises environment was removed. Starting with Technical Preview 2104, you can now offboard a selected hierarchy.
Support layered keyboard driver during OS deployment – Based on your feedback, this release adds support for layered keyboard drivers during OS deployment. This driver specifies other types of keyboards that are common with Japanese and Korean languages.
Run software updates evaluation from deployment status – You can now right-click and notify devices to run a software updates evaluation cycle from the software update deployment status. You can target a single device under the Asset Details pane or select a group of devices based on their deployment status.
Improvements to Support Center – Starting in this technical preview, the Content view in the Support Center Client Tools has been renamed to Deployments. From Deployments, you can review all of the deployments currently targeted to the device. The new view is grouped by Category and Status. The view can be sorted and filtered to help you find the deployments you’re interested in. Select a deployment in the results pane to display more information in the details pane.
Improvements to CMTrace – This release includes multiple performance improvements to the CMTrace log viewer. Configuration Manager automatically installs this tool in several locations. If you have a copy of CMTrace in another location, consider removing it and using a copy in one of the default paths or updating it to the latest version.
PowerShell release notes preview – These release notes summarize changes to the Configuration Manager PowerShell cmdlets in technical preview version 2104.
Update 2104 for Technical Preview Branch is available in the Microsoft Endpoint Configuration Manager Technical Preview console. For new installations, the 2103 baseline version of Microsoft Endpoint Configuration Manager Technical Preview Branch is available on the Microsoft Evaluation Center. Technical Preview Branch releases give you an opportunity to try out new Configuration Manager features in a test environment before they are made generally available.
We would love to hear your thoughts about the latest Technical Preview! Send us feedback about product issues directly from the console and continue to share and vote on ideas about new features in Configuration Manager.
Thanks,
The Configuration Manager team
Configuration Manager Resources:
Documentation for Configuration Manager Technical Previews
Try the Configuration Manager Technical Preview Branch
Documentation for Configuration Manager
Microsoft Endpoint Manager announcement
Microsoft Endpoint Manager vision statement
Configuration Manager Forums
Configuration Manager Support

by Contributed | Apr 23, 2021 | Technology
This article is contributed. See the original author and article here.
3 Easy steps to perform Logging in Asp.net core after its published to production servers.
There are times when we face challenges to debug the applications which is already in production and we need to know what is happening for that piece of code and so on.
There can be any number of issues ranging from “startup” to “page throwing errors after deploying to IIS server” etc.
In Visual studio we get the detailed information in output window, when we build or run the application and there are certain providers which we can enable to see logging in much detailed but once it’s published to IIS we are left out with very less options that we can see.
Sample output window from VS for simple hello world !

In this blog, we will discuss how we can generate ideal view of what we see locally in Visual studio output window and get similar output in the form of logs on the server, especially for asp.net core applications which are already published to production servers. Also we will see how we can include additional providers to generate logs for Asp.netcore applications.
Three easy steps!
Step 1:
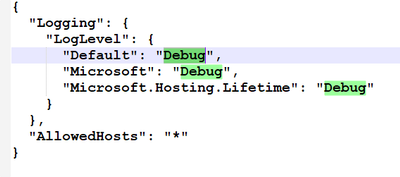
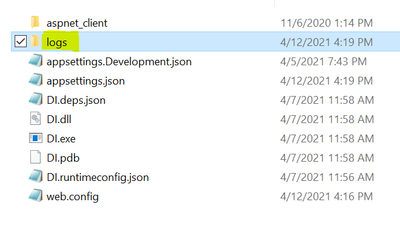
Once we publish the application to IIS server, go to Web.config and make stdoutLogEnabled to True as shown below and save and close the file. Then go to Appsettings.json file and edit the Log Level section to get a log file generated within the same folder. Ensure your application pool’s identity has write permissions to application folder where we have the web.config.
(There are other Providers we can use in place of Debug as well please see the references for more information)
Web.config:

Step 2:
Once we change the values of above elements to Debug with a capital ‘D’ as case sensitive then restart the application pool to take effect. This not mandatory step to do but just to get more information.
AppSettings.json:
Step 3:
Browse the application and you should see the log file got generated which gives debug level information which is very useful to identify or troubleshoot any issues in production.

Sample from the log got generated:
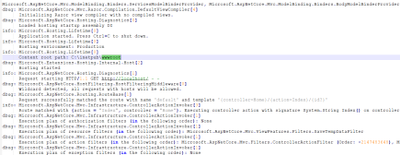
There are different log levels that you can use.
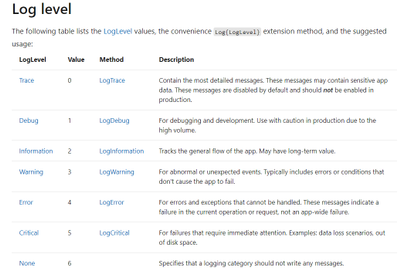
How to log the same information using Perfview/Dotnet Trace or any other ETW based data capturing tools?
For logging the same information we saw in the stdout log using Perfview/dotnet-trace, we need to make sure that “Event Source” logging provider is enabled.
This can be done by using the Generic host and then call CreateDefaultBuilder in Program.cs, which adds the following logging providers:
- Console
- Debug
- EventSource
- EventLog: Windows only
Just like below:

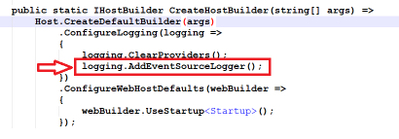
Sometimes, we override the default set of logging added by Host.CreateDefaultBuilder by calling ClearProviders() in “ConfigureLogging” method to add additional logging providers like Azure Application Insights etc. In that case, if we want to collect ETW based traces, then its necessary to add “logging.AddEventSourceLogger()” like below:
Next step is to add “Logging” in AppSettings.json and defining log levels. If we want debug level logs only for Event Source logging provider, we should add highlighted section as well:
{
“Logging”: {
“LogLevel”: {
“Default”: “Information”,
“Microsoft”: “Warning”,
“Microsoft.Hosting.Lifetime”: “Information”
},
“EventSource”: {
“LogLevel”: {
“Default”: “Debug”,
“Microsoft”: “Debug”,
“Microsoft.Hosting.Lifetime”: “Debug”
}
}
},
“AllowedHosts”: “*”
}
Once we make the above changes and capture Perfview/Dotnet-trace, the events would look like below when we analyze them:
LoggerName
|
Level
|
EventName
|
Microsoft.Extensions.Hosting.Internal.Host
|
1
|
Hosting starting
|
Microsoft.AspNetCore.Hosting.Diagnostics
|
1
|
Loaded hosting startup assembly ASPNETCORETEST
|
Microsoft.Hosting.Lifetime
|
2
|
Application started. Press Ctrl+C to shut down.
|
Microsoft.Hosting.Lifetime
|
2
|
Hosting environment: Development
|
Microsoft.Hosting.Lifetime
|
2
|
Content root path: C:UserssudixisourcereposASPNETCORETESTASPNETCORETEST
|
Microsoft.Extensions.Hosting.Internal.Host
|
1
|
Hosting started
|
Microsoft.AspNetCore.Hosting.Diagnostics
|
|
|
Microsoft.AspNetCore.Hosting.Diagnostics
|
2
|
Request starting HTTP/2.0 GET https://localhost:44338/
|
Microsoft.AspNetCore.HostFiltering.HostFilteringMiddleware
|
1
|
WildcardDetected
|
Microsoft.AspNetCore.Routing.Matching.DfaMatcher
|
1
|
CandidatesFound
|
Microsoft.AspNetCore.Routing.EndpointRoutingMiddleware
|
1
|
MatchSuccess
|
Microsoft.AspNetCore.Routing.EndpointMiddleware
|
2
|
ExecutingEndpoint
|
Microsoft.AspNetCore.Routing.EndpointMiddleware
|
2
|
ExecutedEndpoint
|
Microsoft.AspNetCore.Hosting.Diagnostics
|
2
|
Request finished in 113.6961ms 200
|
Microsoft.AspNetCore.Hosting.Diagnostics
|
|
|
Microsoft.AspNetCore.Hosting.Diagnostics
|
|
|
Microsoft.AspNetCore.Hosting.Diagnostics
|
2
|
Request starting HTTP/2.0 GET https://localhost:44338/favicon.ico
|
Microsoft.AspNetCore.Routing.Matching.DfaMatcher
|
1
|
CandidatesNotFound
|
Microsoft.AspNetCore.Routing.EndpointRoutingMiddleware
|
1
|
MatchFailure
|
Microsoft.AspNetCore.Hosting.Diagnostics
|
2
|
Request finished in 6.7227ms 404
|
Microsoft.AspNetCore.Hosting.Diagnostics
|
|
|
When collecting Perfview, we should make sure to provider add the string *Microsoft-Extensions-Logging in the additional [Please do not miss * at the beginning] for Perfview to collect events emitted by Event Source Logging provider:
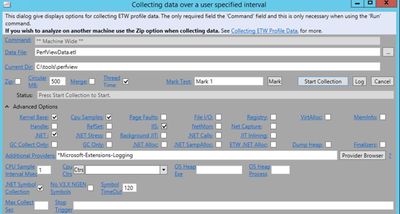
Using dotnet-trace, we can collect the Event Source emitted events by running below commands:
Sample commands to get started:
Capture basic CPU samples with .NET and ASP.NET Core events:
dotnet-trace collect –profile cpu-sampling –providers Microsoft-Extensions-Logging:4:5 -p ###
Capture basic CPU samples with .NET, ANC & Kestrel, Sys.Net.Http, and TPL Task events:
dotnet-trace collect –profile cpu-sampling –providers Microsoft-Extensions-Logging:4:5,Microsoft-AspNetCore-Server-Kestrel,Microsoft-System-Net-Http,System-Threading-Tasks-TplEventSource::5 -p ###
For additional references: Logging in .NET Core and ASP.NET Core | Microsoft Docs
Hope this helps!
by Contributed | Apr 23, 2021 | Technology
This article is contributed. See the original author and article here.
Explore how Excel & Power BI are best used together and how Excel & Power BI can be integrated in Microsoft Teams & SharePoint Online.
Join our partner, Thorogood, for this Free and Virtual Power BI and Excel workshop!
Register here: Modern Excel Analyst in a Day – June 8, 2021

 bitlocker recovery keys in mem admin center


Recent Comments