by Contributed | Jun 25, 2021 | Technology
This article is contributed. See the original author and article here.
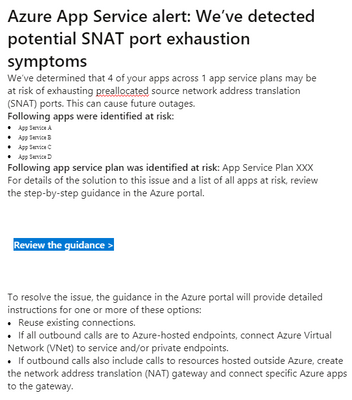
Recently Azure App Service users might receive email alert on potential SNAT Port Exhaustion risk of services. Here is a sample email.
This post is about looking at this alert rationally.
This alert alone does not mean there is a drop in availability or performance of our app services.
If we suspect the availability or performance of our app services degraded and SNAT Port Exhaustion is a possible reason for that, we can have a quick check if there were below symptoms correlated with the alert.
- Slow response times on all or some of the instances in a service plan.
- Intermittent 5xx or Bad Gateway errors
- Timeout error messages
- Could not connect to external endpoints (like SQLDB, Service Fabric, other App services etc.)
Because SNAT Port is consumed only when there are outbound connections from App Service Plan instances to public endpoints. If port exhausted, there must be delay or failure in those outbound calls. Above symptoms will help justify if we are on the right track looking into SNAT Port Exhaustion.
If we did observe slowness or failure in outbound calls that correlated with the email alert, we may refer to the guidance section mentioned in alert email and this document Troubleshooting intermittent outbound connection errors in Azure App Service – Azure App Service | Microsoft Docs for further troubleshooting.
by Contributed | Jun 24, 2021 | Technology
This article is contributed. See the original author and article here.
For years, a successful actuarial services company relied on a vital financial application that ran on Alpha hardware—a server well past its end-of-life date. To modernize its infrastructure with as little risk as possible, the company turned to Stromasys Inc., experts in cross-platform server virtualization solutions. In a matter of days, the company was running its mission-critical application on Azure. Soon after, it began to offer the software as a service (SaaS) to other companies, turning the formerly high-maintenance legacy software into a growing profit center.
The challenge of the not-so-modern mainframe
Aging servers are vulnerable servers. Stromasys was founded in 1998 with a mission to help companies running core applications on servers from an earlier generation, such as SPARC, VAX, Alpha, and HP 3000. With headquarters in Raleigh, North Carolina, Stromasys is a wholly owned subsidiary of Stromasys SA in Geneva, Switzerland. Its virtualization solutions are used by top organizations worldwide.
Stromasys developed a niche in the computer industry by recognizing the need for specialized virtualization environments that could replace servers nearing their end of life. Stromasys solutions can host applications designed for Solaris, VMS, Tru64 UNIX, and MPE/iX operating systems. By rehosting applications on Azure using emulation software—known as a lift-and-shift migration—organizations can safely phase out legacy hardware in a matter of days and immediately begin taking advantage of the scalability and flexibility of cloud computing.
The financial services industry has been among the first to adopt Stromasys server emulation solutions. A lift-and-shift approach is a quick, safe way to move legacy workloads to the cloud. Actuarial services are all about risk assessment, and the Stromasys customer knew it needed to reduce the risk associated with running mission-critical software on a decades-old Alpha system.
The legendary Digital Equipment Corporation (DEC) introduced the AlphaServer in 1994. Even after the system was officially retired in 2007, organizations around the world continued to trust the Alpha’s underlying OpenVMS and Tru64 UNIX operating systems for their proven stability. Stromasys saw an opportunity, and in 2006, it began offering an Alpha hardware emulation solution, Charon-AXP. Today, HP recognizes Charon-AXP as a valid Alpha replacement platform to run OpenVMS or Tru64.
The actuarial services company had kept its AlphaServer running through the years with help from user groups that located vintage hardware components. However, parts can be hard to find for any classic machine—from cars to computers.
“Our business had exclusively involved on-premises solutions,” explains Thomas Netherland, global head of Alliances & Channels at Stromasys. “So we were surprised and intrigued when the customer opted for the cloud. They simply did not want to be in the IT infrastructure business.”
The actuarial services company wanted to take advantage of the scalability, security, and other benefits that come with Azure. This is when Stromasys decided as a company to get serious about offering cloud-ready solutions.
“Stromasys solutions on Azure extend the lives of mission-critical legacy applications.”
– Thomas Netherland: global head of Alliances & Channels, Stromasys Inc.
Hardware emulation in a virtual environment
Stromasys and Microsoft worked together to find a solution for the actuarial services customer. Stromasys proposed using Charon-AXP, one of a family of legacy system cross-platform hypervisors. With this emulator, the customer could phase out its aging and increasingly expensive hardware and replace it quickly and safely with an enterprise-grade, virtual Alpha environment on Azure that uses an industry-standard x86 platform.
According to Dave Clements, a systems engineer at Stromasys, Charon means no risky migration projects. “There are no changes to the original software, operating system, or layered products—so no need for source code and no application recompile,” he says. In addition, the actuarial services company didn’t have to worry about recertifying its application, because the legacy code is untouched.
Charon-AXP creates a virtual Alpha environment on an Azure virtual machine (VM), which is used to isolate and manage the resources for a specific application on a single instance. Charon-AXP presents an Alpha hardware interface to the original Alpha software, which cannot detect a difference. After the user programs and data are copied to the VM, the legacy application continues to run unchanged.
The engineers didn’t know how well Charon-AXP would perform in the cloud, so they set up a proof-of-solution test. “We wanted to ensure that the Azure infrastructure processor speed was enough to compensate for the additional CPU overhead introduced by Charon,” says Netherland. Turns out, it wasn’t a problem. The clock speed of most legacy systems is on the order of hundreds of megahertz (MHz), as opposed to the several gigahertz (GHz) offered by VMs on Azure. Performance was the same or better.
The entire migration process, including the proof of solution test, took only two weeks.
The following image demonstrates the architectural differences:

“We like Azure because of the high processor speeds that are available and for the support available from Microsoft
and our reseller community.”
– Dave Clements: systems engineer, Stromasys Inc.
Architecture on Azure
The original application ran on a DEC Alpha ES40 server with four CPUs (1 GHz), 16 GB of RAM, and 400 GB of storage. The new architecture on Azure includes Charon-AXP for Windows on a VM with eight CPUs (3 GHz), 32 GB of RAM, and 500 GB of storage.
During proof-of-solution testing, Stromasys engineers created multiple virtual network interfaces to provide separate networks paths, depending on the type of user. One path is provisioned for Windows only, to give IT managers access for host configuration and management tasks. The other network path provides OpenVMS users and administrators access to the OpenVMS operating system and applications. This gives users access to their applications through their organization’s preferred type of connection—for example, Secure Shell (SSH), a virtual private network (VPN), or a public IP address.
“Two network interfaces keep the connections separate, which is our preference for security and ease of use,” explains Sandra Levitt, an engineer at Stromasys. “It lets users connect the way they’re used to.” A best practice is to configure the VM running Charon behind a jumpbox or a service, such as Azure Bastion, which uses Secure Sockets Layer (SSL) to provide access without any exposure through public IP addresses.
For this customer, the engineers set up a VPN to accelerate communications between the legacy operating system running in the company’s datacenter and Charon on Azure. Users connect to the VM running the application using remote desktop protocol (RDP).
The new architecture also improves the company’s business continuity. Azure Backup backs up the VMs, and the internal OpenVMS backup agents protect the application.
The following image demonstrates the Azure architecture:

“Our relationship with Microsoft started with this customer, and now we work closely with the Azure migration services team.
This partnership has really helped us succeed with our customers.”
– Dave Clements: systems engineer, Stromasys Inc.
A legacy is reinvented as SaaS
Before working with this customer, Stromasys hadn’t ventured far into the cloud. Running Charon-AXP on Azure showed Stromasys and the customer how a lift-and-shift migration can transform a legacy application. Azure provides a modern platform for security with storage that can expand and contract as the company’s usage varies, while the pay-as-you-go pricing makes Azure cost effective.
After the legacy application was running in a Charon-AXP emulator on Azure, the actuarial services company began offering its solution as a service to other financial companies. In effect, the company reinvented its mainframe application as a SaaS option. Two major insurance companies immediately signed up for this service.
“Their focus shifted from managing the hardware and software to just managing their real business,” says Clements. “All that without touching the legacy code.”
“Azure allows our customers to take full advantage of the benefits of a modern infrastructure.”
– Dave Clements: systems engineer, Stromasys Inc.
by Contributed | Jun 24, 2021 | Technology
This article is contributed. See the original author and article here.
Last week, on Monday June 14th, 2021, a new version of the Windows Security Events data connector reached public preview. This is the first data connector created leveraging the new generally available Azure Monitor Agent (AMA) and Data Collection Rules (DCR) features from the Azure Monitor ecosystem. As any other new feature in Azure Sentinel, I wanted to expedite the testing process and empower others in the InfoSec community through a lab environment to learn more about it.
In this post, I will talk about the new features of the new data connector and how to automate the deployment of an Azure Sentinel instance with the connector enabled, the creation and association of DCRs and installation of the AMA on a Windows workstation. This is an extension of a blog post I wrote, last year (2020), where I covered the collection of Windows security events via the Log Analytics Agent (Legacy).
Recommended Reading
I highly recommend reading the following blog posts to learn more about the announcement of the new Azure Monitor features and the Windows Security Events data connector:
Azure Sentinel To-Go!?
Azure Sentinel2Go is an open-source project maintained and developed by the Open Threat Research community to automate the deployment of an Azure Sentinel research lab and a data ingestion pipeline to consume pre-recorded datasets. Every environment I release through this initiative is an environment I use and test while performing research as part of my role in the MSTIC R&D team. Therefore, I am constantly trying to improve the deployment templates as I cover more scenarios. Feedback is greatly appreciated.
A New Version of the Windows Security Events Connector?
According to Microsoft docs, the Windows Security Events connector lets you stream security events from any Windows server (physical or virtual, on-premises or in any cloud) connected to your Azure Sentinel workspace. After last week, there are now two versions of this connector:
- Security events (legacy version): Based on the Log Analytics Agent (Usually known as the Microsoft Monitoring Agent (MMA) or Operations Management Suite (OMS) agent).
- Windows Security Events (new version): Based on the new Azure Monitor Agent (AMA).
In your Azure Sentinel data connector’s view, you can now see both connectors:

A New Version? What is New?
Data Connector Deployment
Besides using the Log Analytics Agent to collect and ship events, the old connector uses the Data Sources resource from the Log Analytics Workspace resource to set the collection tier of Windows security events.

The new connector, on the other hand, uses a combination of Data Connection Rules (DCR) and Data Connector Rules Association (DCRA). DCRs define what data to collect and where it should be sent. Here is where we can set it to send data to the log analytics workspace backing up our Azure Sentinel instance.

In order to apply a DCR to a virtual machine, one needs to create an association between the machine and the rule. A virtual machine may have an association with multiple DCRs, and a DCR may have multiple virtual machines associated with it.

For more detailed information about setting up the Windows Security Events connector with both Log Analytics Agent and Azure Monitor Agents manually, take a look at this document.
Data Collection Filtering Capabilities
The old connector is not flexible enough to choose what specific events to collect. For example, these are the only options to collect data from Windows machines with the old connector:
- All events – All Windows security and AppLocker events.
- Common – A standard set of events for auditing purposes. The Common event set may contain some types of events that aren’t so common. This is because the main point of the Common set is to reduce the volume of events to a more manageable level, while still maintaining full audit trail capability.
- Minimal – A small set of events that might indicate potential threats. This set does not contain a full audit trail. It covers only events that might indicate a successful breach, and other important events that have very low rates of occurrence.
- None – No security or AppLocker events. (This setting is used to disable the connector.)
According to Microsoft docs, these are the pre-defined security event collection groups depending on the tier set:

On the other hand, the new connector allows custom data collection via XPath queries. These XPath queries are defined during the creation of the data collection rule and are written in the form of LogName!XPathQuery. Here are a few examples:
- Collect only Security events with Event ID = 4624
Security!*[System[(EventID=4624)]]
- Collect only Security events with Event ID = 4624 or Security Events with Event ID = 4688
Security!*[System[(EventID=4624 or EventID=4688)]]
- Collect only Security events with Event ID = 4688 and with a process name of consent.exe.
Security!*[System[(EventID=4688)]] and *[EventData[Data[@Name=’ProcessName’]=’C:WindowsSystem32consent.exe’]]
You can select the custom option to select which events to stream:

Important!
Based on the new connector docs, make sure to query only Windows Security and AppLocker logs. Events from other Windows logs, or from security logs from other environments, may not adhere to the Windows Security Events schema and won’t be parsed properly, in which case they won’t be ingested to your workspace.
Also, the Azure Monitor agent supports XPath queries for XPath version 1.0 only. I recommend reading the Xpath 1.0 Limitation documentation before writing XPath Queries.
XPath?
XPath stands for XML (Extensible Markup Language) Path language, and it is used to explore and model XML documents as a tree of nodes. Nodes can be represented as elements, attributes, and text.
In the image below, we can see a few node examples in the XML representation of a Windows security event:

XPath Queries?
XPath queries are used to search for patterns in XML documents and leverage path expressions and predicates to find a node or filter specific nodes that contain a specific value. Wildcards such as ‘*’ and ‘@’ are used to select nodes and predicates are always embedded in square brackets “[]”.
Matching any element node with ‘*’
Using our previous Windows Security event XML example, we can process Windows Security events using the wildcard ‘*’ at the `Element` node level.
The example below walks through two ‘Element’ nodes to get to the ‘Text’ node of value ‘4688’.

You can test this basic ‘XPath’ query via PowerShell.
- Open a PowerShell console as ‘Administrator’.
- Use the Get-WinEvent command to pass the XPath query.
- Use the ‘Logname’ parameter to define what event channel to run the query against.
- Use the ‘FilterXPath’ parameter to set the XPath query.
Get-WinEvent -LogName Security -FilterXPath ‘*[System[EventID=4688]]

Matching any attribute node with ‘@’
As shown before, ‘Element’ nodes can contain ‘Attributes’ and we can use the wildcard ‘@’ to search for ‘Text’ nodes at the ‘Attribute’ node level. The example below extends the previous one and adds a filter to search for a specific ‘Attribute’ node that contains the following text: ‘C:WindowsSystem32cmd.exe’.

Once again, you can test the XPath query via PowerShell as Administrator.
$XPathQuery = “*[System[EventID=4688]] and *[EventData[Data[@Name=’ParentProcessName’]=’C:WindowsSystem32cmd.exe’]]”
Get-WinEvent -LogName Security -FilterXPath $XPathQuery

Can I Use XPath Queries in Event Viewer?
Every time you add a filter through the Event Viewer UI, you can also get to the XPath query representation of the filter. The XPath query is part of a QueryList node which allows you to define and run multiple queries at once.

We can take our previous example where we searched for a specific attribute and run it through the Event Viewer Filter XML UI.
<QueryList>
    <Query Id=”0″ Path=”Security”>
        <Select Path=”Security”>*[System[(EventID=4688)]] and *[EventData[Data[@Name=’ParentProcessName’]=’C:WindowsSystem32cmd.exe’]]</Select>
    </Query>
</QueryList>

Now that we have covered some of the main changes and features of the new version of the Windows Security Events data connector, it is time to show you how to create a lab environment for you to test your own XPath queries for research purposes and before pushing them to production.
Deploy Lab Environment
- Identify the right Azure resources to deploy.
- Create deployment template.
- Run deployment template.
Identify the Right Azure Resources to Deploy
As mentioned earlier in this post, the old connector uses the Data Sources resource from the Log Analytics Workspace resource to set the collection tier of Windows security events.
This is the Azure Resource Manager (ARM) template I use in Azure-Sentinel2Go to set it up:
Azure-Sentinel2Go/securityEvents.json at master · OTRF/Azure-Sentinel2Go (github.com)
Data Sources Azure Resource
{
  “type”: “Microsoft.OperationalInsights/workspaces/dataSources”,
  “apiVersion”: “2020-03-01-preview”,
  “location”: “eastus”,
  “name”: “WORKSPACE/SecurityInsightsSecurityEventCollectionConfiguration”,
  “kind”: “SecurityInsightsSecurityEventCollectionConfiguration”,
  “properties”: {
    “tier”: “All”,
    “tierSetMethod”: “Custom”
  }
}
However, the new connector uses a combination of Data Connection Rules (DCR) and Data Connector Rules Association (DCRA).
This is the ARM template I use to create data collection rules:
Azure-Sentinel2Go/creation-azureresource.json at master · OTRF/Azure-Sentinel2Go (github.com)
Data Collection Rules Azure Resource
{
  “type”: “microsoft.insights/dataCollectionRules”,
  “apiVersion”: “2019-11-01-preview”,
  “name”: “WindowsDCR”,
  “location”: “eastus”,
  “tags”: {
    “createdBy”: “Sentinel”
  },
  “properties”: {
    “dataSources”: {
      “windowsEventLogs”: [
        {
          “name”: “eventLogsDataSource”,
          “scheduledTransferPeriod”: “PT5M”,
          “streams”: [
            “Microsoft-SecurityEvent”
          ],
          “xPathQueries”: [
            “Security!*[System[(EventID=4624)]]”
          ]
        }
      ]
    },
    “destinations”: {
      “logAnalytics”: [
        {
          “name”: “SecurityEvent”,
          “workspaceId”: “AZURE-SENTINEL-WORKSPACEID”,
          “workspaceResourceId”: “AZURE-SENTINEL-WORKSPACERESOURCEID”
        }
      ]
    },
    “dataFlows”: [
      {
        “streams”: [
          “Microsoft-SecurityEvent”
        ],
        “destinations”: [
          “SecurityEvent”
        ]
      }
    ]
  }
}
One additional step in the setup of the new connector is the association of the DCR with Virtual Machines.
This is the ARM template I use to create DCRAs:
Azure-Sentinel2Go/association.json at master · OTRF/Azure-Sentinel2Go (github.com)
Data Collection Rule Associations Azure Resource
{
  “name”: “WORKSTATION5/microsoft.insights/WindowsDCR”,
“type”: “Microsoft.Compute/virtualMachines/providers/dataCollectionRuleAssociations”,
  “apiVersion”: “2019-11-01-preview”,
  “location”: “eastus”,
   “properties”: {
“description”: “Association of data collection rule. Deleting this association will break the data collection for this virtual machine.”,
    “dataCollectionRuleId”: “DATACOLLECTIONRULEID”
   }
}
What about the XPath Queries?
As shown in the previous section, the XPath query is part of the “dataSources” section of the data collection rule resource. It is defined under the ‘windowsEventLogs’ data source type.
“dataSources”: {
  “windowsEventLogs”: [
    {
      “name”: “eventLogsDataSource”,
      “scheduledTransferPeriod”: “PT5M”,
      “streams”: [
        “Microsoft-SecurityEvent”
      ],
      “xPathQueries”: [
        “Security!*[System[(EventID=4624)]]”
      ]
    }
  ]
}
Create Deployment Template
We can easily add all those ARM templates to an ‘Azure Sentinel & Win10 Workstation’ basic template. We just need to make sure we install the Azure Monitor Agent instead of the Log Analytics one, and enable the system-assigned managed identity in the Azure VM.
Template Resource List to Deploy:
- Azure Sentinel Instance
- Windows Virtual Machine
- Azure Monitor Agent Installed.
- System-assigned managed identity Enabled.
- Data Collection Rule
- Log Analytics Workspace ID
- Log Analytics Workspace Resource ID
- Data Collection Rule Association
- Data Collection Rule ID
- Windows Virtual Machine Resource Name
The following ARM template can be used for our first basic scenario:
Azure-Sentinel2Go/Win10-DCR-AzureResource.json at master · OTRF/Azure-Sentinel2Go (github.com)
Run Deployment Template
You can deploy the ARM template via a “Deploy to Azure” button or via Azure CLI.
“Deploy to Azure” Button
- Browse to Azure Sentinel2Go repository
- Go to grocery-list/Win10/demos.
- Click on the “Deploy to Azure” button next to “Azure Sentinel + Win10 + DCR (DCR Resource)”

- Fill out the required parameters:
- adminUsername: admin user to create in the Windows workstation.
- adminPassword: password for admin user.
- allowedIPAddresses: Public IP address to restrict access to the lab environment.
- Wait 5-10 mins and your environment should be ready.
Azure CLI
- Download demo template.
- Open a terminal where you can run Azure CLI from (i.e. PowerShell).
- Log in to your Azure Tenant locally.
az login
- Create Resource Group (Optional)
az group create -n AzSentinelDemo -l eastus
- Deploy ARM template locally.
az deployment group create –f ./ Win10-DCR-AzureResource.json -g MYRESOURCRGROUP –adminUsername MYUSER –adminPassword MYUSERPASSWORD –allowedIPAddresses x.x.x.x
- Wait 5-10 mins and your environment should be ready.
Whether you use the UI or the CLI, you can monitor your deployment by going to Resource Group > Deployments:


Verify Lab Resources
Once your environment is deployed successfully, I recommend verifying every resource that was deployed.
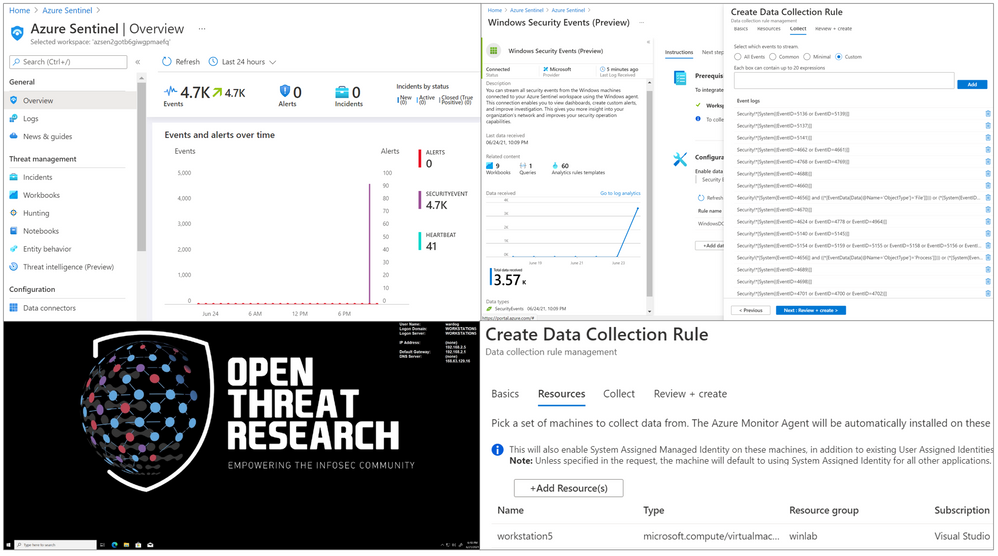
Azure Sentinel New Data Connector
You will see the Windows Security Events (Preview) data connector enabled with a custom Data Collection Rules (DCR):

If you edit the custom DCR, you will see the XPath query and the resource that it got associated with. The image below shows the association of the DCR with a machine named workstation5.

You can also see that the data collection is set to custom and, for this example, we only set the event stream to collect events with Event ID 4624.

Windows Workstation
I recommend to RDP to the Windows Workstation by using its Public IP Address. Go to your resource group and select the Azure VM. You should see the public IP address to the right of the screen. This would generate authentication events which will be captured by the custom DCR associated with the endpoint.

Check Azure Sentinel Logs
Go back to your Azure Sentinel, and you should start seeing some events on the Overview page:

Go to Logs and run the following KQL query:
SecurityEvent
| summarize count() by EventID
As you can see in the image below, only events with Event ID 4624 were collected by the Azure Monitor Agent.

You might be asking yourself, “Who would only want to collect events with Event ID 4624 from a Windows endpoint?”. Believe it or not, there are network environments where due to bandwidth constraints, they can only collect certain events. Therefore, this custom filtering capability is amazing and very useful to cover more use cases and even save storage!
Any Good XPath Queries Repositories in the InfoSec Community?
Now that we know the internals of the new connector and how to deploy a simple lab environment, we can test multiple XPath queries depending on your organization and research use cases and bandwidth constraints. There are a few projects that you can use.
Palantir WEF Subscriptions
One of many repositories out there that contain XPath queries is the ‘windows-event-forwarding’ project from Palantir. The XPath queries are Inside of the Windows Event Forwarding (WEF) subscriptions. We could take all the subscriptions and parse them programmatically to extract all the XPath queries saving them in a format that can be used to be part of the automatic deployment.
You can run the following steps in this document available in Azure Sentinel To-go and extract XPath queries from the Palantir project.
Azure-Sentinel2Go/README.md at master · OTRF/Azure-Sentinel2Go (github.com)
OSSEM Detection Model + ATT&CK Data Sources
From a community perspective, another great resource you can use to extract XPath Queries from is the Open Source Security Event Metadata (OSSEM) Detection Model (DM) project. A community driven effort to help researchers model attack behaviors from a data perspective and share relationships identified in security events across several operating systems.
One of the use cases from this initiative is to map all security events in the project to the new ‘Data Sources’ objects provided by the MITRE ATT&CK framework. In the image below, we can see how the OSSEM DM project provides an interactive document (.CSV) for researchers to explore the mappings (Research output):

One of the advantages of this project over others is that all its data relationships are in YAML format which makes it easy to translate to others formats. For example, XML. We can use the Event IDs defined in each data relationship documented in OSSEM DM and create XML files with XPath queries in them.
Exploring OSSEM DM Relationships (YAML Files)
Let’s say we want to use relationships related to scheduled jobs in Windows.

Translate YAML files to XML Query Lists
We can process all the YAML files and export the data in an XML files. One thing that I like about this OSSEM DM use case is that we can group the XML files by ATT&CK data sources. This can help organizations organize their data collection in a way that can be mapped to detections or other ATT&CK based frameworks internally.
We can use the QueryList format to document all ‘scheduled jobs relationships‘ XPath queries in one XML file.

I like to document my XPath queries first in this format because it expedites the validation process of the XPath queries locally on a Windows endpoint. You can use that XML file in a PowerShell command to query Windows Security events and make sure there are not syntax issues:
[xml]$scheduledjobs = get-content .scheduled-job.xml
Get-WinEvent -FilterXml $scheduledjobs

Translate XML Query Lists to DCR Data Source:
Finally, once the XPath queries have been validated, we could simply extract them from the XML files and put them in a format that could be used in ARM templates to create DCRs. Do you remember the dataSources property of the DCR Azure resource we talked about earlier? What if we could get the values of the windowsEventLogs data source directly from a file instead of hardcoding them in an ARM template? The example below is how it was previously being hardcoded.
“dataSources”: {
  “windowsEventLogs”: [
    {
      “name”: “eventLogsDataSource”,
      “scheduledTransferPeriod”: “PT5M”,
      “streams”: [
        “Microsoft-SecurityEvent”
      ],
      “xPathQueries”: [
        “Security!*[System[(EventID=4624)]]”
      ]
    }
  ]
}
We could use the XML files created after processing OSSEM DM relationships mapped to ATT&CK data sources and creating the following document. We can pass the URL of the document as a parameter in an ARM template to deploy our lab environment:
Azure-Sentinel2Go/ossem-attack.json at master · OTRF/Azure-Sentinel2Go (github.com)
Wait! How Do You Create the Document?
The OSSEM team is contributing and maintaining the JSON file from the previous section in the Azure Sentinel2Go repository. However, if you want to go through the whole process on your own, Jose Rodriguez (@Cyb3rpandah) was kind enough to write every single step to get to that output file in the following blog post:
OSSEM Detection Model: Leveraging Data Relationships to Generate Windows Event XPath Queries (openthreatresearch.com)
Ok, But, How Do I Pass the JSON file to our Initial ARM template?
In our initial ARM template, we had the XPath query as an ARM template variable as shown in the image below.

We could also have it as a template parameter. However, it is not flexible enough to define multiple DCRs or even update the whole DCR Data Source object (Think about future coverage beyond Windows logs).
Data Collection Rules – CREATE API
For more complex use cases, I would use the DCR Create API. This can be executed via a PowerShell script which can also be used inside of an ARM template via deployment scripts. Keep in mind that, the deployment script resource requires an identity to execute the script. This managed identity of type user-assigned can be created at deployment time and used to create the DCRs programmatically.
PowerShell Script
If you have an Azure Sentinel instance without the data connector enabled, you can use the following PowerShell script to create DCRs in it. This is good for testing and it also works in ARM templates.
Keep in mind, that you would need to have a file where you can define the structure of the windowsEventLogs data source object used in the creation of DCRs. We created that in the previous section remember? Here is where we can use the OSSEM Detection Model XPath Queries File ;)
Azure-Sentinel2Go/ossem-attack.json at master · OTRF/Azure-Sentinel2Go (github.com)
FileExample.json
{
  “windowsEventLogs”:  [
    {
      “Name”:  “eventLogsDataSource”,
      “scheduledTransferPeriod”:  “PT1M”,
      “streams”:  [
        “Microsoft-SecurityEvent”
      ],
      “xPathQueries”:  [
        “Security!*[System[(EventID=5141)]]”,
        “Security!*[System[(EventID=5137)]]”,
        “Security!*[System[(EventID=5136 or EventID=5139)]]”,
        “Security!*[System[(EventID=4688)]]”,
        “Security!*[System[(EventID=4660)]]”,
        “Security!*[System[(EventID=4656 or EventID=4661)]]”,
        “Security!*[System[(EventID=4670)]]”
       ]
    }
  ]
}
Run Script
Once you have a JSON file similar to the one in the previous section, you can run the script from a PowerShell console:
.Create-DataCollectionRules.ps1 -WorkspaceId xxxx -WorkspaceResourceId xxxx -ResourceGroup MYGROUP -Kind Windows -DataCollectionRuleName WinDCR -DataSourcesFile FileExample.json -Location eastus –verbose
One thing to remember is that you can only have 10 Data Collection rules. That is different than XPath queries inside of one DCR. If you attempt to create more than 10 DCRs, you will get the following error message:
ERROR

VERBOSE: @{Headers=System.Object[]; Version=1.1; StatusCode=400; Method=PUT;
Content={“error”:{“code”:”InvalidPayload”,”message”:”Data collection rule is invalid”,”details”:[{“code”:”InvalidProperty”,”message”:”‘Data Sources. Windows Event Logs’ item count should be 10 or less. Specified list has 11 items.”,”target”:”Properties.DataSources.WindowsEventLogs”}]}}}
Also, if you have duplicate XPath queries in one DCR, you would get the following message:
ERROR
VERBOSE: @{Headers=System.Object[]; Version=1.1; StatusCode=400; Method=PUT;
Content={“error”:{“code”:”InvalidPayload”,”message”:”Data collection rule is invalid”,”details”:[{“code”:”InvalidDataSource”,”message”:”‘X Path Queries’ items must be unique (case-insensitively).

Duplicate names:
Security!*[System[(EventID=4688)]],Security!*[System[(EventID=4656)]].”,”target”:”Properties.DataSources.WindowsEventLogs[0].XPathQueries”}]}}}
ARM Template: DeploymentScript Resource
Now that you know how to use a PowerShell script to create DCRs directly to your Azure Sentinel instance, we can use it inside of an ARM template and make it point to the JSON file that contains all the XPath queries in the right format contributed by the OSSEM DM project.
This is the template I use to put it all together:
Azure-Sentinel2Go/Win10-DCR-DeploymentScript.json at master · OTRF/Azure-Sentinel2Go (github.com)
What about the DCR Associations?
You still need to associate the DCR with a virtual machine. However, we can keep doing that within the template leveraging the DCRAs Azure resource linked template inside of the main template. Just in case you were wondering how I call the linked template from the main template, I do it this way:
Azure-Sentinel2Go/Win10-DCR-DeploymentScript.json at master · OTRF/Azure-Sentinel2Go (github.com)

How Do I Deploy the New Template?
The same way how we deployed the initial one. If you want the Easy Button , then simply browse to the URL below and click on the blue button highlighted in the image below:
Link: Azure-Sentinel2Go/grocery-list/Win10/demos at master · OTRF/Azure-Sentinel2Go (github.com)

Wait 5-10 mins!

Enjoy it!

That’s it! You now know two ways to deploy and test the new data connector and Data Collection Rules features with XPath queries capabilities. I hope this was useful. Those were all my notes while testing and developing templates to create a lab environment so that you could also expedite the testing process!
Feedback is greatly appreciated! Thank you to the OSSEM team and the Open Threat Research (OTR) community for helping us operationalize the research they share with the community! Thank you, Jose Rodriguez.
Demo Links
References
by Contributed | Jun 24, 2021 | Technology
This article is contributed. See the original author and article here.
Article contributed by Excelero: Kevin Guinn, Systems Engineer and Kirill Shoikhet, Chief Technical Officer at Excelero.
Azure offers Virtual Machines (VMs) with local NVMe drives that deliver a tremendous amount of performance. These local NVMe drives are ephemeral, so if the VM fails or is deallocated, the data on the drives will no longer be available. Excelero NVMesh provides a means of protecting and sharing data on these drives, making their performance readily available, without risking data longevity. This blog provides in-depth technical information about the performance and scalability of volumes generated on Azure HBv3 VMs with this software-defined-storage layer.
The main conclusion is that the Excelero NVMesh transforms available Azure compute resources into a storage layer on par with typical on-premises HPC cluster storage. With testing as wide as 24 nodes and 2,880 cores, latencies, bandwidth and IO/s levels scale well. Note that 24 nodes is not a limit for scalability as an Azure virtual machine scale set can accommodate up to 1000 VMs (300 if using InfiniBand) in a single tenant. This enables running HPC and AI workloads at any scale, in addition to workloads such as data analytics, with the most demanding IO patterns in an efficient manner without data loss risk.
Azure HBv3 VMs
Microsoft have recently announced HBv3 virtual machines for HPC. These combine AMD EPYC 7003 “Milan” cores with 448 GB of RAM, RDMA-enabled 200 Gbps InfiniBand networking and two 960 GB local NVMe drives to provide unprecedented HPC capabilities anywhere, on-prem or cloud environment. The InfiniBand adapter supports the same standard NVIDIA OpenFabrics Enterprise Distribution (OFED) driver and libraries that are available for bare-metal servers. Similarly, the two NVMe drives are serviced as they would be on bare-metal servers, using NVMe-Direct technology.
The combination of a high bandwidth and low-latency RDMA network fabric and local NVMe drives makes these virtual machines an ideal choice for Excelero NVMesh.
HBv3 virtual machines come in several flavors differentiated by the number of cores available. For simplicity, VMs with the maximum of 120 cores were used throughout these tests.
Excelero NVMesh
Excelero provides breakthrough solutions for the most demanding public and private cloud workloads and provides customers with a reliable, cost-effective, scalable, high-performance storage solution for artificial intelligence, machine learning, high-performance computing, database acceleration and analytics workloads. Excelero’s software brings a new level of storage capabilities to public clouds, paving a smooth transition path for such IO-intensive workloads from on-premises to public clouds supporting digital transformation.
Excelero’s flagship product NVMesh transforms NVMe drives into enterprise-grade protected storage that supports any local or distributed file system. Featuring data-center scalability, NVMesh provides logical volumes with data protection and continuous monitoring of the stored data for reliability. High-performance computing, artificial intelligence and database applications enjoy ultra-low latency with 20 times faster data processing, high-performance throughput of terabytes per second and millions of IOs per second per compute node. As a 100% software-based solution, NVMesh is the only container-native storage solution for IO-intensive workloads for Kubernetes. These capabilities make NVMesh an optimal storage solution that drastically reduces the storage cost of ownership.
Excelero NVMesh on Azure
With up to 120 cores, HBv3 VMs are well suited for running NVMesh in a converged topology, where each node runs both storage services and the application stack for the workloads. Millions of IO/s and 10s of GB/s of storage can be delivered with most of the CPU power available for the application layer.
To ensure proper low-latency InfiniBand connectivity, all members of an NVMesh cluster must either be in a Virtual Machine Scale Set or provisioned within the same Availability Set. The InfiniBand driver and OFED can be installed using the InfiniBand Driver Extension for Linux, or there are HPC-optimized Linux operating system images on the Azure marketplace that have it included.
NVMesh leverages the InfiniBand network to aggregate the capacity and performance of the local NVMe drives on each VM into a shared pool, and optionally allows the creation of protected volumes that greatly reduce the chance of data loss in the event that a drive or VM is disconnected.
Considerations for HBv3 and Excelero NVMesh
For the tests described in this paper, Standard_HB120-32rs_v3 VMs were built with the OpenLogic CentOS-HPC 8_1-gen2 version 8.1.2021020401 image. This image features:
- Release: CentOS 8.1
- Kernel: 4.18.0-147.8.1.el8_1.x86_64l
- NVIDIA OFED: 5.2-1.0.4.0
Excelero NVMesh management servers require MongoDB 4.2 and NodeJS 12 as prerequisites. To provide resilience for the management function in the event of a VM failure or deallocation, three nodes were selected for management, and a MongoDB replica set, consisting of those three nodes, was used to store the management databases.
Deployment Steps
Excelero NVMesh can be deployed manually or through its Azure marketplace image. For these tests, we used automation from the AzureHPC toolset to set up the cluster and then ran Ansible automation to deploy Excelero NVMesh and get the 24-node cluster up in minutes. The Azure HPC toolset deployed a headnode and created a Virtual Machine Scale Set containing 24 nodes in 10-15 minutes. These nodes are automatically configured for access from the headnode and within the cluster using ssh keys and no prompting, and we executed a script that disables SELinux after the VMs are provisioned. To fully disable SELinux, the VMs were restarted. While they were restarting, it was a good time to set up the hosts file, specify the group variables, and install the prerequisite Ansible galaxy collections. All of that was able to be completed in less than 5 minutes, after which the Ansible playbook was executed. The Ansible playbook sets up the nodes for the roles specified in the hosts file. For management nodes, this includes building a MongoDB replica set, installing Node.JS, and installing and configuring the NVMesh management service. For target nodes, the NVMesh core and utilities packages are installed, and the nvmesh.conf file is populated based on the specified variables and management hosts. (The last two lines in the configuration file below are not currently within the scope of the Ansible playbook, and need to be added manually.) The Ansible playbook completed in 15-20 minutes, so allowing for the manual steps to finalize the configuration file, access the UI, accept the end-user license agreement, and format the NVMe drives to be used by NVMesh, it is possible to have a fully deployed and operational cluster with software-defined storage in less than an hour.
With this method of deployment, the headnode was used to access and manage the cluster. The headnode has a public IP, and hosts a NFS share that provides a home drive that facilitates replicating key configurations and data among the nodes. In each test cluster, NVMesh management was installed on the first 3 nodes and all nodes served both as NVMesh targets and as NVMesh clients consuming IO. In the case of the four-node cluster, four additional clients were provisioned to increase the workload.
The nvmesh.conf configuration file used is as follows.
# NVMesh configuration file
# This configuration file is utilized by Excelero NVMesh(r) applications for various options.

# Define the management protocol
# MANAGEMENT_PROTOCOL="<https/http>"

MANAGEMENT_PROTOCOL="https"

# Define the location of the NVMesh Management Websocket servers
# MANAGEMENT_SERVERS="<server name or IP>:<port>,<server name or IP>:<port>,..."

MANAGEMENT_SERVERS="compute000000:4001,compute000001:4001,compute000002:4001"

# Define the nics that will be available for NVMesh Client/Target to work with
# CONFIGURED_NICS="<interface name;interface name;...>"

CONFIGURED_NICS="ib0"

# Define the IP of the nic to use for NVMf target
# NVMF_IP="<nic IP>"
# Must not be empty in case of using NVMf target

NVMF_IP=""
MLX5_RDDA_ENABLED="No"
TOMA_CLOUD_MODE="Yes"
AGENT_CLOUD_MODE="Yes"
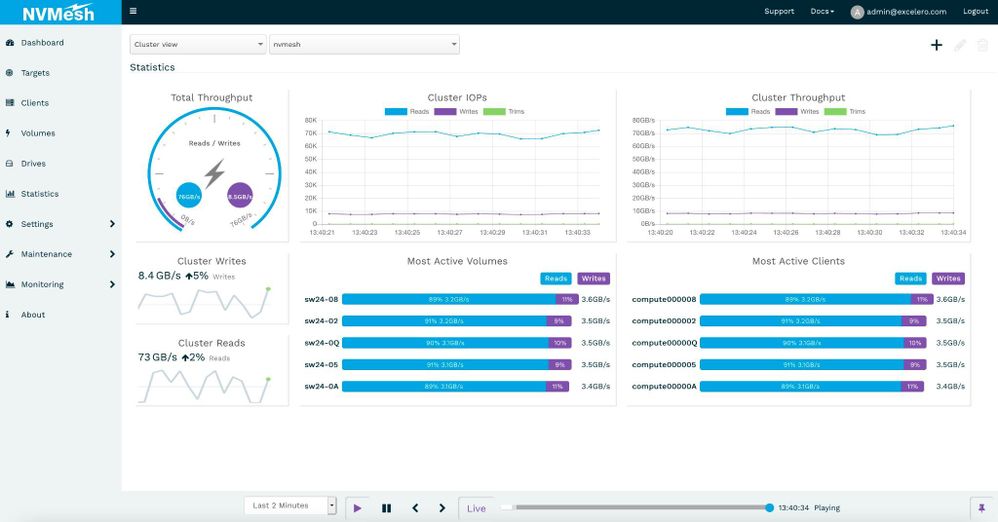
Performance was steady and consistent across workloads. Image 1 is a screenshot captured with a workload of random 1 MB operations run at a 90% read to 10% write ratio.
Image 1. 20x IO compute nodes consuming 3.5 GB/s of IO each with a 90/10 read/write ratio.
Synthetic Storage Benchmarks
Block Device Level
As Excelero NVMesh provides virtual volumes, we began with a synthetic block storage benchmark, using FIO. We covered a range of block sizes and data operation types using direct I/O operations against a variety of scales. We measured typical performance parameters as well as latency outliers that are of major importance for larger scale workloads, especially ones where tasks are completed synchronously across nodes.
Table 1 describes the inputs used for the measurements while the graphs below show the results.
Block Size
|
Operation
|
Jobs
|
Outstanding IO /
Queue Depth
|
4 KB
|
Read
|
64
|
64
|
Write
|
8 KB
|
Read
|
Write
|
64 KB
|
Read
|
8
|
Write
|
1 M
|
Read
|
8
|
4
|
Write
|
Table 1
4-node Cluster
With the 4-node cluster, we pooled the 8 NVMe drives and created unique mirrored volumes for each client node. To better demonstrate the effectiveness of NVMesh in serving remote NVMe, 4 additional VM were configured as clients only, without contributing drives or storage services for the test. NVMesh is known for its ability to achieve the same level of performance on a single shared volume or across multiple private volumes. With an eye toward establishing a baseline from which scalability could be assessed, we ran synthetic IO from various sets of these clients concurrently.
Graph 1 shows performance results for 4 KB and 8 KB random reads with 64 jobs and 64 outstanding IOs run on each client node on the NVMesh virtual volumes. The 4-node cluster consistently demonstrated over 4 million IOPS. The system was able to sustain this rate as additional client nodes were utilized as IO consumers.

Graph 1, random read IO/s scale well and remain consistent as more load is put on the system.
Graph 2 presents performance results for 4 KB and 8 KB random writes performed from 64 jobs, each with 64 outstanding IOs, run on each node. The system is able to sustain the same overall performance even as load rises with an increasing number of storage consumers.

Graph 2, random writes IO/s remain consistently high as more load is put on the system.
Graph 3 presents performance results for 64 KB random reads performed from 64 jobs with 8 outstanding IO each per node and results for 1 MB reads from 8 jobs each with 4 outstanding IOs.
Graph 4 presents the performance for the equivalent writes. Again, system performance remains steady as the number of nodes generating the load is increased.

Graph 3, performance of large random reads also remains steady showing the consistency of the system across all components.

Graph 4, system performance with large random writes is consistent under increasing load.
8-node Cluster
For the 8-node cluster, we pooled all 16 drives, and created 8 discrete mirrored volumes, one for each client node. The same IO patterns demonstrated on the 4-node cluster were tested again in order to determine how scaling the cluster would impact IO performance. Graphs 5, 6, 7 and 8 below provide the same tests run across this larger number of target nodes.

Graph 5, random 4 KB and 8 KB read IO/s scale well and remain consistent as more load is put on the system.

Graph 6, random 4 KB and 8 KB writes IO/s remain consistently high as more load is put on the system. 3 nodes are needed to saturate the system.

Graph 7, performance of larger random reads, of 64 KB and 1 MB, also remains steady showing the consistency of the system across all components.

Graph 8, system performance with large random writes of 64 KB and 1 MB is also mostly consistent under increasing load.
24-node Cluster
For the 24-node cluster, we pooled all 48 drives and then carved out 24 discrete volumes, one for each client node.
We ran the set of synthetic IO workloads to various sub-clusters as IO consumers. Each measurement was done 3 times, 60 seconds each time.
Graph 9 shows the performance results for random 4 KB and 8 KB reads with 64 jobs and 64 outstanding IOs for each job, run on each node consuming IO. The number of nodes participating was varied. With 3 times the nodes and drives serving IO compared to the 8-node cluster, the 24-nodes continues to scale almost linearly and demonstrates over 23 million 4 KB random read IOPS, which is almost 3 times the IOPS observed with the 8-node cluster. It was also able to sustain this rate with various amounts of client nodes utilized as IO consumers.

Graph 9, outstanding levels of IO/s are made possible with the 24-node cluster
Graph 10 depicts the performance results when employing random writes instead of reads.

Graph 10, random 4 KB and 8 KB writes IO/s remain consistently high as more load is put on the system. 12-16 nodes are needed to saturate the system.
Graph 11 presents performance results for 64 KB random reads with 64 jobs and 8 outstanding IO per consuming node and 1m random reads with 8 jobs and 4 outstanding IOs. With 4 consumers, we see 80 GB/s congruent with a single node capable of 20 GB/s with its HDR link.

Graph 11, performance of larger random reads, of 64 KB and 1 MB, also remains steady showing the consistency of the system across all components. With 5 nodes, the system is already saturated. With over 100 GB/s of bandwidth readily available even for random operations, this is a powerful tool for many Azure’s public cloud HPC use cases.
Graph 12 depicts results for 64 KB random writes with 64 jobs and 8 outstanding IO per consuming node and 1 MB random writes with 8 jobs and 4 outstanding IOs. With 4 consumers, we already see that write performance is maximized at around 25 GB/s consistent with single drive performance capped at around 1 GB/s per drive.

Graph 12, system performance with large random writes of 64 KB and 1 MB is also consistent under increasing load. This write capability complements the reads from the previous graph to provide a compelling platform for public cloud HPC use cases.
Conclusions
Excelero NVMesh compliments Azure HBv3 virtual machines, adding data protection to mitigate against job disruptions that may otherwise occur when a VM with ephemeral NVMe drives is deallocated while taking full advantage of a pool of NVMe-direct drives across several VM instances. Deployment and configuration time is modest, allowing cloud spending to be focused on valuable job execution activities.
The synthetic storage benchmarks demonstrate how Excelero NVMesh efficiently enables the performance of NVMe drives across VM instances to be utilized and shared. As the number of nodes consuming IO is increased, the system performance remains consistent. The results also show linear scalability: as additional target nodes are added, the system performance increases with the number of targets providing drives to the pool.
by Contributed | Jun 24, 2021 | Technology
This article is contributed. See the original author and article here.
Windows 11, version 21H2 hardware driver submissions for Windows Hardware Compatibility Program (WHCP) are now being accepted at the Partner Center for Windows Hardware. The updated version of the Windows Hardware Lab Kit (HLK), along with updated playlists for testing Windows 11, version 21H2 hardware may be downloaded from Hardware Lab Kit. As with previous releases of the HLK, this version is intended for exclusive testing for Windows 11, version 21H2. Previous version of the HLK remain available at HLK Kits.
Windows 11, version 21H2 WHCP Playlists
The table below illustrates the playlists needed for testing each architecture: Link – HLKPlaylist
Testing Target Architecture
|
Applicable Playlist(s)
|
x64
|
HLK Version 21H2 CompatPlaylist x64 ARM64.xml
|
ARM64*
|
HLK Version 21H2 CompatPlaylist x64 ARM64.xml
HLK Version 21H2 CompatPlaylist ARM64_x86_on_ARM64.xml
HLK Version 21H2 CompatPlaylist ARM64_x64_on_ARM64.xml
|
*Testing for ARM64 requires validation in a separate mode for each playlist. Please refer to the HLK ARM64 Getting Started Guide for details on ARM64 HLK client setup and playlist use.
Windows 11, version 21H2 – Submissions on Hardware Dev Center
When making WHCP submissions for the Windows 11, version 21H2 certification, use the following target in Partner Center:
Submission Target
|
Windows Hardware Compatibility Program – Client, version 21H2
|
Windows 11, version 21H2 based systems may ship with drivers that have achieved compatibility with Windows 10, version 2004 until September 24, 2021.
Partners looking to achieve compatibility for systems shipping with Windows 11, version 21H2 Release may factory-install drivers for components that achieved compatibility with Windows 10, version 2004 until September 24, 2021.
Errata 81316 is available to filter the “System Logo Check” failure seen when testing Windows 11, version 21H2 based systems with Windows 10, Version 2004 qualified drivers. To apply, download the latest errata filter package.

Recent Comments