by Contributed | Jun 22, 2021 | Technology
This article is contributed. See the original author and article here.
Two months ago, we announced the public preview of a new set of capabilities that would give Microsoft Defender for Endpoint customers visibility over unmanaged devices running on their networks. It’s devices like these that introduce some of the greatest risks to an organization’s cybersecurity posture.
“The riskiest threat is the one you don’t know about. Unmanaged devices are literally one of your weakest links.
Smart attackers go there first.” – David Weston, Microsoft Director of Enterprise and OS Security
We are pleased to announce that starting today, these capabilities are generally available to all our customers worldwide!
With this release we deliver a rich set of new capabilities, including:
- Discovery of endpoints and network devices connected to your corporate network
This capability provides Defender for Endpoint with the ability to discover unmanaged workstations, servers, and mobile endpoints (Windows, Linux, macOS, iOS, and Android) that haven’t been onboarded and secured. Additionally, network devices (e.g.: switches, routers, firewalls, WLAN controllers, VPN gateways and others) can be discovered and added to the device inventory using periodic authenticated scans of preconfigured network devices.
- Onboard discovered devices and secure them using integrated workflows
Once discovered, unmanaged endpoint and network devices connected to your networks can be onboarded to Defender for Endpoint. Integrated new workflows and new security recommendations in the threat and vulnerability management experience make it easy to onboard and secure these devices.
- Review assessments and address threats and vulnerabilities on newly discovered devices
Once endpoints and network devices have been discovered, assessments can be run using Defender for Endpoint’s threat and vulnerability management capabilities. These security recommendations can be used to address issues on devices helping to reduce an organization’s threat and risk exposure.
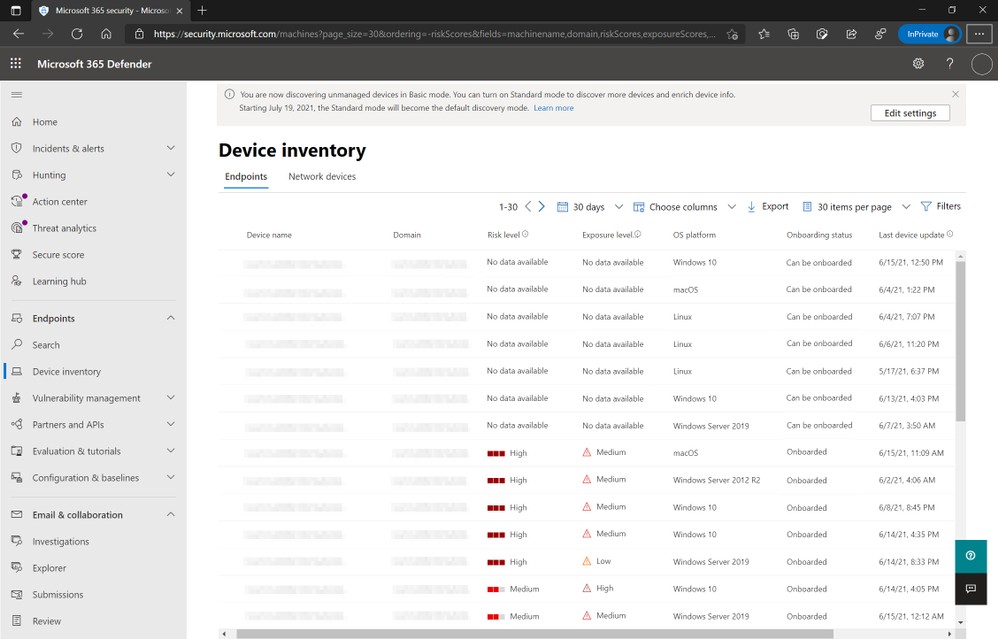
Now that these features have reached general availability, you will notice that endpoint discovery is already enabled on your tenant. This is indicated by a banner that appears in the EndpointsDevice inventory section of the Microsoft 365 Defender console.
Figure 1: Device inventory view listing “Can be onboarded” devices and option to enable Standard Mode discovery.
This banner will be available until July 19, 2021 which is when the default behavior for discovery will be switched from Basic to Standard. At this time, Standard discovery will enable the collection of a broader range of device related properties and it will also perform improved device classification. The switch to Standard mode was verified as having negligible network implications during the public preview. More information about the discovery and its two modes can be found in our previous blog.
We’re excited for you to take a look and start using these capabilities and we look forward to your feedback on them. If you have any questions or feedback feel free to leave them in the comment section below. For more information please review the device discovery and network discovery documentations on Microsoft Docs.
To read more about our new device discovery and assessment capabilities, check out:
Microsoft Defender for Endpoint is an industry-leading, cloud-powered endpoint security solution offering vulnerability management, endpoint protection, endpoint detection and response, and mobile threat defense. With our solution, threats are no match. If you are not yet taking advantage of Microsoft’s unrivaled threat optics and proven capabilities, sign up for a free trial of Microsoft Defender for Endpoint today.

by Contributed | Jun 22, 2021 | Technology
This article is contributed. See the original author and article here.
Ever since IT Pros started building servers, we’ve been monitoring them – Are they operational? Are they responsive? Are they running out of disk space? The challenge is … who is monitoring the monitoring? While it’s common to send notifications to email, automatically create a helpdesk service ticket or even post an alert in a Microsoft Teams channel, I have to watch those other systems to know if a monitoring alert has fired (activated). Instead, I wanted a visual indicator that my monitoring has detected a problem, so I turned to my Phillips LIFX strip light.
LIFX strip light
Previously, you needed to wrangle the LIFX HTTP API to achieve this integration with Azure Monitor, and this IT Pro doesn’t speak API. But LIFX is now available as connector (in Preview) for Azure Logic Apps, so we can tie this integration together in a no-code solution!
The Architecture
In essence, we’re building an architecture that looks like:
Monitor + Alert Threshold + Action Group (Action) + Logic App (Light state)
It pays to plan this out first, as it’s a little easier to build it out of order.
For this example, I’m going to configure:
Virtual Machine CPU greater than 50% – Flash the light strip purple
Service Health issue – set the light to solid red
While this won’t be an in-depth look into monitoring scenarios, you can go an explore metric alerts, log alerts and activity alerts to go beyond VM performance and include other Microsoft services. I like adding in Service Health too as those alerts work well for platform-wide components like Azure Active Directory or the general service that’s running your resource type. And with Azure Lighthouse, you can include alerting from different Azure tenants or for different customers you manage.
I’m keeping it simple with a flash or solid and a color choice for each alert. You might decide to use a flash pattern for warnings and a solid color change for your critical alerts, and maybe blues for your test & development resources and reds for your production resources.
Now let’s build the different steps!
Virtual Machine CPU over 50% – Flash the light purple
Create a Logic App with a LIFX Action
In Azure Logic Apps, created a new Logic App (consumption). Give it a name such as LIFX-FlashPurple and select a resource group and region. Click Create to make this new Azure resource. Once the deployment is complete, click the Go to resource button. This will take you into the Logic Apps Designer. Choose the Azure Monitor Metrics Alert Handler, then choose this template.
 Logic Apps Designer has a built-in template for Azure Monitor Metrics alerts
The template adds the sample data for a metrics alert generated by Azure Monitor. On the “Remember to include a Content-Type header” message, click Got it, as the metric alerts already include this.
 JSON sample for the Azure Monitor Metrics Alert
So now we have the trigger defined so Logic Apps knows what the data will look like that it is being sent when it needs to fire (run).
Click New Step to add our action. In the search box type LIFX
Choose “Pulse effect by quickly flashing between the given colors (Preview)”
 Some of the LIFX actions
Sign in to your LIFX account and authorise the LIFX Custom Connector for Power Automate by LIFX to have access to your LIFX account.
 The LIFX Authorise Application box
Then, choose the lights from those listed from your account.
Select the color you want to flash to, the duration (Period) that color will stay on (e.g. 5 seconds), how many times you want it to flash (Cycles) and whether you want to turn the light on if it was off.

This changes my light between its original color and purple 10 times, each time leaving it on a color for 5 seconds.
Create an Action Group that includes the Logic App
In Azure Monitor, click the Actions pane and then the Manage actions button.
Click New action group. Give it a name and select a Resource Group.
You can leave the Notifications tab blank, as we won’t send any other notification that this action group has been triggered.
Click the Actions tab. Set the Action type to Logic App and select the LIFX-FlashPurple logic app you previously created. Click Review + Create, then Create.

Create an Azure Monitor Metric Alert
In Azure Monitor, in the Alerts pane, click New Alert Rule.
Under Scope, click select resource and find your virtual machine.
Under Condition, click Add condition.
Add the Percentage CPU signal and set a Static threshold where the Operator is Greater than and an Aggregation type of Average has a Threshold value of 50. Evaluated based on an Aggregation granularity (Period) of 5 minutes and a 1 Minute Frequency of evaluation. Here we are asking Azure Monitor to run an evaluation every minute, and average the CPU percentage (usage) over the previous 5 minutes, then fire an alert if that number is greater than 50%. You can use whatever numbers you want – try a lower value like 10 percent to test that it works, and you should be able to trigger the alert by rebooting your virtual machine and running Windows Updates.

In the Actions section, click Add action group and select the LIFX-Flash action group you created in the previous step.
Give the alert rule a name e.g. CPU over 50pc, then click Create alert rule.
Now we have our Logic App to flash the light purple, added to an Action Group that the Azure Monitor metric alert will call when the specific threshold is reached!
 We have an Azure Monitor alert!
Service Health Alert – set the light to solid red
This previous example is great for a alerting on a specific metric on one resource. But what if there’s a problem with the Azure Virtual Machines service in general (or any other Azure service you choose)? We can use similar steps to change our light if Azure Service Health reports an issue, using Service Health Alerts and Logic Apps.
Create a Logic App for a Service Health alert to set the LIFX light to solid red
In Azure Logic Apps, created a new Logic App (consumption). Give it a name such as LIFX-SolidRed and select a resource group and region. Click Create to make this new Azure resource. Once the deployment is complete, click the Go to resource button. This will take you into the Logic Apps Designer. Choose When a HTTP request is received, then click Use sample payload to generate schema.

Copy and paste the JSON code from the Service Health webhook example here: https://docs.microsoft.com/azure/azure-monitor/alerts/activity-log-alerts-webhook#servicehealth
Click New Step to add our action and choose LIFX (or search for it).
Choose Set state of the lights (Preview)
Choose the lights from those listed from your account.
Set the power to on. Select the color you want to change the light to (e.g. red), set the Brightness (up to a value of 1.0 for full brightness) and set the Duration to 0.
This will turn the light red and leave it that color. Click Save. Now we have a solid red action for our smart light.

Create a Service Health alert
In Azure Service Health, click Health alerts then Add service health alert.
Under Condition, select the Subscription and Services you want – we’ll select Virtual Machines for this example. Leave the Global Region selected and add any specific regions where you have resources.
Under Service health criteria, select the event types you wish to alert on – Service issue, planned maintenance, health advisories or security advisory (and you can select multiple event types).
Under Actions, click Add action groups and Create action group. Select a resource group and give your action group a name (like LIFX-Red-AG). In Action type, choose Logic App and select your LIFX-SolidRed logic app you created in the previous step. Click Review + Create, then Create.

Back on the Service Health alert page, give it a name (like Service-Health-LIFXRed) and click Create alert.
If Azure Service Health issues an alert for the Virtual Machines service in my region or globally, the LIFX strip will turn red and stay red!
Summary
Now you have the building blocks of Azure Monitor, Service Health alerts, Logic Apps and the LIFX connector, what other scenarios would you “bring to light”? Remember, Azure Monitor can query non-Azure resources with Azure Arc, and there are many other trigger sources for Logic Apps (including Microsoft and non-Microsoft products).
Scott Hanselman uses the LIFX API and the Microsoft Graph to change his home office light to indicate his presence status from Microsoft Teams (busy, available etc.) For more details, visit https://www.hanselman.com/blog/mirroring-your-presence-status-from-the-microsoft-graph-in-teams-to-lifx-or-hue-bias-lighting
And, the LIFX Connectors (in Preview) are also available in Power Automate! So you can explore lighting up other triggers from other systems and parts of your business process, if you don’t use Azure Logic Apps. Maybe change your light if a message is posted into a particular Microsoft Teams channel?
Share your use cases in the comments!
Learn More with Microsoft Learn
Monitor the usage, performance and availability of resources with Azure Monitor
Build automated workflows to integrate data and apps with Azure Logic Apps
Get started with Power Automate
by Contributed | Jun 22, 2021 | Technology
This article is contributed. See the original author and article here.
In this installment of the weekly discussion revolving around the latest news and topics on Microsoft 365, hosts – Vesa Juvonen (Microsoft) | @vesajuvonen, Waldek Mastykarz (Microsoft) | @waldekm are joined by Seattle-based Program Manager from OneDrive and SharePoint (ODSP) engineering – Nicole Woon (Microsoft) | @NovelNicole . Topics discussed in this episode include: Nicole’s product – SharePoint site templates. The importance and Making products approachable to both the most advanced developer and to someone new to the product. Customer connection and delivering capabilities based on an understanding of human behavior and using “craft” for high-quality product development. A strategy for learning everything necessary to excel as a technical support engineer, being an accessibility champ and thriving as a woman in IT.
Covering also 21 new articles from Microsoft and the Community from past week!
Please remember to keep on providing us feedback on how we can help on this journey. We always welcome feedback on making the community more inclusive and diverse.
This session was recorded on Monday, June 21, 2021, and it is the last episode until we return from summer holiday to kick off Season 4 – Episode 133, sometime around end of August. Thank you for watching and listening, we hope you have a happy and safe summer. Please note: There will be no break in our regularly delivered Thursday M365/SharePoint Community calls and calls from other organizations.
These videos and podcasts are published each week and are intended to be roughly 45 – 60 minutes in length. Please do give us feedback on this video and podcast series and also do let us know if you have done something cool/useful so that we can cover that in the next weekly summary! The easiest way to let us know is to share your work on Twitter and add the hashtag #PnPWeekly. We are always on the lookout for refreshingly new content. “Sharing is caring!”
Here are all the links and people mentioned in this recording. Thanks, everyone for your contributions to the community!
Microsoft articles:
Community articles:
Additional resources:
If you’d like to hear from a specific community member in an upcoming recording and/or have specific questions for Microsoft 365 engineering or visitors – please let us know. We will do our best to address your requests or questions.
“Sharing is caring!”
by Contributed | Jun 21, 2021 | Technology
This article is contributed. See the original author and article here.
Companies collaborate with hundreds of clients, partners, and vendors every day. Today’s organizations use many applications and devices, and managing digital identities for these guests increases the risk of security breaches. More than 40% of IT leaders said that they want an identity governance solution that improves their security posture, according to an internal Microsoft survey.
These decision-makers’ top concern is the increased risk of security breaches due to distributed access to company resources. This problem is exacerbated as more companies adopt hybrid work and require secure collaboration with external users. IT admins have no way to track usage or answer the following questions:
- What content are users interacting with?
- How long have the resources been shared?
- Are accounts still active?
- Are user privileges at risk of expiring?
Organizations can manage guest access with automated reviews
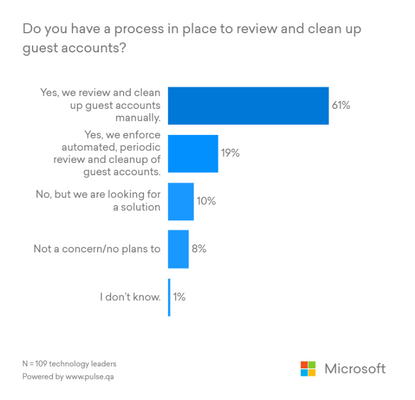
More than 70% of survey respondents said they either don’t have a process for managing guest accounts or they manually manage guest accounts. Manual processes often involve reliance on custom scripts or middleware, increasing the chance of human error that leads to elevated security risk. Also, an IT admin can never know all of the external users who require access to company resources. Business managers are the ones who are best suited for identity and access management activities for their guests and external partners.

Figure 1: Access review features enable customers to securely manage guest access at scale.
An Azure Active Directory Identity Governance solution empowers Microsoft customers to securely collaborate with guests across organizational boundaries. Customers can set up automated, periodic access reviews using an intuitive interface that provides smart recommendations, ensuring that guests gain the right access to the right resources for the right amount of time.
Once guests no longer require access to sensitive data, companies can automatically revoke their access to those resources. If a business owner or a manager isn’t in Azure AD, guests can review their own membership in a group.
Automated provisioning and deprovisioning of guest access to sensitive data enables customers to move away from custom scripts and reduces errors associated with manual processes Automated provisioning and de-provisioning of guest access into SaaS applications ensures that the only way guests can access these apps is through permissions set up by the organization and not decisions made on a case-by-case basis by an IT admin.
In large organizations, business managers are best suited to manage guest access for collaboration. Azure AD governance features put control firmly in the hands of business managers who are best suited to provide appropriate levels of access to sensitive data to external users. By delegating to non-administrators, customers can ensure that the right people are managing access to their department’s sensitive data. Delegation of responsibility reduces the IT helpdesk burden and frees up the IT staff for more strategic initiatives.
The response from Azure AD governance customers has been positive:
“Azure Active Directory guest access reviews give us that ability to be agile in our collaboration with external parties, with the right level of control, so our security, legal, and data privacy people are comfortable.” ~ Avanade
Microsoft customers in regulated industries and those that work with the government have to regularly demonstrate to auditors the effectiveness of their controls over access rights. Azure AD access reviews for guests enable these customers to easily prove to auditors that their organization has the appropriate controls in place. Azure AD provides a centralized view of all access reviews with a simple interface involving very few configuration steps, enabling IT admins to see which resources a user can or cannot access across a multi-cloud, multi-device, and fragmented application landscape.
Watch our video review of guest user access across all Microsoft 365 groups and Microsoft Teams for a step-by-step overview of Azure AD Access Reviews. To learn more about Microsoft Identity Governance solutions, visit our website.
Learn more about Microsoft identity:

Recent Comments