by Contributed | Jul 23, 2021 | Technology
This article is contributed. See the original author and article here.
Both tools below – ProcDump and DebugDiag – work similarly: they can attach themselves as debuggers to a process, then, when the machine is on high-CPU, collect one or more memory dump(s) from that specific process.
Note that the tools won’t “know” what process is consuming the CPU unless we dig deeper in the performance counters. If using ProcDump, it easier if we are sure ahead of time what’s the culprit – the process that is “eating” much CPU.
Both tools need administrative rights to be run.
DebugDiag is the preferred tool, since it automates some steps, adds more explicit context, and includes automated memory dump analysis capabilities too.
Using the command-line ProcDump
ProcDump does not require installation. But one needs to be specific about the PID to which it is attaching. That PID needs to be determined prior to starting ProcDump. Debug Diag is able to determine the PID itself, if the Application Pool is specified.
- Download the tool and copy it on a disk folder, for example D:Temp-Dumps
https://docs.microsoft.com/en-us/sysinternals/downloads/procdump
- Open an administrative console, from where to run commands.
Navigate to where the ProcDump tool was placed (D:Temp-Dumps).
- Find the process ID, the PID, of the IIS w3wp.exe worker process executing your application.
From the administrative console, you can use AppCmd IIS tool to list processes for application pools:
C:WindowsSystem32InetSrvappcmd.exe list wp
- In the administrative console, start the following command to collect dumps (but don’t hit enter yet).
D:Temp-Dumps> procdump.exe -accepteula -ma -c 85 -n 3 -s 7 [PID]
You may want to redirect the console output of ProcDump to a file, to persist the recording of the encountered exceptions:
D:Temp-Dumps> procdump.exe -accepteula -ma -c 85 -n 3 -s 7 [PID] > Monitoring-log.txt
Replace [PID] with the actual Process ID integer number identified at the step 2.
Please make sure that there is enough disk space on the drive where dumps are collected. Each process dump will take space in the disk approximately the same size the process uses in memory (column Commit Size in Task Manager). For example, if the w3wp.exe process memory usage is ~1 GB, then the size of a dump file will be around 1 GB.
- Start reproducing the problem: issue requests that would render the process to consume CPU; or leave the command running until the high-CPU occurs.
- Please wait until all the dumps are written and then compress the files before uploading the dumps to the workspace.
Using the UI tool DebugDiag, Debug Diagnostics Collection
DebugDiag requires installation, but it is able to determine itself the whatever process instance – PID – happens to execute for an application pool at some point in time; even when that process may occasionally crash or be recycled, hence restarted with different PID.
#1.
Download Debug Diagnostic and install it on IIS machine:
https://www.microsoft.com/en-us/download/details.aspx?id=49924 v2.2 (if 32-bit system)
https://www.microsoft.com/en-us/download/details.aspx?id=102635 v2.3.1 (only supports 64-bit OS)
#2.
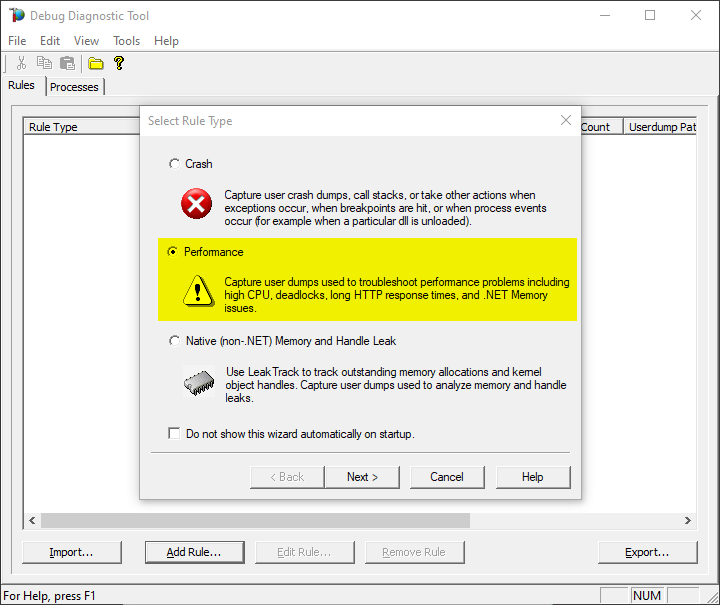
Create a new rule selecting Performance and then clicking on “Next” next button.
You also can create the rule by right-click and selecting “Add rule”, or clicking the “Add rule” button at the bottom.

#3.
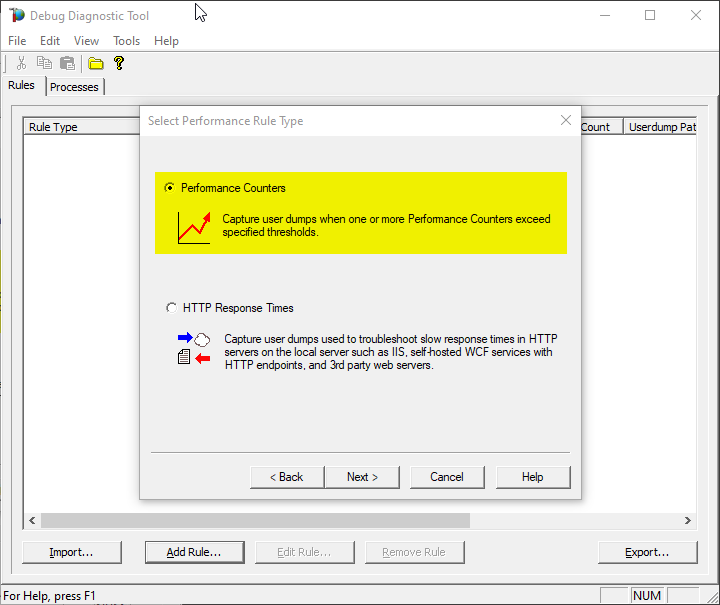
Select the second option “Performance Counters” and then “Next”.
#4.
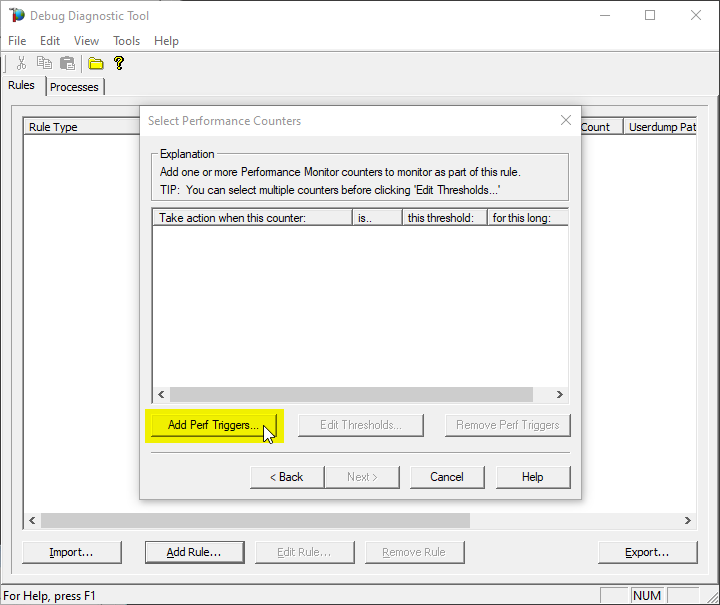
Click on Add Perf Triggers…
#5.
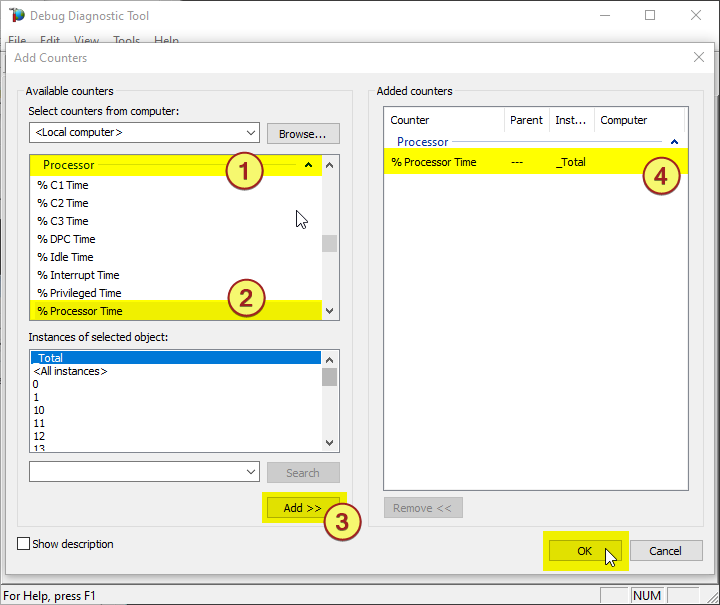
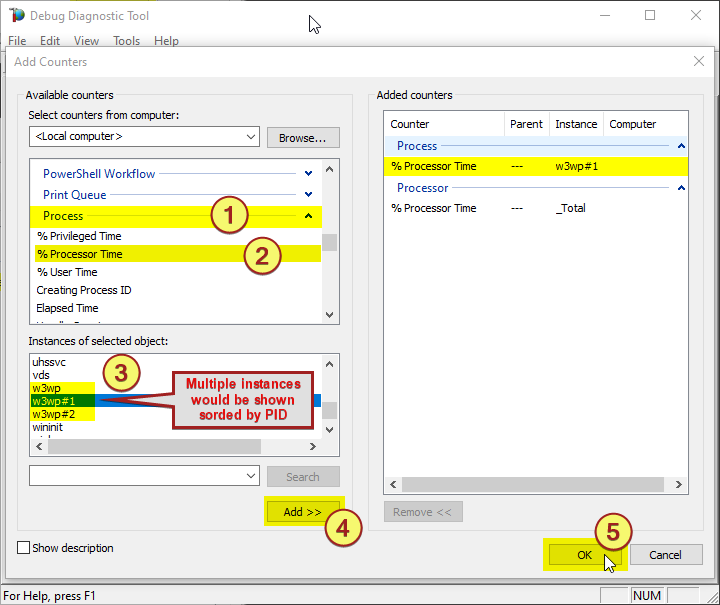
The select %Processor Time from the Processor category and select the _Total instance
Note:
You might need to determine the w3wp.exe#N instance by looking into the Task Manager, sorting by w3wp.exe PID.
Or use one of the following commands in an administrative command-line console, to find out the PIDs:
> C:WindowsSystem32InetSrvappcmd.exe list wp
> TaskList.exe | find “w3wp.exe” /i
> TaskList.exe /FI “IMAGENAME eq w3wp.exe”
#6.
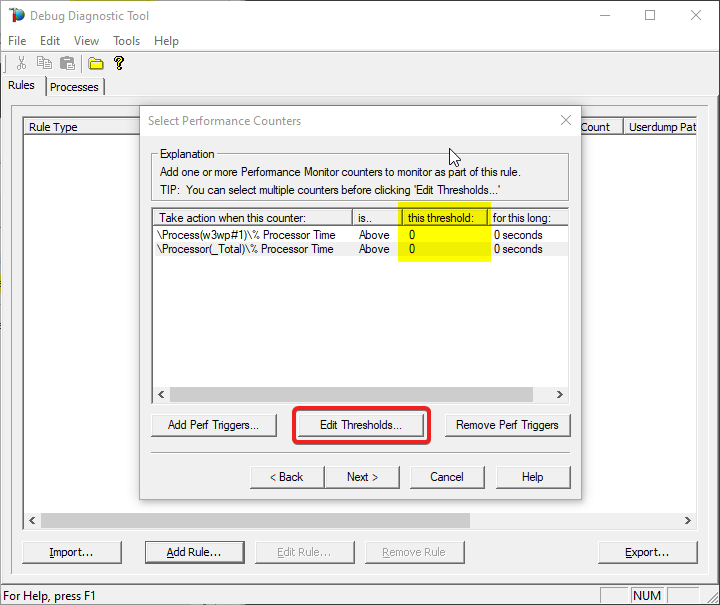
Select the action click on Edit Thresholds
#7.
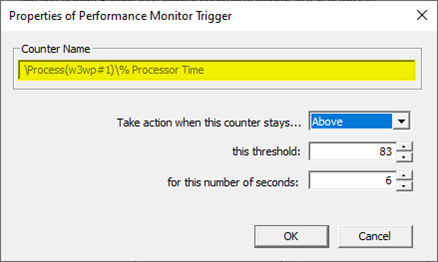
Select Above, set 80 as this threshold and 5 in for this number of seconds
You might need to adjust the threshold value to what you’re seeing on your system. You should know better how you define “High-CPU” (maybe, in your case, High-CPU means anything above 60%; your experience or expectations matter here).

#8.
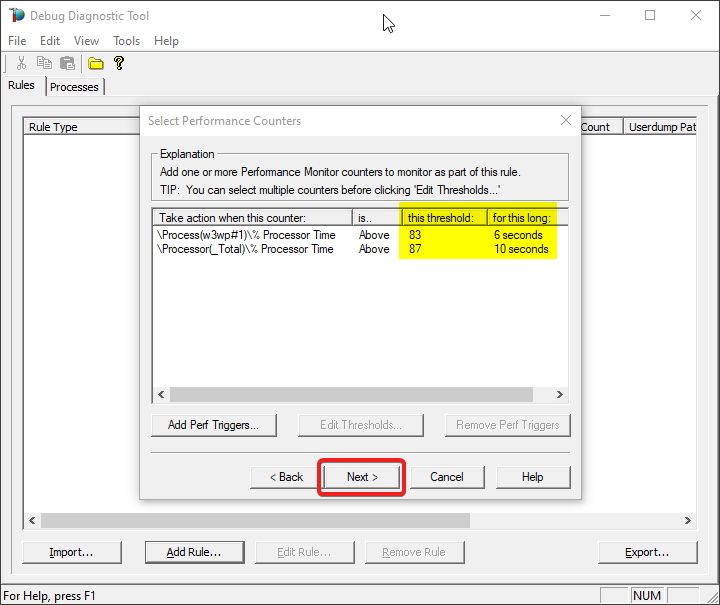
Click on Next
#9.
Click on Add Dump Target
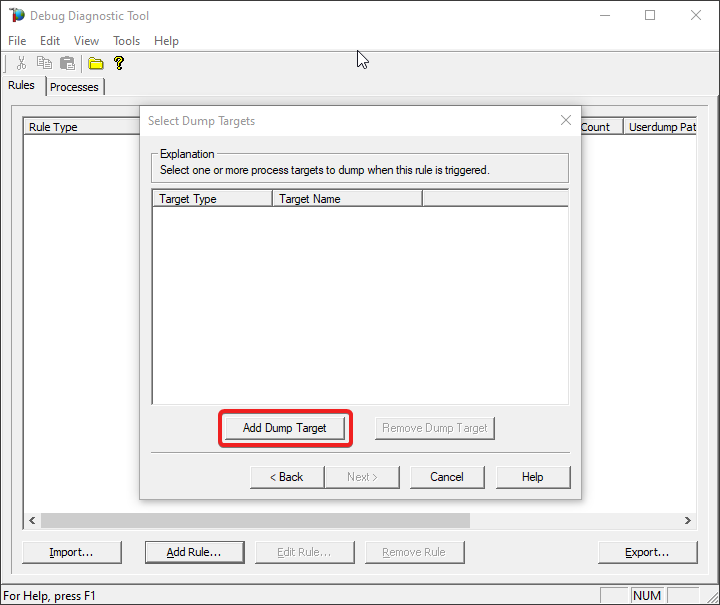
#10.
Select Web application pool as Target type and select the application pool
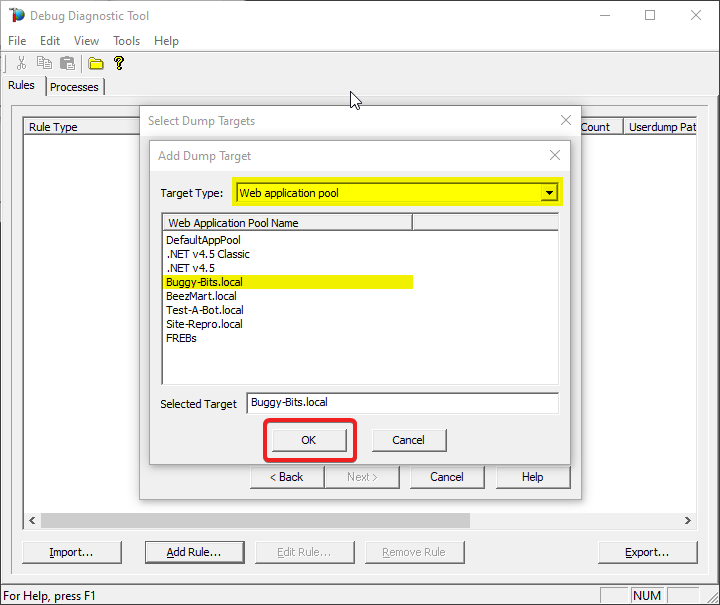
#11.
Click on Next
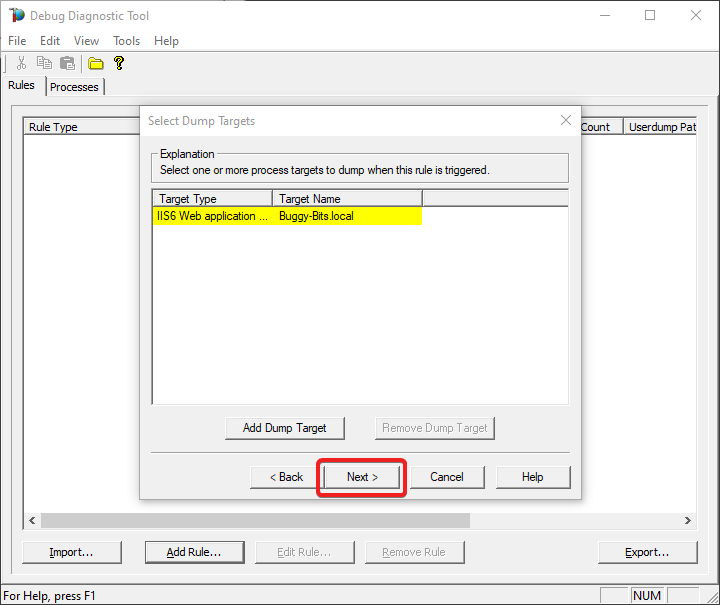
#12.
Set 10 seconds at Generate a UserDump every…
Set 3 at Stop after Generating…
Select Collect Full UserDumps.
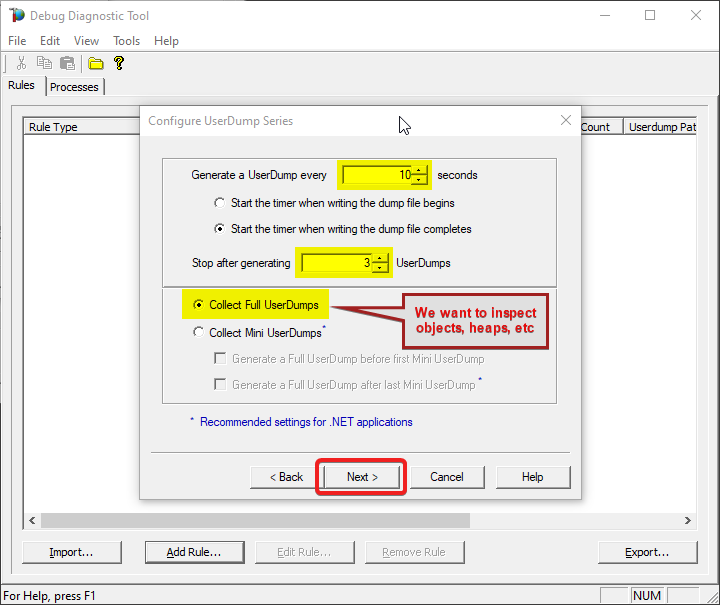
#13.
Type down a descriptive name, i.e. “My App eats a lot of CPU” and select the dump files path.
Keep in mind you’re collecting 4 dumps. Please make sure that there is enough disk space on the drive where dumps are collected. Each process dump will take space in the disk approximately the same size the process uses in memory (column Commit Size in Task Manager). For example, if the w3wp.exe process memory usage is ~2 GB, then the size of each dump file will be around 2 GB.
Do not choose a disk in network/UNC; choose a local disk.
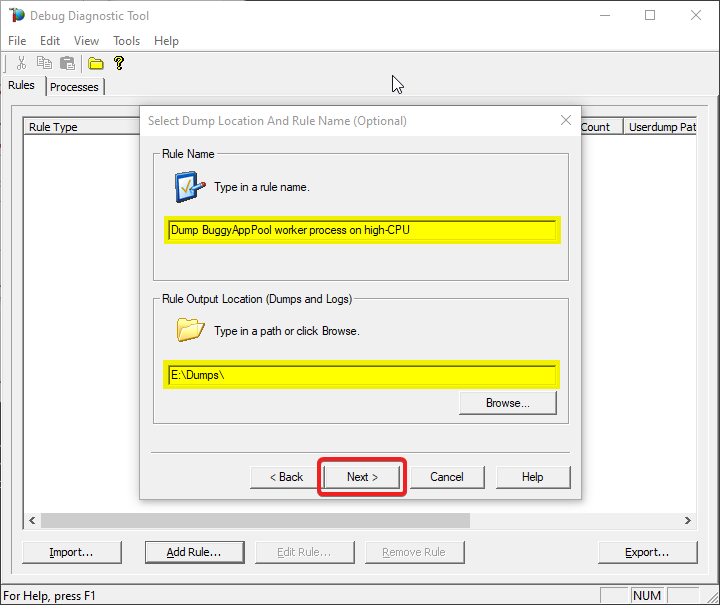
#14.
Select “Activate rule now” option and click on “Finish”
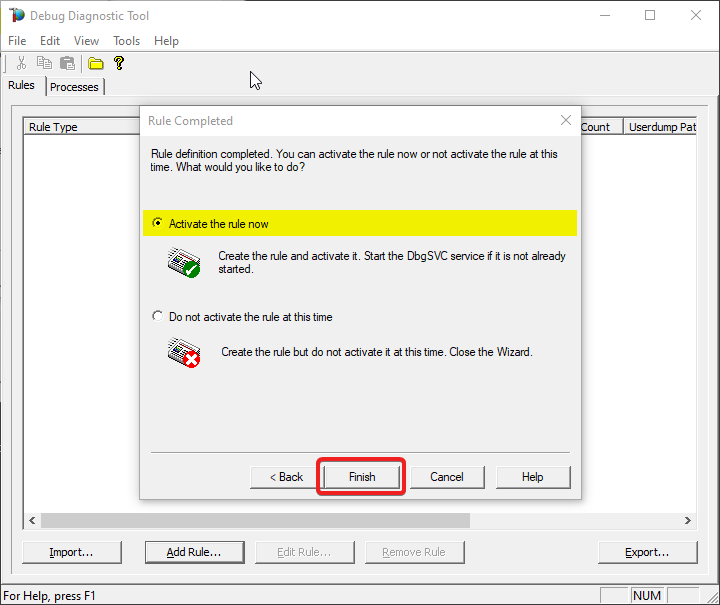
#15.
Watch the rule in DebugDiag; it should tell you how many dumps are collected (present in the selected dumps folder).
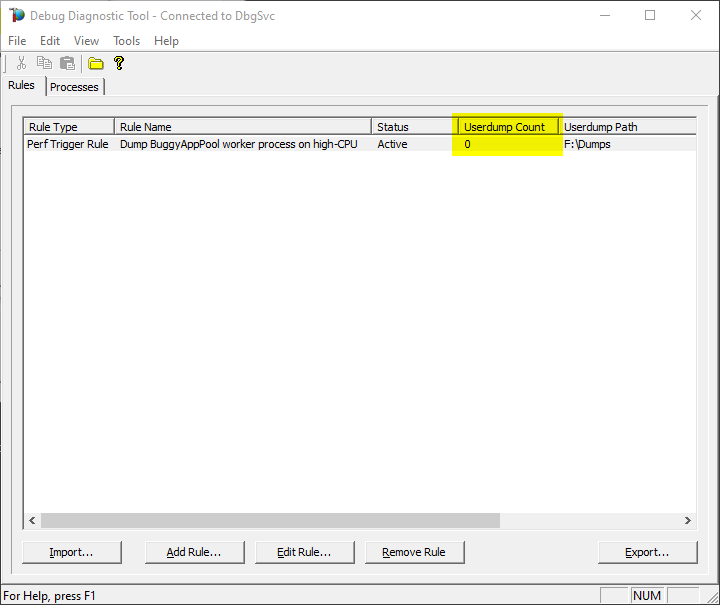
#16.
Once the memory dumps are collected and fully written on disk…
Archive each dump file in its own ZIP and prepare to hand over to the support engineer; upload in a secure file transfer space.
Remember my article about how exceptions are handled and how to collect memory dumps to study them. We can double check if a crash occurred or not: read about w3wp.exe crashes.
Aside: Just in case you are wondering what I use to capture screenshots for illustrating my articles, check out this little ShareX application in Windows Store.
by Contributed | Jul 23, 2021 | Technology
This article is contributed. See the original author and article here.
Collect series of memory dumps for memory leak analysis of a process using the steps below.
With such series of memory dumps we can later analyze the consumption trends:
- Objects accumulating in the .NET heaps and not being removed by Garbage Collection;
- Managed modules that are being created and taking up space.
- Too many threads with rather large call stacks, etc.
#1: Have tool installed
Download Debug Diagnostic and install it on IIS machine:
https://www.microsoft.com/en-us/download/details.aspx?id=49924 v2.2 (if 32-bit system)
https://www.microsoft.com/en-us/download/details.aspx?id=102635 v2.3.1 (only supports 64-bit OS)
#2: Start collection rule
Run Debug Diagnostics Collection. Open the tool with admin rights.
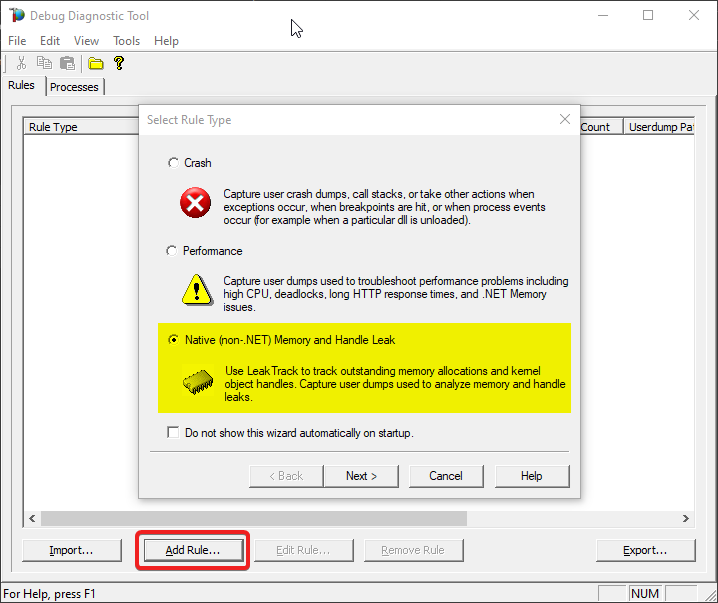
And a pop-up will come, to create a rule for dump collection. Select Memory and Handle Leak, then Next.

#3: Select process by PID
You should see the list of processes now: please select the worker process from the list which you’re having the memory problem. Press Next.
If you have multiple worker processes, you can use command-line utility appcmd.exe from an administrative console to see the list of worker processes with associated application pools.
> C:WindowsSystem32inetsrvappcmd.exe list wp

#4: Configure
On the next window:
Select the maximum number of dumps you would collect (you’ll have the chance to set it later too). A minimum of 3 dumps would be needed for an analysis.
Then press Configure on Userdump generation section.
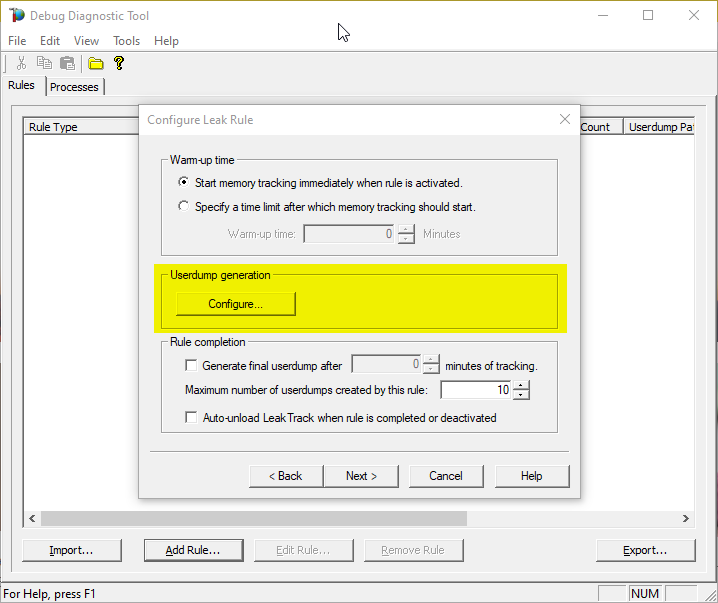
#5: First dump in series
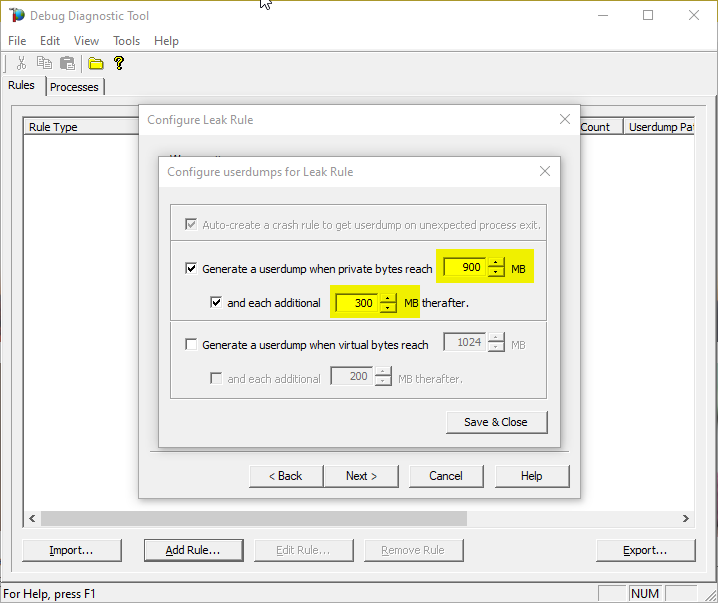
Select Generate userdump when private bytes reach option and set the value to whatever you know it should be the normal consumption – let’s say 900 MB.
#6: Next dumps in series
Set the and each additional … MB threafter option to – let’s say – 300 MB and finally Save & Close.
This will collect dump when memory consumption goes up to 900 Megs and will continue to take dump for each additional 300 Megs
(until the maximum number of dumps is reached, set in the previous/parent window).
#7: Cleanup investigated process
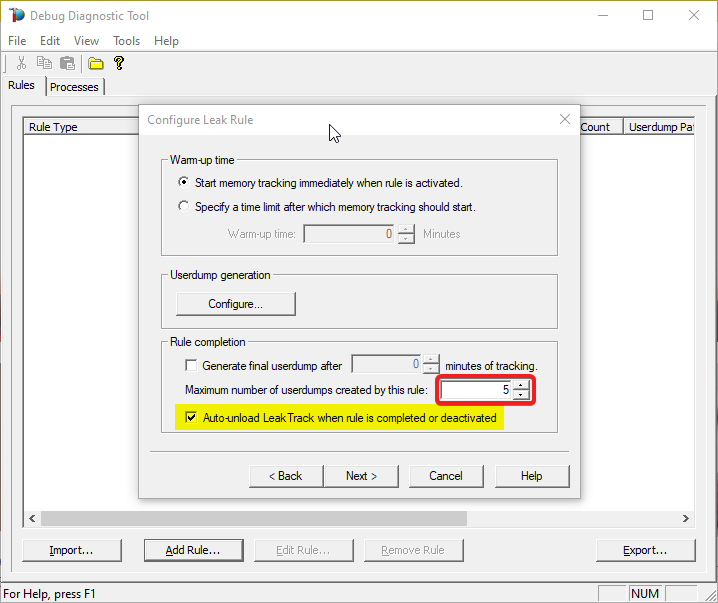
Select Auto-unload Leak Track when rule is completed or deactivated on Rule completion section.
(DebugDiag injects a module in worker process to do its job; we shouldn’t leave the module there.)
#8: Place cap on dumps count
Set Maximum number of userdumps created by this rule to at least 3 (10 is the default).
The more, the better; but mind the space on disk.
#9: Dumps location
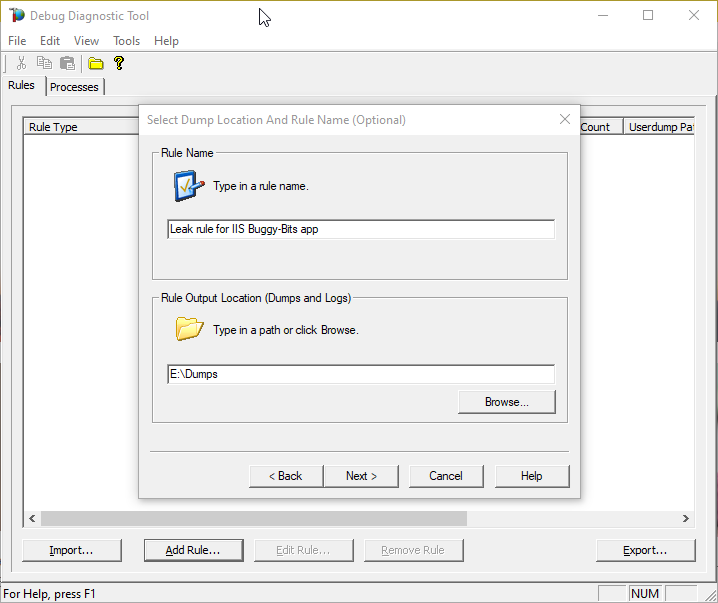
After selecting Next, you will set the location where the dumps will be written.
Please make sure that there is enough disk space on the drive where dumps are collected. Each process dump will take space in the disk approximately the same size the process uses in memory (column Commit Size in Task Manager). For example, if the w3wp.exe process memory usage is ~2 GB, then the size of each dump file will be around 2 GB.
Please do not choose a disk in network/UNC; choose a local disk.
#10: Go!
Finally activate the rule
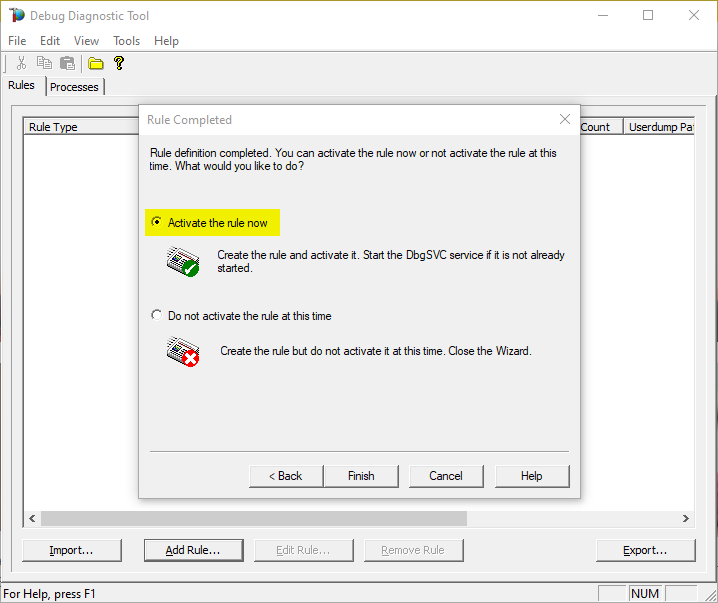
#11: Make sure we do get dumps
After that observe the dump count in the main DebugDiag window.
You need to re-create the leak definition if the PID/Process ID changes in the Task Manager for the worker process.
You can tweak the memory tracking values differently based on your observations.
Eg. Start from 1.5 GB and take additional dump for every additional 500 MB etc.
#12: Upload
Archive each dump file in its own ZIP and prepare to hand over to the support engineer; upload in a secure file transfer space.
Remember my article about how exceptions are handled and how to collect memory dumps to study them. We can double check if a crash occurred or not: read about w3wp.exe crashes.
Aside: Just in case you are wondering what I use to capture screenshots for illustrating my articles, check out this little ShareX application in Windows Store.

by Grace Finlay | Jul 22, 2021 | Business, Marketing
What’s all the fuss about LinkedIn Lead Generation increasing sales? Salespeople that utilize social networking on LinkedIn are 50% more inclined to reach the targeted quota. In addition, they outsell social networks by 78% and attract half as many new prospects to their sales pipeline. However, I wouldn’t say I like the term social-sold or social selling. It’s too corporate and cold.
What’s more important? A company page or LinkedIn leads? Well, the answer depends on your perspective. Your company page should not be filled with useless links, sales pitches, or fluff. Likewise, LinkedIn leads generated from your company page will not be very useful if it is. But if you’ve taken the time and effort to build a really valuable company page with meaningful, useful information about your company, then you may consider the LinkedIn leads a bonus.
Salespeople can actually add leads to their networks with LinkedIn Sales Navigator, and the leads can be compatible with your own qualified prospects. Sales Navigator is one of the fastest-growing paid network marketing companies in the business today. The Sales Navigator system allows users to create a network, connect with others, add leads, and track activity in real-time. It also allows sales professionals to manage their leads and contacts easily. Moreover, you can access company information to learn more about individual contacts. In addition, Sales Navigator offers many other functions that can enhance your sales process. These include identifying top prospects and generating prospect lists for targeted campaigns, conducting webinars, teleconferences, and tracking the results from social media sites such as Twitter and Facebook.
by Contributed | Jul 22, 2021 | Technology
This article is contributed. See the original author and article here.
Call Summary:
Unfortunately, we had technical difficulties and were unable to record this month’s call. We’ll record the presentations again and update this blog with links when they are ready.
This month’s community call featured presentations:
- Shared mailboxes in Outlook – Juan Balmori (Microsoft) and Ankush Oberoi (Microsoft) discussed shared mailboxes and shared folders. Shared mailbox is now in preview and we encourage you to try it out and give us feedback at https://github.com/OfficeDev/office-js/issues.
- Message recipients changed event for Outlook – Elizabeth Samuel (Microsoft) shared a new PnP sample demonstrating how to use the Recipients Changed event to tag an email when there are external recipients.
Q&A (Question & Answers)
Due to the technical difficulties we had on this call, we could not access the chat to read your questions and provide follow-up. If you had a question that did not get answered during the call, or in this blog, please reach out to us by using our short survey form. We’ll address any questions you have during the next call.
Can you add some additional error handling around failure cases for an Outlook add-in that uses the On-send event? We have a scenario where if an On-send add-in fails due to service outage users are unable to send emails unless an admin performs a companywide deactivation of the add-in. It would be helpful to let end-users still send their emails if the On-send add-in fails to load or throws an unhandled exception.
That’s by design for the On-send event when we released the 1.8 requirement set. The good news is that the team is working on enabling a new version of this event that will deal with the “add-in unavailable” cases. We are working to get this into preview soon, so please keep an eye out on future community calls.
On the iOS and Android platforms, you only support Outlook API 1.5. Do you think we will see support for 1.6+ before 2022?
We have this in our backlog, but we don’t yet have an ETA.
Outlook on mobile still does not support compose mode add-ins, or the On-send event. This was a highly requested feature on the UserVoice system. When will Outlook on mobile support both of these? How did the ‘Exclaimer’ add-in from June 2021’s community call work on Outlook mobile without support for compose mode add-ins?
We have this in our backlog, but we don’t yet have an ETA. The Exclaimer add-in isn’t designed for use on Outlook on mobile.
Is there a way to write a CSV file to the local computer’s storage where the add-in is running?
Office Add-ins run in a browser runtime and only have the capabilities of any web app running in a browser. It’s not possible to write directly to disk from the browser in any way that works cross-platform. A recommended approach to write to a CSV file is to write to files using Microsoft Graph and OneDrive.
Resources
Outlook shared mailbox
PnP: Use Outlook event-based activation to tag external recipients (preview)
Office Add-ins community call
Office Add-ins feedback
The next Office Add-ins community call is on Wednesday, August 11, 2021 at 8:00AM PDT. Get the calendar invite at https://aka.ms/officeaddinscommunitycall.
by Scott Muniz | Jul 22, 2021 | Security, Technology
This article is contributed. See the original author and article here.
Cisco has released security updates to address multiple vulnerabilities in Intersight Virtual Appliance. An attacker could exploit these vulnerabilities to take control of an affected system. For updates addressing lower severity vulnerabilities, see the Cisco Security Advisories page.
CISA encourages users and administrators to review Cisco Advisory cisco-sa-ucsi2-iptaclbp-L8Dzs8m8 and apply the necessary updates.


Recent Comments