by Contributed | Aug 6, 2021 | Technology
This article is contributed. See the original author and article here.
Introduction:
In this blog, we will look at how we configure near real-time monitoring of SQL Server on Linux and containers with the Telegraf-InfluxDB and Grafana stack. This is built on similar lines to Azure SQLDB and Managed Instance solutions already published by my colleague Denzil Ribeiro. You can refer to the above blogs to know more about Telegraf, InfluxDB and Grafana.
A quick rundown of all the tasks we’ll be carrying out to complete the setup:
- We will first install the Telegraf, InfluxDB, and Grafana containers on the monitoring host machine. You may be wondering why containers are used? because they are simple to set up and also provide isolation.
- Then, we will prepare the target SQL Server instances that we will monitor by creating the login on all of the target SQL Server instances (SQL Server on Linux/containers/Windows) that telegraf will use to connect to SQL Server instances for data collection.
- As this is a demo, I am running all three containers on a single host machine, but depending on the instances you monitor and data that is collected, you may decide to run the containers on different nodes.
- The data retention policies of InfluxDB will then be configured. The retention policy ensures that Influxdb does not grow out of bounds.
- Finally, we will configure and set up Grafana to create our dashboard with graphs and charts.
Let’s Build:
For this demonstration, the host on which I deploy the containers is an Azure VM running Ubuntu 20.04. I’m collecting data from the four SQL Server instances listed below:
- A SQL Server instance running on RHEL.
- Two SQL Server container instances, one deployed using the Ubuntu image and the other using the RHEL image.
- A SQL Server running on Windows.
Let’s start deploying containers:
- Install docker on the Ubuntu 20.04 host, which is our monitoring VM. To install Docker on Ubuntu 20.04 VM, refer to this article.
- Run the command below to create a docker network. This is the common network on which all three containers (Telegraf, InfluxDB, and Grafana) will be deployed.
docker network create --driver bridge influxdb-telegraf-net
#You can change the name of the network from “influxdb-telegraf-net” to whatever you want.
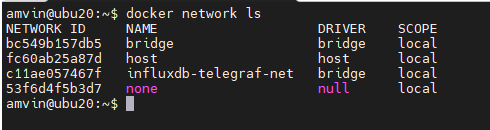
you can list the network using the command
docker network ls
We will now create the SQL Server login that telegraf will use to connect to the target SQL Server instances. This login must be created on all target SQL Server instances that you intend to monitor. You can change the login name from telegraf to any other name of your choice, but the same also needs to be changed in the telegraf.conf file as well.
USE master;
CREATE LOGIN telegraf WITH PASSWORD = N'StrongPassword1!', CHECK_POLICY = ON;
GO
GRANT VIEW SERVER STATE TO telegraf;
GO
GRANT VIEW ANY DEFINITION TO telegraf;
GO
Run the following command to deploy the telegraf container
docker run -d --name=telegraf -v /home/amvin/monitor/sqltelegraf/telegraf.conf:/etc/telegraf/telegraf.conf --net=influxdb-telegraf-net telegraf
# where:/home/amvin/monitor/sqltelegraf/telegraf.conf is a telegraf configuration file placed on my host machine, please update the path as per your environment.
# please ensure that you change the IP addresses and port numbers to your target SQL Server instances in the telegraf.conf file that you create in your environment.
Note: You can download the sample telegraf.conf from here. Please remember to change the IP address to your target SQL Server instance IP addresses.
- Run the following command to deploy the InfluxDB container
docker run --detach --net=influxdb-telegraf-net -v /home/amvin/monitor/data/influx:/var/lib/influxdb:rw --hostname influxdb --restart=always -p 8086:8086 --name influxdb influxdb:1.8
# where: /home/amvin/monitor/data/influx is a folder on the host that I am mounting inside the container, you can create this folder in any location.
# please ensure you set the right permissions so files can be written inside this folder by the container.
- Deploy the Grafana container using the following command
docker run --detach -p 3001:3000 --net=influxdb-telegraf-net --restart=always -v /home/amvin/monitor/data/grafana:/var/lib/grafana -e "GF_INSTALL_PLUGINS=grafana-azure-monitor-datasource,grafana-piechart-panel,savantly-heatmap-panel" --name grafana grafana/Grafana

# where: home/amvin/monitor/data/grafana is a folder on the host that I am mounting inside the container, you can create this folder in any location.
# please ensure you set the right permissions so files can be written inside this folder.
With the containers now deployed, use “docker ps -a” to list them, and you should see something like this:

Note: Please ensure that you open the ports on the host to which Grafana and InfluxDB containers are mapped to, in this case they are 3000 and 8086 respectively.
Let’s now setup retention policy on InfluxDB to ensure that there is limited growth of the database. I am setting this for 30 days, you can configure it as per your requirement.
sudo docker exec -it influxdb bash
#then run beow commands inside the container
influx
use telegraf;
show retention policies;
create retention policy retain30days on telegraf duration 30d replication 1 default;
quit
Setting up Grafana:
We are now ready to create the dashboard, before that we need to setup Grafana and to do that follow the below steps:
- Browse to your Grafana instance – http://[GRAFANA_IP_ADDRESS_OR_SERVERNAME]:3000
- First time you login into Grafana, login and password are set to: admin. Also take a look at the Getting Started Grafana documentation.
- Add a data source for InfluxDB. Detailed instructions are at in the grafana data source docs
- Type: InfluxDB
- Name: InfluxDB (this is also the default)
- URL: http://[INFLUXDB_HOSTNAME_OR_IP_ADDRESS]:8086. (The default of http://localhost:8086 works if Grafana and InfluxDB are on the same machine; make sure to explicitly enter this URL in the field. )
- Database: telegraf
- Click “Save & Test”. You should see the message “Data source is working”.
- Download Grafana dashboard JSON definitions from the repo from here and then import them into Grafana.
You are ready and this is how the dashboard should look, feel free to modify the graphs as per your requirement.


by Scott Muniz | Aug 6, 2021 | Security, Technology
This article is contributed. See the original author and article here.
Ivanti has released Pulse Connect Secure system software version 9.1R12 to address multiple vulnerabilities an attacker could exploit to take control of an affected system.
CISA encourages users and administrators to review Ivanti’s Security Advisory SA44858 and apply the necessary update.
by Contributed | Aug 5, 2021 | Technology
This article is contributed. See the original author and article here.
Abnormal Security, an app available in Azure Marketplace, uses advanced artificial intelligence detection techniques to stop targeted phishing attacks. The cloud-native email security platform protects enterprises by detecting anomalous behavior and developing a deep understanding of people, relationships, and business context. Abnormal Security is a member of the Microsoft Intelligent Security Association.
Azure Marketplace interviewed Ben S., an IT director in the manufacturing sector, to learn what he had to say about the product.
What do you like best about Abnormal Security?
Abnormal Security stood out to us as a nuanced and unique way to approach the idea of business email compromise. Through their behavioral engine, they would build out personas for what is normal and expected interaction for your employee base, and through that identification, they would classify what is abnormal activity. And they carry that forward from your internal personnel to the vendor base that you contact and interact with.
It does a really great job of providing reporting both at a high level and then down to the granular details. So there’s a handful of dashboards that help to show attack trends and attack types, whether it be credential phishing, malware scam, or social engineering. Any of those types of categories it’s able to represent both in percentage and count. It’s also able to show attacker origin. And then the other piece that I think is incredibly helpful is that, for the emails it does remediate or take action on, it doesn’t just do that blindly. It actually takes that email message and is able to highlight the pieces that caused its threat score to be elevated so that you, as a security analyst or a support individual, can go through and understand what it is you’re looking at and know why something would be considered a threat or malicious.
How has the product helped your organization?
We saw a lot of banking impersonation and, in some cases, internal invoice impersonation taking place. We were receiving pretty legitimate-looking invoices from known vendors. But they were coming from different email servers. There were also instances where the external contact had been compromised and the invoice had banking information changes to it, trying to get us to wire funds to an attacker’s bank account. Abnormal had a great proof of concept that they were able to walk us through. From the time we turned it on, we saw immediate results from that. The solution integrates with our Exchange Online environment and doesn’t sit in line like a traditional secure email gateway type of solution. It sits next to it and maintains that same visibility. So if an attack is identified after the fact, it’s still connected to the point where it’s able to then do post-remediation and pull those delivered messages out from mailboxes.
Another useful feature is the abuse mailbox. It’s a function that allows us in IT support to leverage some email client toolbar applications for employees to be able to submit suspect messages. Previously that was a manual effort by our security team, where that would become a helpdesk ticket item that then would require hands-on analysis by someone on my team.
How are customer service and support?
Customer service has been great. When we reached out and started to engage with them on the proof of concept, they were tremendous in helping to get the platform configured. And then that carried forward to when we were customers as we were getting more and more familiar with the platform and asking questions, primarily around why certain emails were classified the way they were. Those were all easy-to-open cases where we got connected with dedicated support personnel. They configured this solution for us so that we have some flexibility in some different classifications, most notably the ability for us to maintain our VIP list of people that potentially are at higher risk, or that we want additional scrutiny around because of approval power.
Any recommendations to other users considering this product?
I think the biggest thing in the security space is there are a ton of different solutions and platforms trying to address similar issues. It’s important, when you’re looking for a solution, to understand what you’re looking to address. Financial loss, for us, was one of the biggest drivers, and in the evaluations we did, Abnormal showed the best capabilities to help address that risk.
What is your overall rating for this product?
5 out of 5 stars.
Cloud marketplaces are transforming the way businesses find, try, and deploy applications to help their digital transformation. We hope these improvements make your experience in Azure Marketplace intuitive and simple. Learn more about Azure Marketplace and find ways to discover the right application for your cloud solution needs.

by Scott Muniz | Aug 5, 2021 | Security
This article was originally posted by the FTC. See the original article here.
Last year, the Centers for Disease Control and Prevention (CDC) issued a temporary order to stop evictions due to the COVID-19 pandemic. Since then, this federal eviction moratorium has been extended several times, and on August 3, the CDC extended it again for counties where COVID cases are rapidly spreading. But renters in counties where the order does not apply now face the possibility of eviction if they still owe back rent. And on top of that, scammers can take advantage of the panic caused by this situation.
How might they do that? Scammers reach out to renters facing eviction, promising rental assistance and pretending to be with the government. When they contact renters, they ask for bank account and other personal information, saying that they need this information so they can transfer emergency rental assistance money directly into these accounts. But instead of depositing much-needed funds, they use the information to withdraw the little that’s left.
If you’re a renter facing eviction, there are several sites and services available to you:
- Connect with state and local organizations that are distributing federal rental assistance in their communities by visiting the Consumer Financial Protection Bureau’s (CFPB’s) new Rental Assistance Finder.
- Check with your local court system for more details about the eviction process and your rights as a tenant. You may also qualify for free legal services through your local legal aid organization.
Remember, never give out financial or personal information to anyone who contacts you, even if they’re promising to help you. Federal aid for emergency rental assistance was distributed to states, territories, and other localities. If someone contacts you saying they’re from the federal government and they can help you with back rent, it’s a sign of a scam.
These government services aren’t just for tenants. If you’re a landlord facing a loss of rental income, the CFPB also has useful information on their Help for landlords page.
And if you spot a rental assistance scam or any other type of scam, tell your state attorney general’s office right away, and then report it to the FTC at ReportFraud.ftc.gov.
Brought to you by Dr. Ware, Microsoft Office 365 Silver Partner, Charleston SC.
by Scott Muniz | Aug 5, 2021 | Security, Technology
This article is contributed. See the original author and article here.
CISA has released an Industrial Control Systems (ICS) advisory detailing multiple vulnerabilities in InterNiche products. An attacker could exploit some of these vulnerabilities to take control of an affected system.
CISA encourages users and administrators to review the ICS Advisory ICSA-21-217-01 HCC Embedded InterNiche TCP/IP Stack NicheLite and apply the necessary updates and mitigations.


Recent Comments