by Contributed | Apr 9, 2022 | Technology
This article is contributed. See the original author and article here.
The SQL Server Profiler using SQL Server Management Studio (SSMS) currently support Azure SQL Manage Instance and SQL Server platforms and does not support Azure SQL DB platform, so as a workaround we can use SQL Server Profiler extension for Azure Data Studio (ADS).
“The SQL Server Profiler extension provides a simple SQL Server tracing solution similar to SQL Server Management Studio (SSMS) Profiler except built using Extended Events. SQL Server Profiler is very easy to use and has good default values for the most common tracing configurations. The UX is optimized for browsing through events and viewing the associated Transact-SQL (T-SQL) text. The SQL Server Profiler for Azure Data Studio also assumes good default values for collecting T-SQL execution activities with an easy to use UX. This extension is currently in preview.” More information can be found here.
In this article we will cover the below contents:
- How to use the SQL Server Profiler extension for Azure SQL DB.
- How to export the output session into an XML-file (.xml).
- How to export the output session into an XEL-file (.xel) and store it into an Azure Storage Account.
Prerequisites:
How to use the SQL Server Profiler extension for Azure SQL DB:
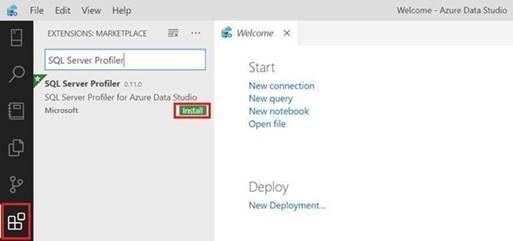
- Open ADS and click on Extensions from the left-side then search for SQL Profiler For Azure Data Studio and finally click on Install, please have look at the below snapshot:
- Click on Connections (Left-side), then click on Add Connection, please have a look at the below snapshot:

- In the add new connection dialog, fill in your Azure SQL Server information and select the database, please have a look at the below snapshot:

- In the create new firewall rule, click on reenter your credentials, please have a look at the below snapshot:

- After entering your credentials and back to the firewall rule dialog, select add my client IP and then click OK, please have a look at the below snapshot:

- After that you will be back to the connection dialog, then select your database and click connect, please have a look at the below snapshot:

- After establishing a connection, right-click on your Azure SQL database and select Launch profiler (Alt+P), please have a look at the below snapshot:

- From Start New Profiler Session dialog, enter session name and click on Start, please have a look at the below snapshot:

- A profiler tab will appear with all the events that is currently running on the Azure SQL database, please have a look at the below snapshot:

- Right-click on your Azure SQL database and select New Query, please have a look at the below snapshot:

- Enter your specified query and click on Run, then click on the profiler tab and you will notice your query event is logged, please have a look at the below snapshot:

How to export the output session into an XML-file (.xml):
- Open SSMS and connect to your Azure Database.
- Open Extended Events and select the session that you have created in Azure Data Studio.
- Right-click on the session buffer and select View Target Data.
- In the Session buffer tab (in the right-side) right-click and select Refresh (XML data will be created).
- Click on XML Data and save the new view tab as XML and please send it to me.
Please have a look at the following snapshots:


How to export the output session into an XEL-file (.xel) and store it into an Azure Storage Account:
- From SSMS, right-click on your session and select properties
- From session properties, select Data Storage to and enter your Azure Storage Account to save the file as “.xel” as shown in the below image and click OK.
- From SSMS, right-click on your session and select start session (if not running already).
- After you finish from capturing events, open your storage account where you saved your “.xel” file.
- Download it into your local machine then open it using SSMS and follow this document to export the results into table to be able to filter the results as per your needs.

More information can be found in the below document:
by Scott Muniz | Apr 8, 2022 | Security
This article was originally posted by the FTC. See the original article here.
Brought to you by Dr. Ware, Microsoft Office 365 Silver Partner, Charleston SC.
by Contributed | Apr 8, 2022 | Technology
This article is contributed. See the original author and article here.
This blog shows how to create dashboards to visualize the performance of the sample manufacturing operation presented in the blog Rewind the Metaverse with Data History for Azure Digital Twins. You can use these examples to build your own dashboards to analyze the behavior of environments that you model using Azure Digital Twins.
To get started, complete the following prerequisites.
- Gain access to a Grafana resource where you can create your dashboards.
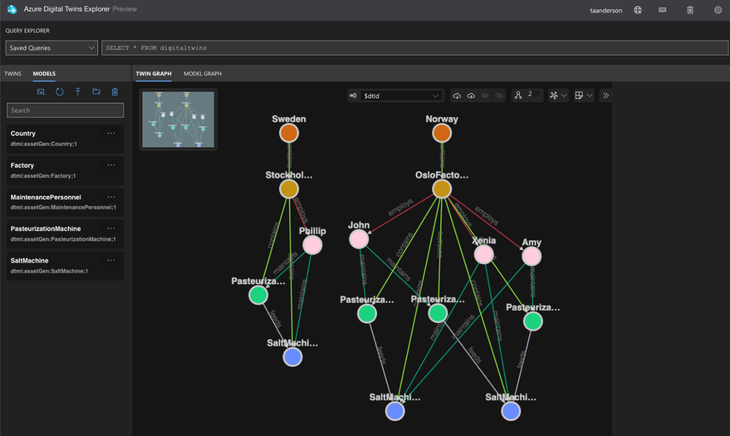
- Complete the steps in the above-mentioned blog or in the article Use data history with Azure Data Explorer. Upon completion, you will have a working data history connection between Azure Digital Twins and Azure Data Explorer that enables you to perform historical analytics on a simulated dairy operation containing factories, people, and machines across multiple locations. Below is a visualization of the twin graph of the dairy operation created during the exercise.
Next, follow the below steps to create dashboards to visualize the performance of the dairy operation.
Connect Grafana to an Azure Data Explorer data source
The data history feature for Azure Digital Twins historizes twin changes to an Azure Data Explorer database. You can connect this database to Grafana by following the steps in Visualize data from Azure Data Explorer in Grafana (the video included in the guide is a great place to start). When installing the Azure Data Explorer plugin, make sure that the plugin is version 3.6.1 or higher.
Assign your app registration the Azure Digital Twins Data Reader role
In the above step, you will create an app registration. Assign this app registration the Azure Digital Twins Data Reader role on your Azure Digital Twins instance. This will enable the KQL queries run by the dashboards to query your Azure Digital Twins instance.
Start by viewing your Azure Digital Twins instance in the portal. Select Access Control (IAM) from the left navigation and select Add role assignment.

In the next screen, select the Azure Digital Twins Data Reader role, and select Next.

In the next screen, choose +Select members. Search for the name of your app registration and choose Select.

On the next screen, select Review + assign.
Import the Contoso Dairy dashboards into Grafana
Three dashboard JSON files are provided in this repo folder. Download the files. Import the Machine View by Factory, Maintenance Technician dashboard into Grafana as shown below.

In the import dialog, select the Azure Data Explorer data source you created earlier and enter values for your Azure Digital Twins endpoint and data history table name. Complete this same process for the other dashboard JSON files.

Once a dashboard loads, you will see time series charts and gauges for machines in the dairy operation. You can make selections from the dropdown menus at the top to drill down on the machines of interest.

When you select an item from the menu, it triggers a query to the twin graph of the dairy operation that searches for twins based on twin name, twin type, relationships between twins, and other parameters. The result of the query is held in a Grafana variable. To view variables, click on the gear icon in the upper right-hand corner of a dashboard, then click on Variables in the left navigation panel.

The KQL queries for most variables dynamically assemble an Azure Digital Twins query via the strcat() KQL function. In many cases, the assembled Azure Digital Twins query references other Grafana variables from other menus. Grafana denotes variables in a query expression with a $. For example, the MaintTech variable is based on a query that searches for all twins that have an employs relationship with a factory twin, where the factory twin ID is defined by the Factory variable. The result of the query is held in the MaintTech Grafana variable.
You can also view the KQL queries that fetch data for a panel. Click on Edit to view the panel query.

In the editor, you can view the query for each tile that uses Grafana variables. These variables are driven by the menu queries discussed above.

Conclusion
In this walkthrough, you learned how to use Grafana to support visualization experiences for environments modeled in Azure Digital Twins. The relationships in the underlying twin graph of the dairy operation combined with time series data enable a variety of performance analytics. Example analytics include summing the output of machines that feed a common downstream machine, comparing the performance of similar machines in the same factory, or comparing machines in different factories. Explore the query for each Grafana dashboard in this blog as well as additional queries here for more examples.
by Scott Muniz | Apr 8, 2022 | Security
This article was originally posted by the FTC. See the original article here.
Brought to you by Dr. Ware, Microsoft Office 365 Silver Partner, Charleston SC.
by Scott Muniz | Apr 8, 2022 | Security
This article was originally posted by the FTC. See the original article here.
Brought to you by Dr. Ware, Microsoft Office 365 Silver Partner, Charleston SC.

Recent Comments