Seeing isn’t always believing when it comes to ad prices for LASIK eye surgery
This article was originally posted by the FTC. See the original article here.
Brought to you by Dr. Ware, Microsoft Office 365 Silver Partner, Charleston SC.
This article was originally posted by the FTC. See the original article here.
Brought to you by Dr. Ware, Microsoft Office 365 Silver Partner, Charleston SC.
This article was originally posted by the FTC. See the original article here.
Brought to you by Dr. Ware, Microsoft Office 365 Silver Partner, Charleston SC.
This article is contributed. See the original author and article here.
Taking time to speak with customers remains one of the best ways to build relationships and close deals faster. However, in a digital world it is often difficult to secure that moment of interaction. So when that moment happens, it is critical to focus on the conversation. Capturing valuable insights and next steps is a distraction at this precious time. Microsoft Dynamics 365 Sales conversation intelligence continues to harness AI technology to assist salespeople with just that it’s there as your chief note taker. Master conversation follow ups by uncovering value from each call and gaining a deeper understanding of your customer interactions.
We’re excited to introduce two new features designed to save time and allow users to quickly access the most relevant and valuable insights from their calls:
Let’s dive into each one to learn more.
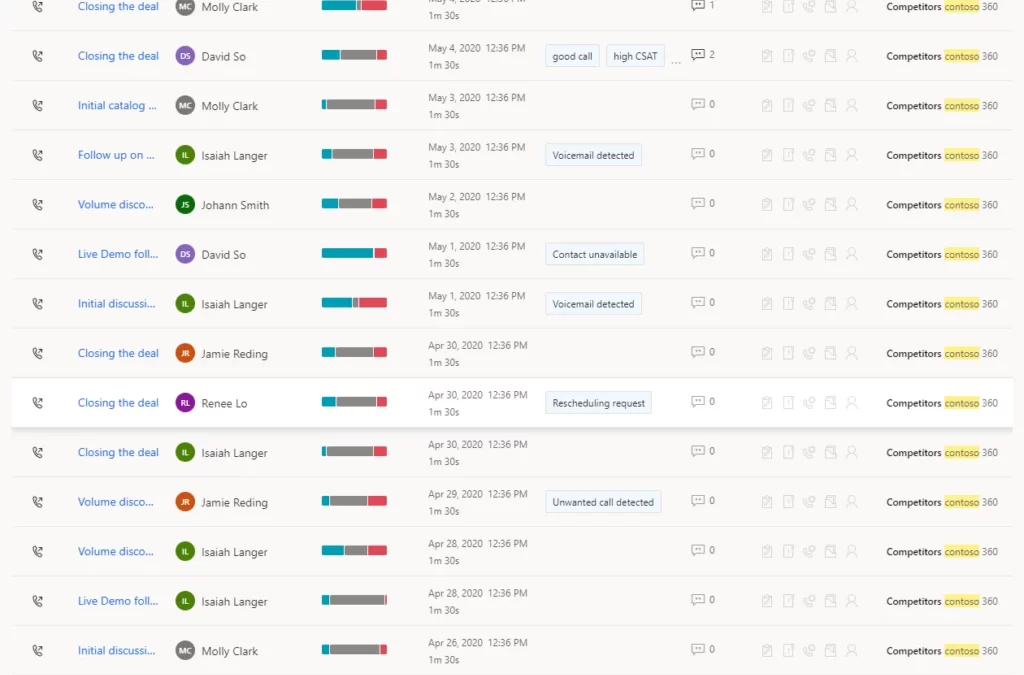
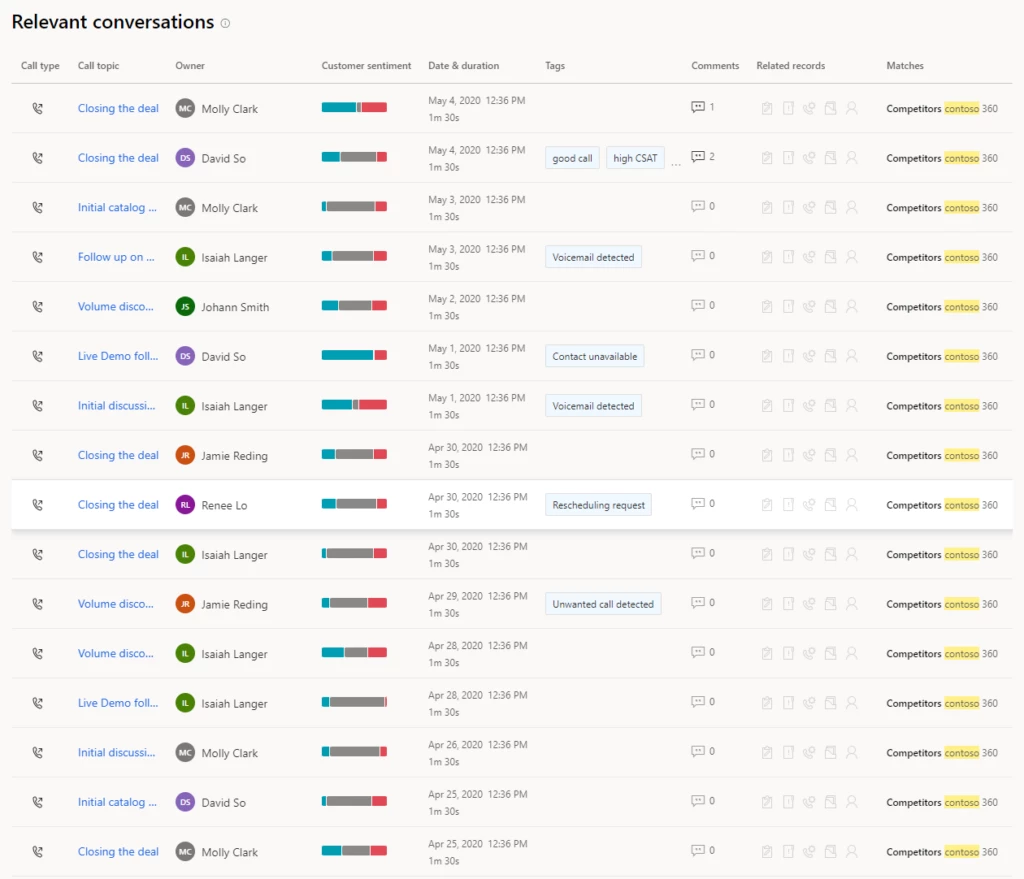
Call categorization introduces a revolutionary way to manage call recordings and learn more about leads, as well as assist managers with identifying coaching opportunities within their teams.
It is common for sales teams and contact centers to conduct many calls which are not successfully connected. This can lead to an overload of irrelevant data in call recording tables and a lot of noise for a seller and manager to wade through when reviewing calls for follow-up or best practice sharing. To address this issue, Dynamics 365 Sales conversation intelligence is introducing the Call categorization feature that automatically categorizes and tags short calls with 4 categories:
Once the calls are tagged, it becomes easy for sellers, managers, and operations to identify and exclude irrelevant call data. Sales teams can save time by not having to hunt for calls. Instead, with call categorization, they can review relevant conversations to follow up on and share as best practice or learnings.
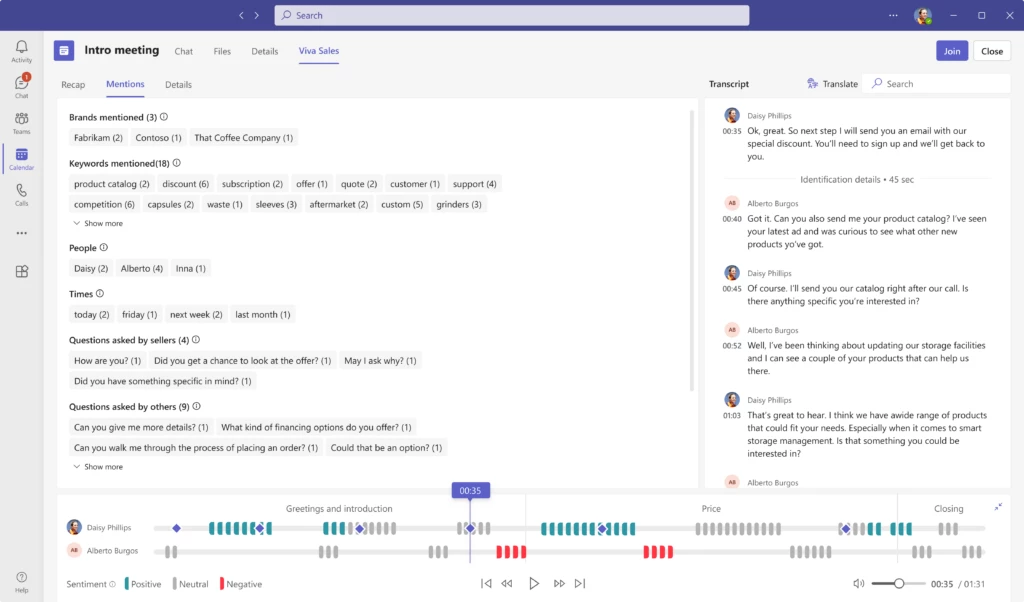
When in the flow of a conversation multiple questions could be asked but the seller may not tackle them all within the call. Dynamics 365 Sales conversation intelligence now tracks all questions raised by customers and sellers during customer conversations. These are readyfor review and follow up almost immediately after the call has ended.
The new feature includes a “Questions” section in each call/meeting summary. The section tracks all questions asked during the call and groups them by customer or seller. This allows sellers and sales managers to easily locate and quickly jump to listen to a specific question within the conversation. By doing so, they gain a more in-depth understanding of the interaction.
With this insight documented, sellers can quickly drill into customers’ objections and concerns. In addition, they can review those open items for action.
With these productivity enhancements sellers can focus on engaging customers knowing their systems are working hard to remove complexity and optimize their sales conversation follow ups.
To get started, enable the public preview of the Call categorization feature: First-run setup experience for conversation intelligence in sales app | Microsoft Learn
Learn more about the Question detection feature: View and understand call summary page in the Dynamics 365 Sales Hub app | Microsoft Learn
Learn more about conversation intelligence:Improve seller coaching and sales potential with conversation intelligence | Microsoft Learn
Enable conversation intelligence in your organization:First-run setup experience for conversation intelligence in sales app | Microsoft Learn
If you are not already a Dynamics 365 Sales customer and want to know more, take a tour andstart your free trial today.
The post Optimize sales conversation follow ups in 2 easy steps! appeared first on Microsoft Dynamics 365 Blog.
Brought to you by Dr. Ware, Microsoft Office 365 Silver Partner, Charleston SC.

This article is contributed. See the original author and article here.
Postgres is one of the most widely used databases and supports a number of operating systems. When you are writing code for PostgreSQL, it’s easy to test your changes locally, but it can be cumbersome to test it on all operating systems. A lot of times, you may encounter failures across platforms and it can get confusing to move forward while debugging. To make the dev/test process easier for you, you can use the Postgres CI.
When you test your changes on CI and see it fail, how do you proceed to debug from there? As a part of our work in the open source Postgres team at Microsoft, we often run into CI failures—and more often than not, the bug is not obvious, and requires further digging into.
In this blog post, you’ll learn about techniques you can use to debug PostgreSQL CI failures faster. We’ll be discussing these 4 tips in detail:
Before diving into each of these tips, let’s discuss some basics about how Postgres CI works.
PostgreSQL uses Cirrus CI for its continuous integration testing. To use it for your changes, Cirrus CI should be enabled on your GitHub fork. The details on how to do this are in my colleague Melih Mutlu’s blog post about how to enable the Postgres CI. When a commit is pushed after enabling CI; you can track and see the results of the CI run on the Cirrus CI website. You can also track it in the “Checks” GitHub tab.
Cirrus CI works by reading a .cirrus.yml file from the Postgres codebase to understand the configuration with which a test should be run. Before we discuss how to make changes to this file to debug further, let’s understand its basic structure:
# A sequence of instructions to execute and
# an execution environment to execute these instructions in
task:
  # Name of the CI task
  name: Postgres CI Blog Post

  # Container where CI will run
  container:
    # Container configuration
    image: debian:latest
    cpu: 4
    memory: 12G

  # Where environment variables are configured
  env:
    POST_TYPE: blog
    FILE_NAME: blog.txt

  # {script_name}_script: Instruction to execute commands
  print_post_type_script:
    # command to run at script instruction
    - echo "Will print POST_TYPE to the file"
    - echo "This post's type is ${POST_TYPE}" > ${FILE_NAME}

  # {artifacts_name}_artifacts: Instruction to store files and expose them in the UI for downloading later
  blog_artifacts:
    # Path of files which should be relative to Cirrus CI’s working directory
    paths:
      - "${FILE_NAME}"
    # Type of the files that will be stored
    type: text/plain


As you can see, the echo commands are run at script instruction. Environment variables are configured and used in the same script instruction. Lastly, the blog.txt file is gathered and uploaded to Cirrus CI. Now that we understand basic structure, let’s discuss some tips you can follow when you see CI failures.
When Postgres is working on your local machine but you see failures on CI, it’s generally helpful to connect to the environment where it fails and check what is wrong.
You can achieve easily that using the RE-RUN with terminal button on the CI. Also, typically, a CI run can take time as it needs to find available resources to start and rerun instructions. However, thanks to this option, that time is saved as the resources are already allocated.
After the CI’s task run is finished, there is a RE-RUN button on the task’s page.
You may not have noticed it before, but there is a small arrow on the right of the RE-RUN button. When you click this arrow, the “Re-Run with Terminal Access” button will appear. When this button is clicked, the task will start to re-run and shortly after you will see the Cirrus terminal. With the help of this terminal, you can run commands on the CI environment where your task is running. You can get information from the environment, change configurations and re-test your task.
Note that the re-run with terminal option is not available for Windows yet, but there is ongoing work to support it.
Postgres and meson provide additional build-time debug options to generate more information to find the root cause of certain types of errors. Some examples of build options which might be useful to set are:
-Dcassert=true [defaults to false]: Turns on various assertion checks. This is a debugging aid. If you are experiencing strange problems or crashes you might want to turn this on, as it might expose programming mistakes.-Dbuildtype=debug [defaults to debug]: Turns on basic warnings and debug information and disables compiler optimizations.-Dwerror=true [defaults to false]: Treat warnings as errors.-Derrorlogs=true [defaults to true]: Whether to print the logs from failing tests.While building Postgres with meson, these options can be setup using the meson setup [] [] or the meson configure commands.
These options can either be enabled with the “re-running with terminal access” option or by editing the cirrus.yml config file. Cirrus CI has a script instruction in the .cirrus.yml file to execute a script. These debug options could be added to the script instructions in which meson is configured. For example:
configure_script: |
  su postgres <<-EOF
    meson setup
      -Dbuildtype=debug
      -Dwerror=true
      -Derrorlogs=true
      -Dcassert=true
      ${LINUX_MESON_FEATURES}
      -DPG_TEST_EXTRA="$PG_TEST_EXTRA"
      build
  EOF
Once it’s written as such, the debug options will be activated next time CI runs. Then, you can check again if the build fails and investigate the logs in a more detailed manner. You may also want to store these logs to work on them later. To gather the logs and store them, you can follow the tip below.
Cirrus CI has an artifact instruction to store files and expose them in the UI for downloading later. This can be useful for analyzing test or debug output offline. By default, Postgres’ CI configuration gathers log, diff, regress log, and meson’s build files—as can be seen below:
testrun_artifacts:
  paths:
    - "build*/testrun/**/*.log"
    - "build*/testrun/**/*.diffs"
    - "build*/testrun/**/regress_log_*"
  type: text/plain

meson_log_artifacts:
  path: "build*/meson
If there are other files that need to be gathered, another artifact instruction could be written or the current artifact instruction could be updated at the .cirrus.yml file. For example, if you want to collect the docs to review or share with others offline, you can add the instructions below to the task in the .cirrus.yml file.
configure_script: su postgres -c 'meson setup build'

build_docs_script: |
  su postgres <<-EOF
    cd build
    ninja docs
  EOF

docs_artifacts:
  path: build/doc/src/sgml/html/*.html
  type: text/html
Then, collected logs will be available in the Cirrus CI website in html format.
Apart from the tips mentioned above, here is another tip you might find helpful. At times, we want to run some commands only when we come across a failure. This might be to avoid unnecessary logging and make CI runs faster for successful builds. For example, you may want to gather the logs and stack traces only when there is a test failure. The on_failure instruction helps to run certain commands only in case of an error.
on_failure:
  testrun_artifacts:
    paths:
      - "build*/testrun/**/*.log"
      - "build*/testrun/**/*.diffs"
      - "build*/testrun/**/regress_log_*"
    type: text/plain

  meson_log_artifacts:
    path: "build*/meson-logs/*.txt"
    type: text/plain
As an example, in the above, the logs are gathered only in case of a failure.
While working on multi-platform databases like Postgres, debugging issues can often be difficult. Postgres CI makes it easier to catch and solve errors since you can work on and test your changes on various settings and platforms. In fact, Postgres automatically runs CI on every commitfest entry via Cfbot to catch errors and report them.
These 4 tips for debugging CI failures should help you speed up your dev/test workflows as you develop Postgres. Remember to use the terminal to connect CI environment, gather logs and files from CI runs, use build options on CI, and run specific commands on failure. I hope these tips will make Postgres development easier for you!
This article is contributed. See the original author and article here.
Mozilla has released security updates to address vulnerabilities in Firefox ESR and Firefox. An attacker could exploit some of these vulnerabilities to take control of an affected system.
CISA encourages users and administrators to review Mozilla’s security advisories for Firefox ESR 102.7 and Firefox 109 for more information and apply the necessary updates.

Recent Comments