Power Automate Process Mining empowers warehouses to boost their efficiency significantly

Power Automate Process Mining empowers warehouses to boost their efficiency significantly

This article is contributed. See the original author and article here.

Introduction

 Every warehouse manager is keen on improving the processes on the warehouse floor. But where to start? What to optimize? It is far from easy to discover the bottlenecks. This is where the Power Automate Process Mining comes really handy. In the 10.0.35 release we ship the integration of Supply Chain Management Warehouse module with Power Automate Process Mining. This integration gives some really valuable insight into the material movement in the warehouse. 

What is Power Automate Process Mining?

 Power Automate Process Mining is a tool which exists exactly to help you gain insights, find bottlenecks and continuously improve business processes. It offers rich visualizations and deep analytics so one can get clear insights into the data. 

 There is an online version of it – part of the Power Automate offering. Using Power Query Online one can load data about the processes from various sources – starting from the Excel file, SQL databases and even calling custom APIs. Users can also connect to the already prepared data in Azure Data Lake and utilize powerful tools like Azure Data Factory for data preparation. The online version offers a customizable Power BI report with detailed process insights. However, one can download a desktop application which allows to perform deep process analysis. The desktop version reuses the same backend – same data and process definition – as an online version. 

 When working with Power Automate Process Mining you have to know some terminology – cases and activities. In the context of the warehouse material movement process analysis, Case is a closed warehouse work and Activity is a single work line (pick or put). Thus, a single case consists of activities – each of them is a “visit” to a certain location in the warehouse. 

How to analyze material movement process in the warehouse using the Power Automate Process Mining? 

 In the 10.0.35 release we ship the integration of Supply Chain Management Warehouse module with the Power Automate Process Mining. It allows you to: 

  • Easily load warehouse material movement data into the Power Automate Process Mining. Users can choose how much data to load and so forth. 
  • The resulting Power Automate Process Mining Power BI report is integrated right into Supply Chain Management. Users can gain process insights without leaving Supply Chain Management – similar to embedded Power Bi reports experience. 

 In order to get insights, the user should first upload the data to Power Automate Process Mining. Our integration allows to achieve that right from Supply Chain Management UI: 

  • Go to Warehouse management > Setup > Process mining > Warehouse material movement process configuration. 
  • On the Action Pane, select Deploy process to open the deployment wizard and follow the on-screen instructions. 

Note that for sake of integration with Power Automate Process Mining a staging table is created on the Supply Chain Management side. It contains data which is then read by Power Automate Process Mining. As part of the deployment wizard execution, the system will load only 200 cases (closed warehouse works) into the staging table and thus into the Power Automate Process Mining. Below we show how to load a full set of data. 

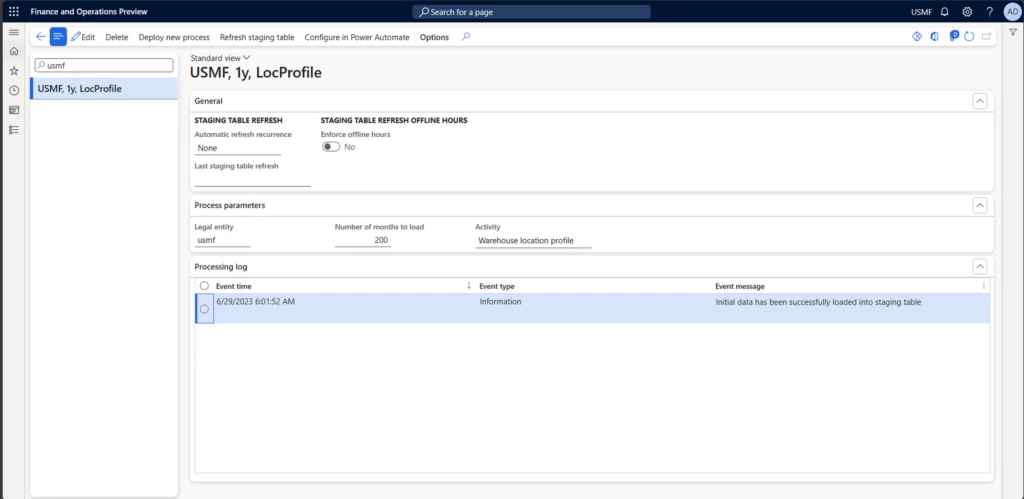
After the successful deployment user will see a page like this: 

Here user can see the processing history – “Processing log” section will show events related to the staging table population and cleanup. Users can refresh the staging table manually by clicking the “Refresh staging table”. One can also set an automatic refresh schedule. But remember that it will only refresh data in the staging table in Supply Chain Management. After the staging table in Supply Chain Management is updated, you would normally want to refresh the Power Automate Process Mining process as well. You can do that by clicking the “Configure in Power Automate” button and trigger a refresh there (you can also setup an automatic refresh there as well). 

You can find more details regarding the setup in the docs here: https://go.microsoft.com/fwlink/?linkid=2235867&clcid=0x409

Let’s now see what insights you can get from this. 

What kind of insights are available? 

 Take a look at this short video to get a feel of the possibilities:

After the deployment is done, users can go to “Warehouse management > Setup > Process mining > Warehouse material movement process configuration” and view the process report.
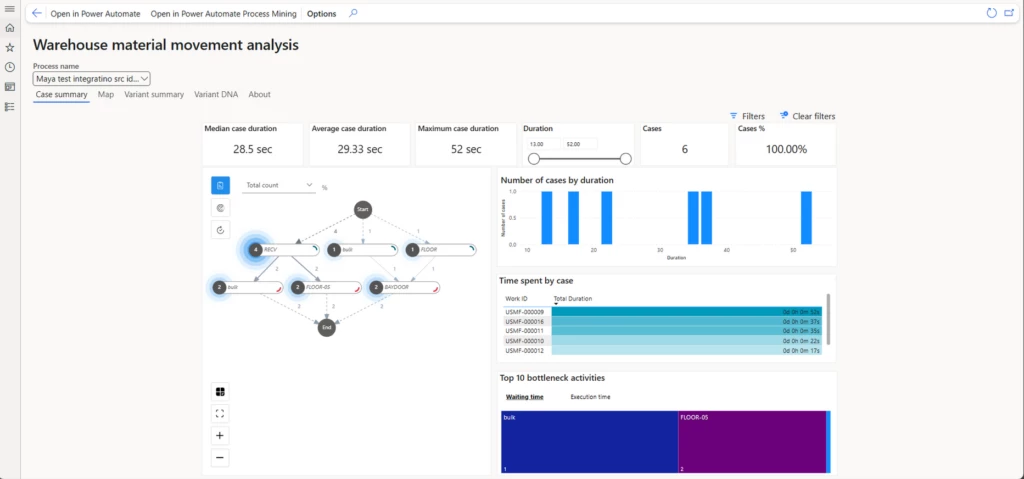
 

On the “Case summary” page one can get a quick overview of the material movements in the warehouse which can feed furthermore detailed investigation. The map control at the left basically shows you how material flows in the warehouse. Depending on your selection during the process deployment nodes can represent either Location Profile, Warehouse Zone or the Warehouse Location. On the map control you can choose if you want to look at frequencies or performance. Other KPIs on page are self-describing – they aim to give you an overview of the overall state of the process and also give you a feeling of the slowest cases (works) and activities (locations). 

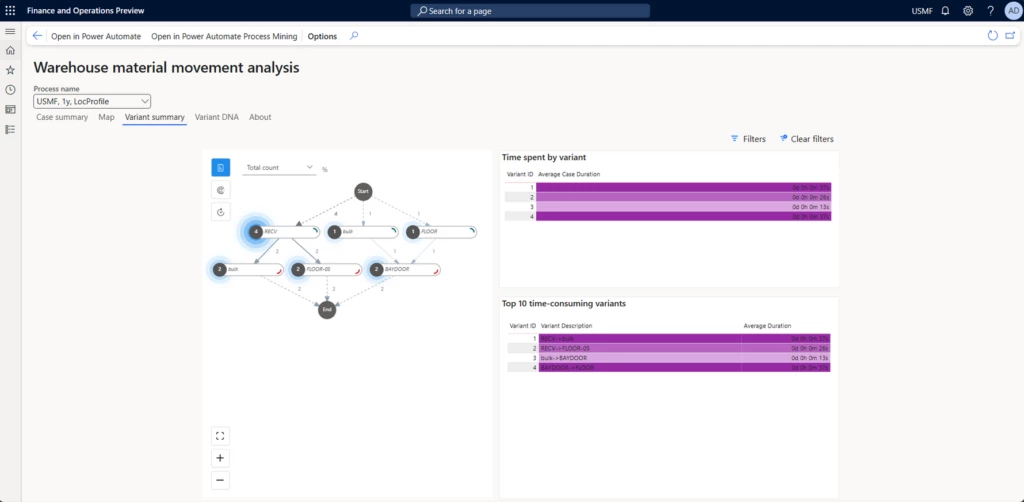
“Variant summary” and “Variant DNA” pages deal with the concept of variants. Several cases (works) could basically repeat the same route through the warehouse. Each unique route is a variant. So by looking at statistic related to variants you could find the most common ones and optimize for those. Or you could find unexpected outliers and further investigate the reason behind them. 
But let’s take a sneak peek into a more advance process mining scenarios available with the desktop application. First you need to download and install it by clicking on the “Open in Power Automate Process Mining” button. 

“Process map” visualization also is a prominent part of the tool. After all, it is very natural to represent processes as graphs. But here you have much richer possibilities about what metrics to show, how to highlight and cluster nodes: 
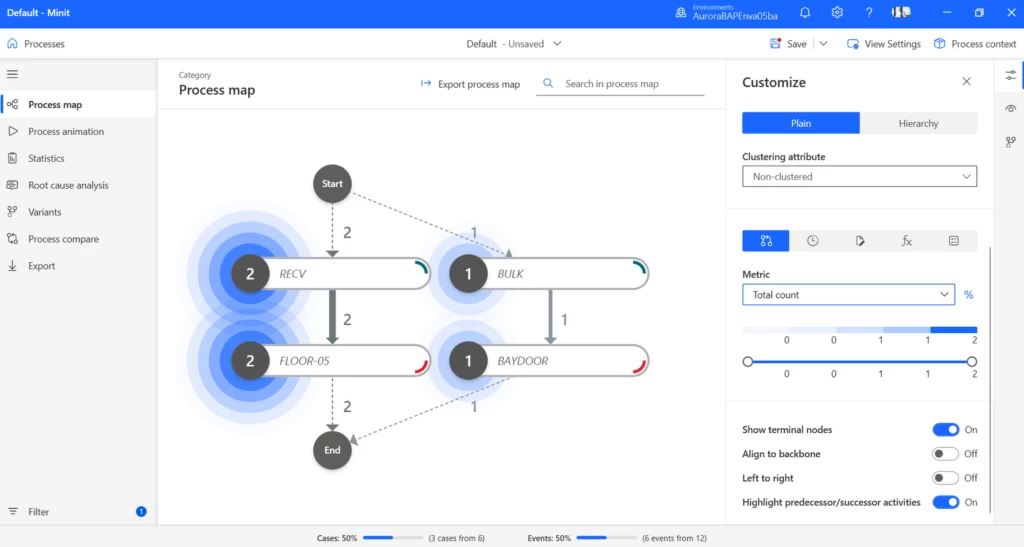
You could even define your own business rules which would influence the process map visualization by directly showing if process violates expected process behavior. For example, here I have created a business rule which highlights where short picking has happened: 
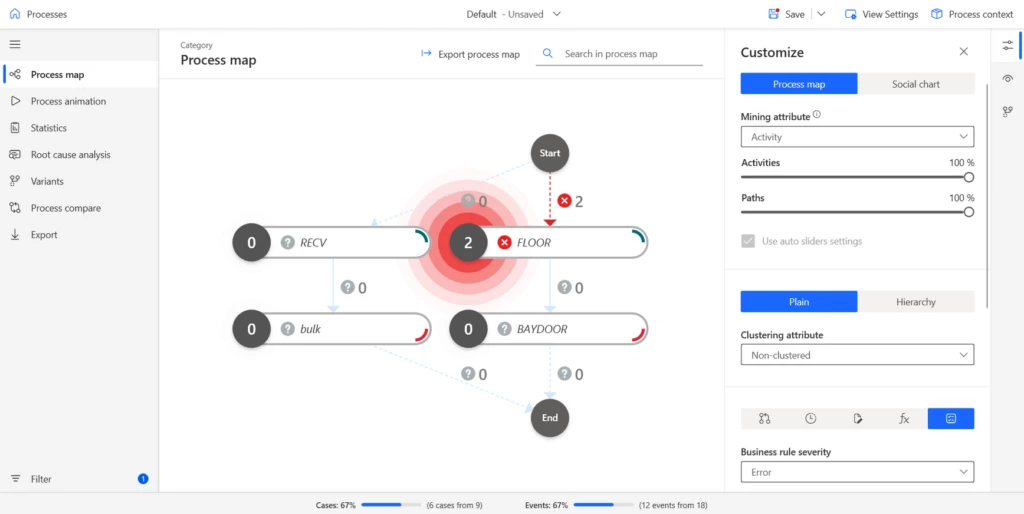
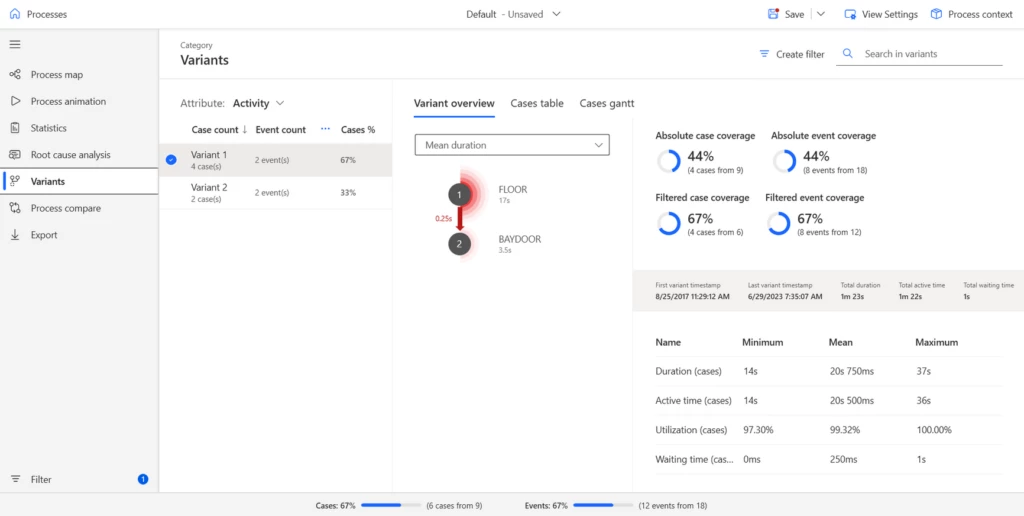
We have met the concept of variants when looking into the Power BI report. But in the desktop application you can get much more insights and statistics around the variants: 
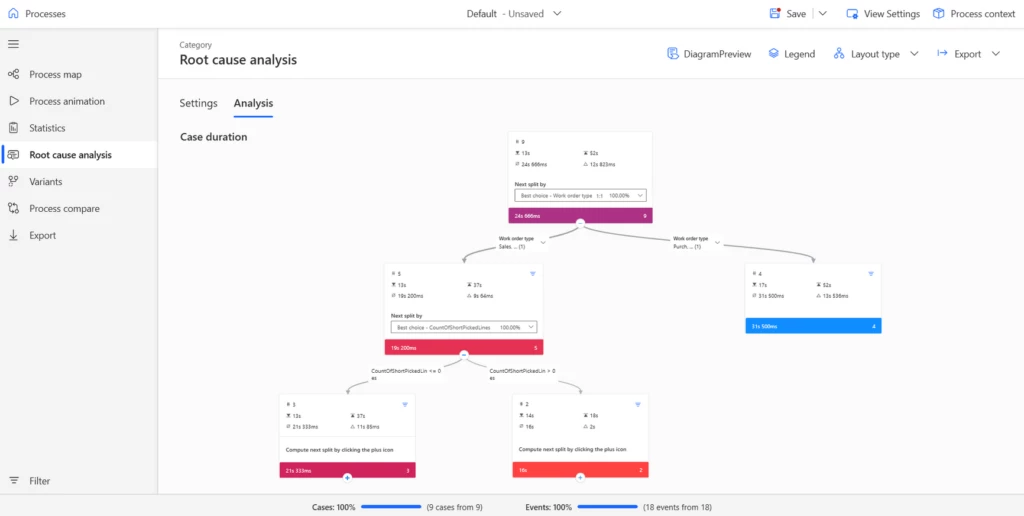
Most of the features we have seen so far are helping at discovering, visualizing and analyzing the processes. But AI powered Root Cause Analysis feature goes beyond that. It allows you to analyze what and how different business factors influence business process performance. For example, you may want to find out which factors are influencing warehouse work execution time the most. Remember though that tool requires the case level attributes to be used in RCA analysis. You can define your own custom metrics (like “Number of short picked lines”) and use those in the RCA. 
Conclusion 

Usage of Power Automate Process Mining for sake of getting insights into the warehouse material movement definitely enriches analytical toolset and allows to get insights which were pretty hard to get before.  


To learn more about this feature and Supply Chain at Microsoft,
click below:

Feature Insights:

Work with added efficiency in quote-to-cash with Dynamics 365 Sales – Finance & Operations | Dynamics 365 | Microsoft Learn

Supply Chain at Microsoft

Take a tour – Supply Chain Management | Microsoft Dynamics 365

We’re excited to launch Free Trial | Microsoft Supply Chain Center Preview ,  which harnesses generative AI to assist Supply Chain managers in real-time communication with suppliers regarding specific news

The post Power Automate Process Mining empowers warehouses to boost their efficiency significantly appeared first on Microsoft Dynamics 365 Blog.

Brought to you by Dr. Ware, Microsoft Office 365 Silver Partner, Charleston SC.

Leveraging learning to take control of your own career satisfaction (and growth!)

This article is contributed. See the original author and article here.

As a tech professional, you’ve got unique insight into the complex challenges—and exciting opportunities—presented by the rapid evolution of technology. For better or for worse, it’s your job to quickly understand, internalize, and advance how new tools and technologies work, and then use them to help your organization, team, or customer to be successful.


But let’s be honest, that’s a lot to ask—especially with competing priorities, varying levels of organizational support, and often limited learning tools that may not suit your learning style, level of knowledge, or even be relevant to your role. What’s important to recognize, though, is that you’re not limited to the training opportunities your organization provides, and that leaning into learning can help you save time by becoming more efficient, gain an edge that separates you from the pack, make your job more fulfilling today, advance your career long term, and just plain make cooler stuff than anyone else.


Doing and feeling better at work


Have you ever noticed how much more invested in your work you feel when you have the tools and knowledge needed to perform at your best? Learning not only improves efficiency but also engagement and increased job satisfaction. In fact, in this study by PearsonVUE, 92% of people who earn technical certifications feel more confident in their abilities (and 37% received salary increases).1


Learning new skills (especially through relevant, real-world scenarios and immersive experiences) grants control over your own professional development. You may find novel ways to specialize in your current role, apply new technologies, identify adjacent opportunities that require only simple additions to your existing skillset, or find and consider entirely new paths for yourself. Together, skilling and the feeling of empowerment that comes from it can enable better outcomes that will benefit you throughout your career.


Navigating job growth and transformation


Deepening and diversifying your skillset is one of the most effective ways to fast-track your career growth, and the resources to do so are more accessible than ever. Modern skilling programs often offer a seamless way to develop your abilities while working, enabling you to stay ahead of evolving demands at work and in the industry with much less lift than was possible in the past.


This is critical now because organizations are creating and evolving roles to keep up with innovation and often can’t find people with the skillsets needed to do them. They’ve learned that upskilling their workforces will be key—in fact, The World Economic Forum’s Future of Jobs Report 2023 found that at 81.2% of surveyed companies, investing in learning and training on the job is the most common workforce strategy that will be adopted to deliver their organization’s business goals in the next five years. 2


This signifies tremendous opportunity for individuals interested in advancing at their current organization (or in differentiating themselves to break into a new career path, or finding a more advanced role at another organization…). As you update and expand your skillset, you’re paving your own path to success by identifying what skills are becoming most in-demand, assessing your competencies, and setting targeted goals to achieve new strengths.


Influencing team outcomes and dynamics


Beyond individual career growth, skilling enhances the quality of your work and team dynamics. Seeking out and learning new skills can help set you apart as an innovator on your team: one who’s got more tools in your toolbox and a leader with the deepest knowledge of the critical technologies. By enabling people to bring innovative ideas to the table, skilling can also foster a culture of continuous improvement and innovation. After all, highly skilled professionals frequently are catalysts for positive change—they’re thought leaders among their peers, promoting the adoption of new technologies and methodologies within teams, which can be key for organizations navigating uncertainty in their industries—and positions you as a standout member of the team.


By staying at the leading edge of technology, you can demonstrate how new skills can transform your team’s work, positioning yourself as a role model for teammates and a catalyst for change. Sharing your expertise can motivate others to seek new skills, too, nurturing an environment that encourages learning, creative collaboration, and professional development.


Making learning a priority


The most important step in upgrading your technical skills is making the commitment to yourself. Once you’ve made that decision, there are a few more steps you can take to ensure success, including:


  • Assess your skills—Learn what the market needs, then compare that with what you already know and identify which skills you should focus your energy on.

  • Set clear goals—Break them down into manageable tasks or topics so you can achieve them.

  • If you can, get your manager’s buy-in and support—This will make it easier for you to make time in your schedule for learning.

  • Consider a microlearning approach—Highly focused mini-modules make it easier to work learning into your busy schedule.

  • Join online communities—The Microsoft Learn community is a great place to start!


If you’re ready to make skilling a priority, a great place to get started is by finding the tools and resources that work best for you. Programs like Microsoft Learn allow you to learn at your own pace and in many different formats (like self-paced learning modules, shows, and games, to name a few) so you can stay engaged with your work, achieve your goals, and advance amid rapid innovation in some of the most exciting and rewarding careers in the world. If you’re interested in learning more about why Microsoft Learn may just be the perfect place to start, check out our blog What’s your learning style? Find your fit with Microsoft Learn.  Or, dive right in and browse our learning paths and modules to find resources that can help you strengthen your skills and remain at the forefront of your industry.


1 2023 Value of IT Certification Candidate Report, Pearson VUE


2 The Future of Jobs Report 2023, World Economic Forum

Analyze IoT/OT device firmware with Microsoft Defender for IoT

Analyze IoT/OT device firmware with Microsoft Defender for IoT

This article is contributed. See the original author and article here.

Consider an organization that has thousands of endpoints on their network that are running 10-year old, unpatched SSH servers. Or when a critical vulnerability like log4shell is discovered, having no easy way to know which of those endpoints are exploitable. This is the situation organizations find themselves in when it comes to IoT and OT devices. This problem is so important that the US National Cybersecurity Strategy released a report in March 2023 indicating the IoT security threat as a strategic objective.


With modern endpoint solutions, IT and security analysts get visibility into the software inventories and known vulnerabilities for IT devices. But for IoT and OT devices without an agent, organizations don’t get the same level of visibility into the growing number of devices on their network. The devices are basically black boxes – without insight into what software or patch level was used to build the device, known vulnerabilities, or other potential anomalies. To help address this challenge, we are excited to announce the firmware analysis capability in Microsoft Defender for IoT – now available in Public Preview.


How firmware analysis works


Firmware analysis takes a binary firmware image that runs on an IoT device and conducts an automated analysis to identify potential security vulnerabilities and weaknesses. This analysis provides insights into the software inventory, weaknesses, and certificates of IoT devices without requiring an endpoint agent to be deployed.


Overview.png


To use the firmware analysis capability, navigate to the “Firmware analysis (preview)” blade in Defender for IoT and upload an unencrypted Linux-based firmware image directly. The image needs to be acquired from the device vendor. Once the image is unpacked and the embedded file system is identified, a thorough security analysis of the firmware image identifies hidden threat vectors.


Identifying software packages and vulnerabilities


Firmware analysis begins by producing an inventory of the open-source packages found in the firmware image, like a Software Bill of Materials (SBOM). This information helps manufacturers track and manage the open-source components in their firmware. Relying on this software inventory, firmware analysis helps security teams identify existing vulnerabilities by scanning the firmware for published Common Vulnerabilities and Exposures (CVEs), bringing them to the attention of device builders and enterprises.


Analyzing binaries


After identifying vulnerabilities, firmware analysis goes a step further by assessing binary hardening. It looks at how the code that runs the device was built, and whether it conforms to security best practices such as Stack Canaries. Binary hardening analysis shows the difficulty or ease of possible binary exploitation and is also a good proxy for the overall security hygiene taken by the manufacturer.


Identifying weak accounts and crypto


Another important threat vector in IoT devices is the use of hardcoded accounts. For example, the Mirai botnet is malware that leverages over 60 default usernames and passwords to take over IoT devices and uses them to conduct mass Distributed Denial of Service (DDoS) attacks. Firmware analysis in Defender for IoT identifies built-in user accounts and the algorithms used to encrypt password hashes of those accounts. Device manufacturers can use this information to make improvements to their firmware, and enterprise operators will be able to identify devices on their network that may pose risk.


Firmware analysis also identifies cryptographic material embedded in the device. Adversaries commonly target these materials as entry points. For example, expired, revoked, or self-signed SSL certificates can compromise communication from a device to a cloud service, potentially leaking organizational data or opening the device up to exploitation. Another potential threat vector are public and private keys that were inadvertently left in the device by the developers and grant attackers access to the device or cloud service.


Let us know what you think


Navigating the increasingly complex IoT landscape requires the right set of tools to paint a clearer picture into your IoT environment. The firmware analysis capability in Defender for IoT is enabling security teams to get deeper visibility into these IoT/OT devices by providing better insights into the foundational software they are built on.


We are excited to share the firmware analysis capability with you. If you have any feedback, please feel free to let us know in the comments below.


To learn more about firmware analysis, click here.

Deciphering consumer desires: Elevating customer journeys in retail CPG

Deciphering consumer desires: Elevating customer journeys in retail CPG

This article is contributed. See the original author and article here.

What do customers want? They want the consumer goods brands they buy and love to deliver a total experience. One that is transparent across the product lifecycle and is personalized at every touchpoint, regardless of whether it’s the ever-demanding business-to-consumer (B2C) realm or the not-so-different-anymore business-to-business (B2B) landscape of consumer packaged goods (CPG) distributors and retailers.

According to Gartner® Top Strategic Technology Trends in Consumer Goods Manufacturing for 2023, the top CG technology trends in 2023 focus on customers, technology, and sustainability. This translates to consumer behaviors evaluating three primary areas:

  • Financial impact and uncertainty. What is the value of this product? Is it worth the money? Does it work?
  • Trust in manufacturer integrity. Is the manufacturer doing what it says it is doing?
  • The experience working with and for a company. How do consumer goods manufacturers treat suppliers, employees, and consumers? Are they providing and participating in current platforms and technologies?

The pressure is on CPG brands to meet these accelerating expectations and answer these unspoken questions that are top of mind for consumers.

How can brands accomplish this when not all customer journeys are alike and consumers are in control?

Connect your brands, employees, and consumers

Evolve with changing consumer preferences

Explore solutions 

Evolving with the customer is essential

Journeys are no longer linear and are driven by the customer—be it the consumer, retailer, or distributor—who determines the preferred path including any stops, starts, and detours along the way. Giving them the option to choose what messages they want to receive along with when and how they receive them is essential for creating a successful journey. Some customers prefer human interaction, others self-service across digital channels, and many require a combination of physical and digital. Others prefer to avoid personal interaction and choose a tech interface whenever possible. Giving customers these choices require brands to have synergy across multiple experience disciplines. It requires a shift from customer experience (CX) to what Gartner® calls total experience (TX). According to Gartner®, “TX is a strategy that creates superior shared experiences by intertwining the multi-experience (MX), CX, employee experience (EX), and user experience (UX) disciplines.” A sophisticated customer experience is the goal, but more importantly, it is delivering a total experience that meets or exceeds customer expectations. Research on this topic brings home how critical this is. 

A recent Harvard Business Review article brings home how critical this is.

Our recent survey of 6,200 customers in China, France, and the United States uncovered seven CX factors that directly influence customer satisfaction. The first four—convenience, choice, navigation, and payments—are indispensable. That is, the presence or absence of these factors determines whether a customer judges a particular experience as good or bad. Think of them as table stakes. The remainder—ambiance, expertise, and touch-and-feel—amplify the baseline level of satisfaction. While their presence boosts satisfaction from “good” to “very good” 70 percent of the time, their absence turns a “bad” experience into a “very bad one” 89 percent of the time.”

Identifying ways to understand and adapt to evolving consumer preferences along with delivering direct-to-consumer engagement is integral to enhancing the customer journey.

Our approach

It starts with data 

Brands are looking for ways to understand consumers better. They need insights in order to know them and orchestrate customer journeys as well as identify interactions that contribute to customer lifetime value (CLTV), churn, and loyalty. This requires CPG brands to gain a holistic understanding of consumers and build brand equity through tailored data-driven marketing and experiences.  

To achieve this, CPG brands need to leverage data from multiple sources, such as point-of-sale, e-commerce, social media, loyalty programs, surveys, and third-party providers, and combine them into a single view of the consumer. This improves consumer understanding, empowering brands to directly engage with individuals and target their personal needs, all powered by AI.

It requires elevating the consumer experience

In today’s uncertain times, consumers demand an end-to-end experience that provides value, quality, convenience, inclusivity, and sustainability. Brands must not only meet these expectations but also elevate the experience to the next level. This requires real-time personalization throughout the customer’s journey. Microsoft Dynamics 365 Marketing utilizes insights about the consumer and activates them in real-time to optimize journey workflows, to create generative AI-powered segments and content to deliver hyper-personalized experiences that drive customer engagement. For example, Campari Group, a worldwide leader in spirits, wines, and non-alcoholic apéritifs industry is using our solution to increase awareness of Negroni week, an event that celebrates one of the world’s greatest cocktails and raises money for global charitable causes. Microsoft Dynamics 365 Marketing generative AI Copilot is being used to send personalized emails to venue owners to get them involved. With generative AI targeting, Campari uses natural language to describe segments and uses generative AI Copilot for content ideas using key points to generate text suggestions expediting campaign creation and increasing marketer productivity. Watch Campari Copilot in Microsoft Dynamics 365 Marketing to learn more.

It’s collaborative

Whether it’s brand building, product development, supply chain, or customer care, everyone is responsible for customer experience and optimizing the customer journey. It is a collaborative effort to deliver a great customer experience and requires breaking down data, technical, and people. Customer data needs to be combined with business operations data, marketing, sales, service, and supply chain should work in unison and be seamlessly integrated.

Collaborative intelligence can help CPG brands and retailers:

  1. Understand customer behavior, preferences, and needs better, and tailor their offerings accordingly.
  2. Optimize their assortment, pricing, and merchandising strategies, and increase customer satisfaction and loyalty.
  3. Innovate faster and launch new products that meet customer demand.
  4. Build trust and transparency with each other and with customers.

This is exactly what Natuzzi is doing using our solution to bring beauty and timeless harmony to people around the world. Working with Microsoft Dynamics 365 enables Natuzzi to deliver a well-crafted experience across both B2C and B2B lines of business and empowers their entire global team spanning marketing, sales, field service, and customer care to deliver a seamless total experience. In a disjointed selling environment, Natuzzi can communicate better and more consistently with each customer with improved ongoing messaging, promotions, and events. With targeted campaigns, they are moving contacts to prospects and prospects to customers. Luxury furniture is a complicated market, and our solution keeps Natuzzi close to its customers and on top of market trends.

Learn more

Learn more about Microsoft Dynamics 365 Customer InsightsDynamics 365 Marketing, and Dynamics 365 Sales to meet your customers’ expectations and bring your customers into focus.

You can also download a free trial of Microsoft Dynamics 365 Marketing. And for the latest on how Microsoft and our partners are helping retailers elevate the customer experience, download the e-book Reimagine Retail in the Digital Age.

Discover more Microsoft solutions for the consumer goods industry.


GARTNER® is a registered trademark and service mark of Gartner, Inc. and/or its affiliates in the U.S. and internationally and is used herein with permission. All rights reserved.

The post Deciphering consumer desires: Elevating customer journeys in retail CPG appeared first on Microsoft Dynamics 365 Blog.

Brought to you by Dr. Ware, Microsoft Office 365 Silver Partner, Charleston SC.

Master the Power Platform: Join the Ultimate Power Apps Challenge by Contoso Estate!

Master the Power Platform: Join the Ultimate Power Apps Challenge by Contoso Estate!

This article is contributed. See the original author and article here.

Social Posts (Desktop Wallpaper) (3).png


Shine with a Power Apps Challenge for Contoso Estate! 


Learn by doing! Join this beginner challenge to develop your Power Platform skills.


Benefits:


– Create a portfolio-worthy project


– Chance to be featured in Power Apps Gallery


– Boost your Power Apps development confidence


About the Challenge:


Contoso
(Fictional), a real estate company, needs a Power Apps Developer to automate their Estate Management Operations.


Scenario:


To ensure security, visitors need a passcode to enter the estate. The passcode comprises:


Passcode = Street Unique Shortcode + House Number + Word for the day (randomly generated).


Challenges:


  1. Costly and time-consuming phone calls for passcode requests

  2. Delay due to multiple callers

  3. Security team burnout from handling numerous calls daily

  4. Human resources needed for this task


Your Task:


Part 1: Create a Dataverse table for the solution.


Part 2: Develop the Power Apps Screen/Screens to meet the following requirements:


  • Allow registered residents to access the application

  • Generate a passcode with a button click

  • Store the randomly generated word of the day in a table

  • Display the passcode without the option to generate a new one on the same day

  • Use an Azure Function or any public API to generate the word of the day

  • Store passcode requests with requester details

  • Design admin and resident screens with request history and basic statistics


Requirements List:


  1. Only registered residents in the database can access the application.

  2. Residents should be able to generate a passcode with a click of a button.

  3. The passcode format must follow this pattern: Street Unique Shortcode + House Number + Randomly generated Word for the day, stored in a table.

  4. If a resident generates a passcode for the day, opening the app again on the same day should only reveal the code without an option to generate a new one.

  5. Utilize an Azure Function or any public API to generate the Word for the day. The nuget library “Bogus” in .NET can be used for this purpose, or any other library, API, or service the developer prefers.

  6. All passcode requests should be stored in a table with detailed information about the requester.

  7. The admin should have access to a screen displaying a list of all request history on a table, including requester details. This screen should also feature basic statistics, such as the total number of requests, and include a filter button for dates.

  8. Residents should have access to a screen displaying a list of all their request history on a table, along with basic statistics like the total number of requests. The screen should also have a filter button for dates.

  9. Developers can make other assumptions regarding the implementation, but they must document these assumptions.


What are you waiting for? Time to get started!


Get started and document your solution following the provided guide!


Additional Resources


Participate in the Microsoft Learn AI Skill Challenge. Click to participate


Microsoft Learn: https://aka.ms/learnstudent