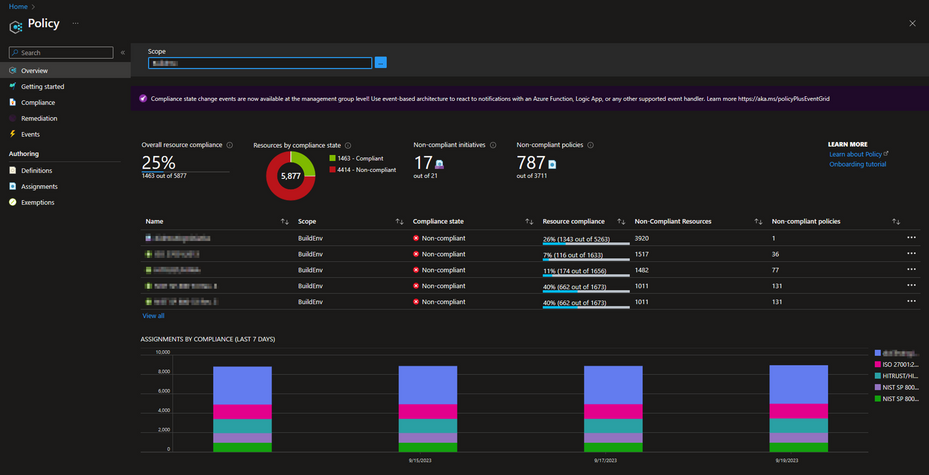
by Contributed | Sep 20, 2023 | Technology
This article is contributed. See the original author and article here.
Introduction
In today’s interconnected digital landscape, Distributed Denial of Service (DDoS) attacks have become a persistent threat to organizations of all sizes. These attacks can disrupt services, compromise sensitive data, and lead to financial losses. To counter this threat, Microsoft Azure offers robust DDoS protection capabilities. In this blog post, we will explore how organizations can leverage Azure Policy to enforce and manage Azure DDoS Protection, enhancing their security posture and ensuring uninterrupted services.
The main objective of this post is to equip you with the knowledge to effectively utilize the built-in policies for Azure DDoS protection within your environment. This includes enabling automated scaling without the need for manual intervention and ensuring that DDoS protection is enabled across your public endpoints.
Understanding Azure DDoS Protection
Microsoft Azure DDoS Protection is a service designed to protect your applications from the impact of DDoS (Distributed Denial of Service) attacks. These attacks aim to overwhelm an application’s resources, rendering it inaccessible to legitimate users. Azure DDoS Protection provides enhanced mitigation capabilities that are automatically tuned to protect your specific Azure resources within a virtual network. It operates at both layer 3 (network layer) and layer 4 (transport layer) to defend against volumetric and protocol attacks.
Azure Policy Overview
Azure Policy is an integral part of Azure Governance, offering centralized automation for enforcing and monitoring organizational standards and compliance across your Azure environment. It streamlines the deployment and management of policies, ensuring consistency in resource configurations. Azure Policy is a powerful tool for aligning resources with industry and organizational security standards, reducing manual effort, and enhancing operational efficiency.

Benefits of Using Azure Policy for DDoS Protection
1- Consistency Across Resources:
Azure Policy enables you to establish a uniform DDoS protection framework across your entire Azure environment. This consistency ensures that no resource is left vulnerable to potential DDoS attacks due to misconfigurations or oversight.
2- Streamlined Automation:
The automation capabilities provided by Azure Policy are great for managing DDoS protection. Instead of manually configuring DDoS settings for each individual resource, Azure Policy allows you to define policies once and apply them consistently across your entire Azure infrastructure. This streamlining of processes not only saves time but also minimizes the risk of human error in policy implementation.
3- Enhanced Compliance:
Adherence to industry and organizational security standards is a top priority for businesses of all sizes. Azure Policy facilitates compliance by allowing you to align your resources with specific security baselines. By enforcing DDoS protection policies that adhere to these standards, you can demonstrate commitment to security and regulatory compliance, thereby improving the trust of your customers and partners.
Built-In Azure DDoS Protection definitions
Note: Azure Standard DDoS Protection has been renamed as Azure DDoS Network Protection. However, it’s important to be aware that the names of the built-in policies have not yet been updated to reflect this change.
Azure DDoS Protection Standard should be enabled
This Azure policy is designed to ensure that all virtual networks with a subnet that have an application gateway with a public IP, have Azure DDoS Network Protection enabled. The application gateway can be configured to have a public IP address, a private IP address, or both. A public IP address is required when you host a backend that clients must access over the Internet via an Internet-facing public IP. This policy ensures that these resources are adequately protected from DDoS attacks, enhancing the security and availability of applications hosted on Azure.
For detailed guidance deploying Application gateway with Azure DDoS protection, see here: Tutorial: Protect your application gateway with Azure DDoS Network Protection – Azure Application Gateway | Microsoft Learn
Public IP addresses should have resource logs enabled for Azure DDoS Protection Standard
This policy ensures that resource logs for all public IP addresses are enabled and configured to stream to a Log Analytics workspace. This is important as it provides detailed visibility into the traffic data and DDoS attack information.
The diagnostic logs provide insights into DDoS Protection notifications, mitigation reports, and mitigation flow logs during and after a DDoS attack. These logs can be viewed in your Log Analytics workspace. You will get notifications anytime a public IP resource is under attack, and when attack mitigation is over. Attack mitigation flow logs allow you to review the dropped traffic, forwarded traffic, and other interesting data-points during an active DDoS attack in near-real time. Mitigation flow logs offers regular reports on DDoS mitigation, with updates provided every 5 minutes. Additionally, a post-mitigation report is generated for a comprehensive overview.
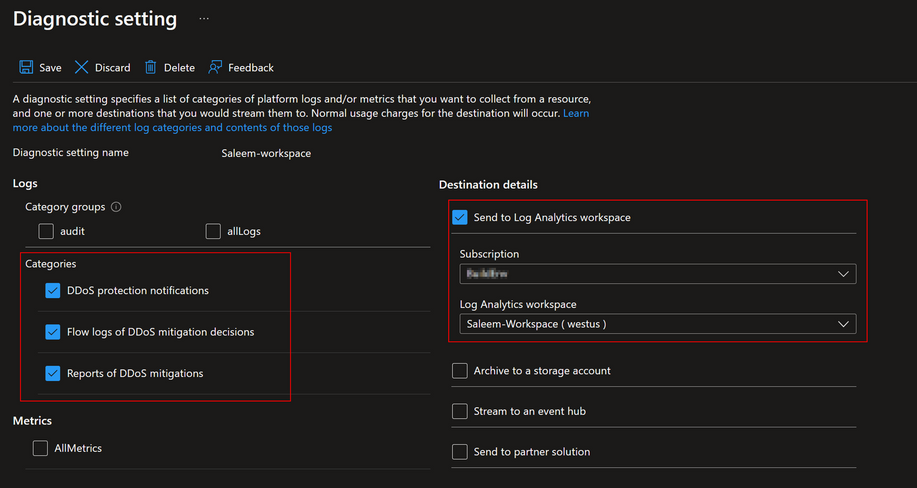
This policy ensures that these logs are properly configured and streamed to a Log Analytics workspace for further analysis and monitoring. This enhances the security posture by providing detailed insights into traffic patterns and potential security threats while also providing a scalable way to enable telemetry without manual work.
Virtual networks should be protected by Azure DDoS Protection
This policy is designed to ensure that all your virtual networks are associated with a DDoS Protection Network plan. This policy scans your Azure environment and identifies any virtual networks that do not have the DDoS Protection Network plan enabled. If such a network is found, the policy can optionally create a remediation task. This task will associate the non-compliant virtual network with the specified DDoS Protection Plan. This policy helps maintain the security and integrity of your Azure environment by enforcing the best practices for DDoS protection.
We also have a more granular version of this policy, called “Virtual Networks should be protected by Azure DDoS Protection Standard – tag based”. This policy allows you to audit only those VNets that carry a specific tag. This means you can enable DDoS protection exclusively on VNets that contain your chosen tag. While this feature, you can deploy it directly from our GitHub repository: Azure-Network-Security/Azure DDoS Protection/Policy – Azure Policy Definitions/Policy – Virtual Networks should be enabled with DDoS plan at master · Azure/Azure-Network-Security (github.com)
Implementing Azure Policy for DDoS Protection
Defining the Policy
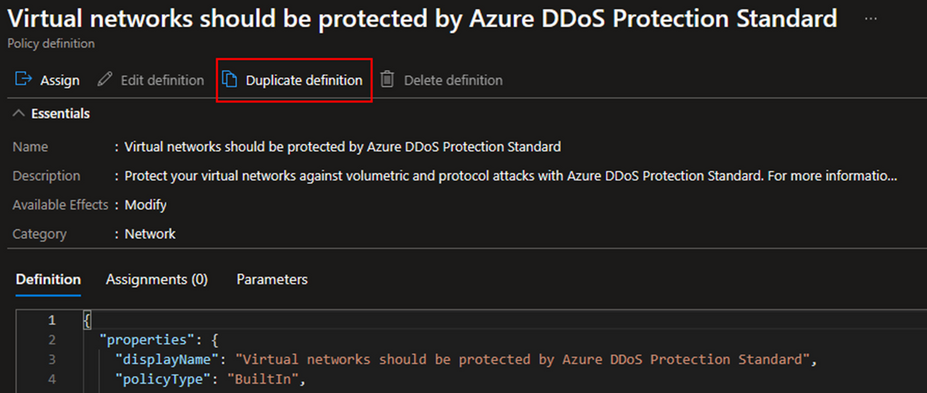
The first step starts with the selection of policy definitions. Given that we already have a set of built-in policies at our disposal, we will choose one of them. In the ‘Definitions’ section, search for ‘DDoS’. For the purposes of this tutorial, I will use the definition titled ‘Virtual networks should be protected by Azure DDoS Protection Standard.’ Upon opening this definition, you can read its description and look at the definition logic.
If you wish to modify the built-in definition before assigning it, you can select the duplicate option to create a copy of it. Choose a name for your duplicated definition, specify its category, and provide a customized description. After saving your changes, a new definition will be created, complete with your changes and categorized as a custom definition.
Policy Assignment and Scope
For the next step let’s start assigning our policy definition. To do this, select the ‘Assign’ option located in the top left corner under the definition. The first section you’ll see is ‘Scope’. Here, select the subscription where you want the policy to be active. For a more granular approach, you can also select a specific resource group. In the ‘Basics’ section, you have the option to change the assignment name and add a description.
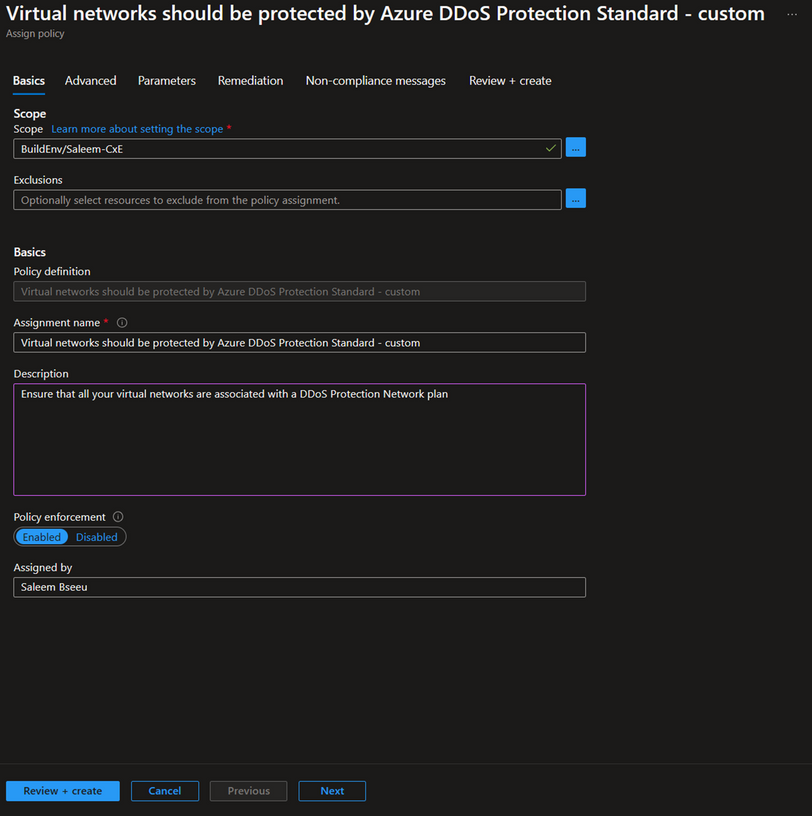
Note: Make sure to select ‘Enabled’ under policy enforcement if you want the policy to be actively enforced. If you only want to identify which resources are compliant without enforcing the policy, you can leave this setting as ‘Disabled’. For more information about policy enforcement, here Details of the policy assignment structure – Azure Policy | Microsoft Learn
Next, go to the ‘Parameters’ section and choose the DDoS protection plan that you intend to use for protecting your VNets. This selected plan will be used to add your VNets to it.
The final section is ‘Remediation’. Here, you have the option to create a remediation task. This means that when the policy is created, the remediation will apply not only to newly created resources but also to existing ones. If this aligns with your desired outcome, check the box for ‘Create a remediation task’ and select the DDoS policy.
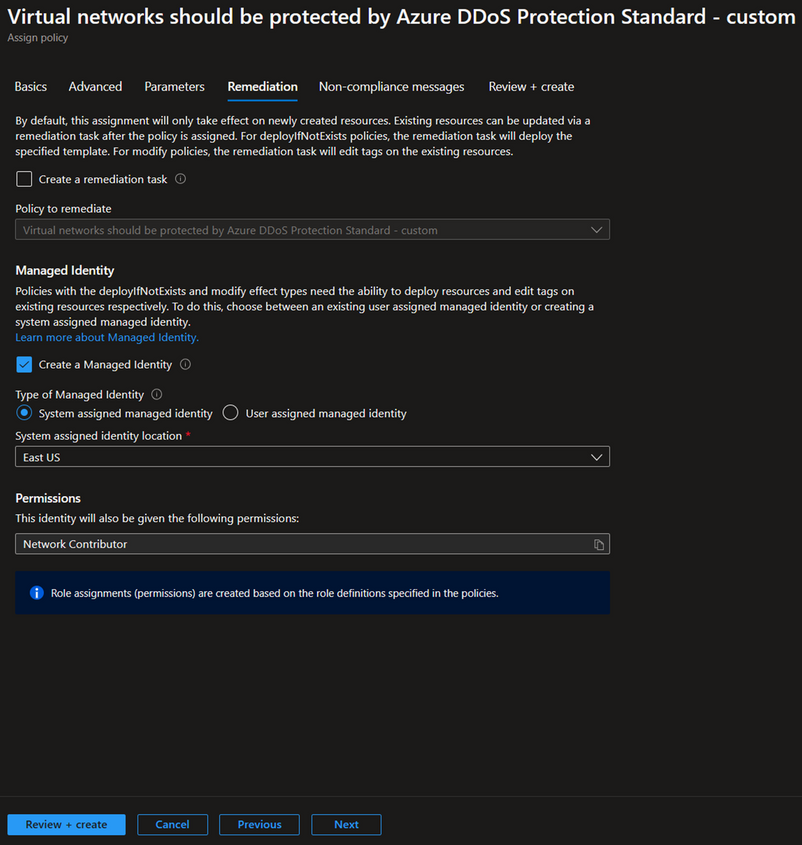
Since our policy has a modify effect, it requires either an existing user-assigned managed identity or a system-assigned managed identity. The portal will automatically provide an option to create a managed identity with the necessary permissions, which in this case is ‘Network Contributor’. To learn more about managed identity, see here Remediate non-compliant resources – Azure Policy | Microsoft Learn
Policy Enforcement Best Practices
1- Granularity: Policies should be customized to match the specific needs of different resource types and their importance levels. For example, not all VNets may need DDoS protection, and applying a one-size-fits-all policy across all resources could lead to unnecessary expenses. That’s why it’s important to evaluate the needs of each resource. Resources that handle sensitive data or are vital for business operations may need stricter policies compared to those that are less important. This approach ensures that each resource is properly secured while also being cost-effective.
2- Testing: Before deploying policies to critical resources, it’s recommended to test them in a non-production environment. This allows you to assess the impact of the policies and make necessary adjustments without affecting your production environment. It also helps in identifying any potential issues or conflicts with existing configurations.
3- Monitoring: Regularly reviewing policy compliance is crucial for maintaining a secure and compliant Azure environment. This involves checking the compliance status of your resources and adjusting policies as necessary based on the review. Azure Policy provides compliance reports that can help in this process. For more information on how to get compliance data or manually start an evaluation scan, see here Get policy compliance data – Azure Policy | Microsoft Learn
Conclusion
Using Azure Policy to enforce and manage Azure DDoS Protection is an essential part of a proactive and comprehensive security strategy. It allows you to continuously monitor your Azure environment, identify non-compliant resources, and take corrective action promptly. This approach not only enhances the security of your applications but also contributes to maintaining their availability and reliability.
Resources
Azure DDoS Protection Overview | Microsoft Learn
Overview of Azure Policy – Azure Policy | Microsoft Learn
Details of the policy definition structure – Azure Policy | Microsoft Learn
Understand scope in Azure Policy – Azure Policy | Microsoft Learn
Deploying DDoS Protection Standard with Azure Policy – Microsoft Community Hub
by Contributed | Sep 19, 2023 | Technology
This article is contributed. See the original author and article here.
Microsoft Defender External Attack Surface Management (EASM) continuously discovers a large amount of up-to-the-minute attack surface data, helping organizations know where their internet-facing assets lie. Connecting and automating this data flow to all our customers’ mission-critical systems that keep their organizations secure is essential to understanding the data holistically and gaining new insights, so organizations can make informed, data-driven decisions.
In June, we released the new Data Connections feature within Defender EASM, which enables seamless integration into Azure Log Analytics and Azure Data Explorer, helping users supplement existing workflows to gain new insights as the data flows from Defender EASM into the other tools. The new capability is currently available in public preview for Defender EASM customers.
Why use data connections?
The data connectors for Log Analytics and Azure Data Explorer can easily augment existing workflows by automating recurring exports of all asset inventory data and the set of potential security issues flagged as insights to specified destinations to keep other tools continually updated with the latest findings from Defender EASM. Benefits of this feature include:
- Users have the option to build custom dashboards and queries to enhance security intelligence. This allows for easy visualization of attack surface data, to then go and perform data analysis.
- Custom reporting enables users to leverage tools such as Power BI. Defender EASM data connections will allow the creation of custom reports that can be sent to CISOs and highlight security focus areas.
- Data connections enable users to easily access their environment for policy compliance.
- Defender EASM’s data connectors significantly enrich existing data to be better utilized for threat hunting and incident handling.
- Data connectors for Log Analytics and Azure Data Explorer enable organizations to integrate Defender EASM workflows into the local systems for improved monitoring, alerting, and remediation.
In what situations could the data connections be used?
While there are many reasons to enable data connections, below are a few common use cases and scenarios you may find useful.
- The feature allows users to push asset data or insights to Log Analytics to create alerts based on custom asset or insight data queries. For example, a query that returns new High Severity vulnerability records detected on Approved inventory can be used to trigger an email alert, giving details and remediation steps to the appropriate stakeholders. The ingested logs and Alerts generated by Log Analytics can also be visualized within tools like Workbooks or Microsoft Sentinel.
- Users can push asset data or insights to Azure Data Explorer/Kusto to generate custom reports or dashboards via Workbooks or Power BI. For example, a custom-developed dashboard that shows all of a customer’s approved Hosts with recent/current expired SSL Certificates that can be used for directing and assigning the appropriate stakeholders in your organization for remediation.
- Users can include asset data or insights in a data lake or other automated workflows. For example, generating trends on new asset creation and attack surface composition or discovering unknown cloud assets that return 200 response codes.
How do I get started with Data Connections?
We invite all Microsoft Defender EASM users to participate in using the data connections to Log Analytics and/or Azure Data Explorer so you can experience the enhanced value it can bring to your data, and thus, your security insights.
Step 1) Ensure your organization meets the preview prerequisites
Aspect
|
Details
|
Required/Preferred
Environmental Requirements
|
Defender EASM resource must be created and contain an Attack Surface footprint.
Must have Log Analytics and/or Azure Data Explorer/ Kusto
|
Required Roles & Permissions
|
– Must have a tenant with Defender EASM created (or be willing to create one). This provisions the EASM API service principal.
– User and Ingestor roles assigned to EASM API (Azure Data Explorer)
|
Step 2) Access the Data Connections
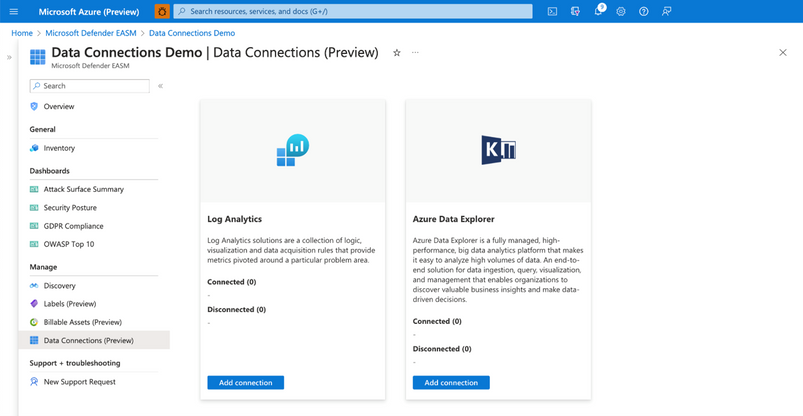
Users can access Data Connections from the Manage section of the left-hand navigation pane (shown below) within their Defender EASM resource blade. This page displays the data connectors for both Log Analytics and Azure Data Explorer, listing any current connections and providing the option to add, edit or remove connections.

Connection prerequisites: To successfully create a data connection, users must first ensure that they have completed the required steps to grant Defender EASM permission for the tool of their choice. This process enables the application to ingest our exported data and provides the authentication credentials needed to configure the connection.
Step 3: Configure Permissions for Log Analytics and/or Azure Data Explorer
Log Analytics:
- Open the Log Analytics workspace that will ingest your Defender EASM data or create a new workspace.
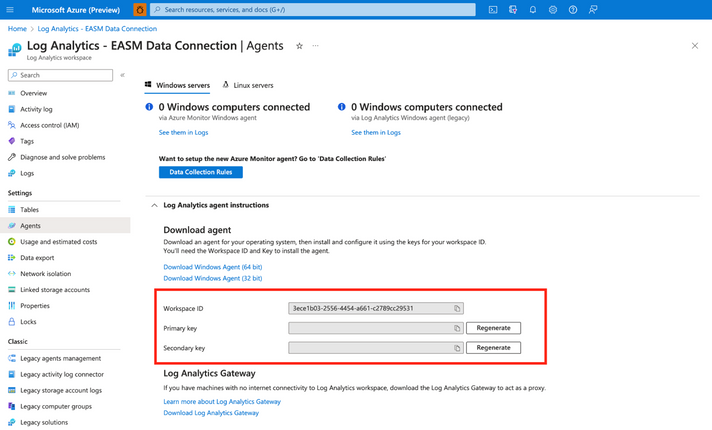
- On the leftmost pane, under Settings, select Agents.
Azure Data Explorer:
- Expand the Log Analytics agent instructions section to view your workspace ID and primary key. These values are used to set up your data connection.
- Open the Azure Data Explorer cluster that will ingest your Defender EASM data or create a new cluster.
- Select Databases in the Data section of the left-hand navigation menu.
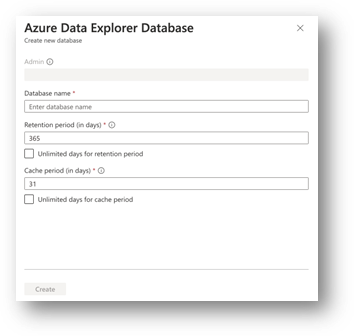
Select + Add Database to create a database to house your Defender EASM data.

4. Name your database, configure retention and cache periods, then select Create.
5. Once your Defender EASM database has been created, click on the database name to open the details page. Select Permissions from the Overview section of the left-hand navigation menu.
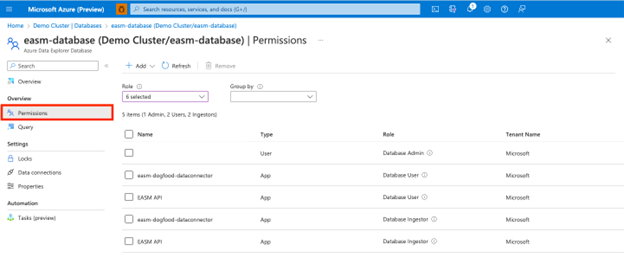
To successfully export Defender EASM data to Data Explorer, users must create two new permissions for the EASM API: user and ingestor.
6. First, select + Add and create a user. Search for “EASM API,” select the value, then click Select.
7. Select + Add to create an ingestor. Follow the same steps outlined above to add the EASM API as an ingestor.
8. Your database is now ready to connect to Defender EASM.
Step 4: Add data connections for Log Analytics and/or Azure Data Explorer
Log Analytics:
Users can connect their Defender EASM data to either Log Analytics or Azure Data Explorer. To do so, select “Add connection” from the Data Connections page for the appropriate tool. The Log Analytics connection addition is covered below.
A configuration pane will open on the right-hand side of the Data Connections screen as shown below. The following fields are required:
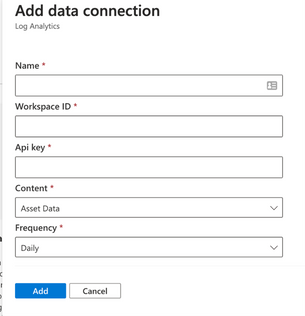
- Name: enter a name for this data connection.
- Workspace ID For Log Analytics, users enter the Workspace ID and the coinciding API key associated with their account.
- Api key Log Analytics users enter the API key associated with their account
- Content: users can select to integrate asset data, attack surface insights, or both datasets.
- Frequency: select the frequency that the Defender EASM connection sends updated data to the tool of your choice. Available options are daily, weekly, and monthly.
Azure Data Explorer:
The Azure Data Explorer connection addition is covered below.
A configuration pane will open on the right-hand side of the Data Connections screen as shown below. The following fields are required:
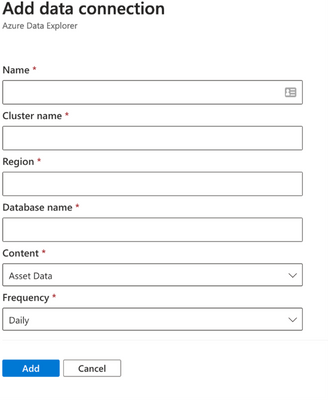
- Name: enter a name for this data connection.
- Cluster name:
- Region: The region associated with Azure Data explorer
- Database: The database associated with the Azure Data explorer
- Content: users can select to integrate asset data, attack surface insights, or both datasets.
- Frequency: select the frequency that the Defender EASM connection sends updated data to the tool of your choice. Available options are daily, weekly, and monthly.
Step 5: View data and gain security insights
To view the ingested Defender EASM asset and attack surface insight data, you can use the query editor available by selecting the ”Logs” option from the left hand menu of the Azure Log Analytics Workspace you created earlier. These tables are also updated at the Data Connection configuration record frequency.
Extending Defender EASM Asset and Insights data, via these two new data connectors, into Azure ecosystem tools like Log Analytics and Data Explorer enables customers to orchestrate the creation of contextualized data views that can be operationalized into existing workflows and provides the facility and toolsets for analysts to investigate and develop new methods of applicative Attack Surface Management.
Additional resources:
by Contributed | Sep 18, 2023 | Technology
This article is contributed. See the original author and article here.
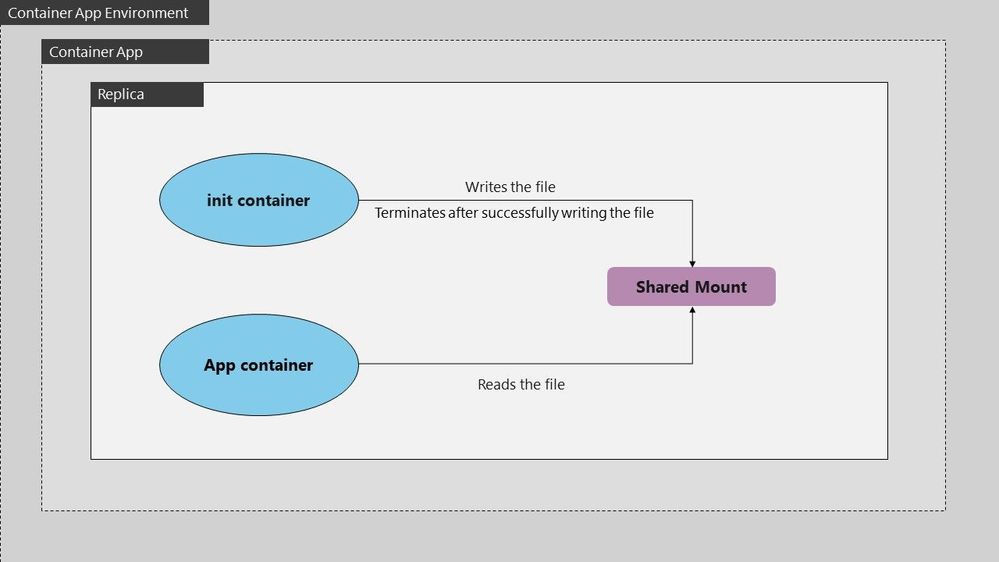
In some scenarios, you might need to preprocess files before they’re used by your application. For instance, you’re deploying a machine learning model that relies on precomputed data files. An Init Container can download, extract, or preprocess these files, ensuring they are ready for the main application container. This approach simplifies the deployment process and ensures that your application always has access to the required data.
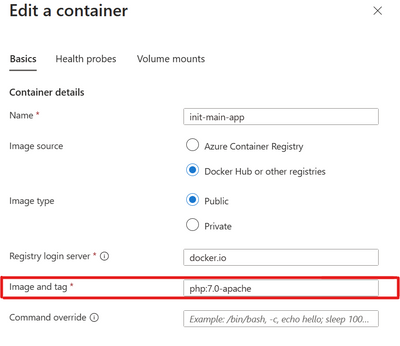
The below example defines a simple Pod that has an init container which downloads a file from some resource to a file share which is shared between the init and main app container. The main app container is running a php-apache image and serves the landing page using the index.php file downloaded into the shared file space.

The init container mounts the shared volume at /mydir , and the main application container mounts the shared volume at /var/www/html. The init container runs the following command to download the file and then terminates: wget -O /mydir/index.php http://info.cern.ch.
Configurations and dockerfile for init container:
- Dockerfile for init which downloads an index.php file under /mydir:
FROM busybox:1.28
WORKDIR /
ENTRYPOINT ["wget", "-O", "/mydir/index.php", "http://info.cern.ch"]
Configuration for main app container:
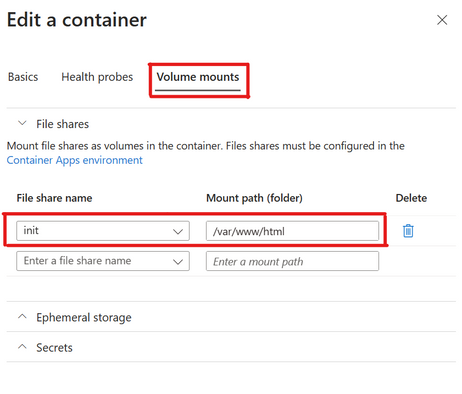
- Create main app container mounting file share named init on path /var/www/html:
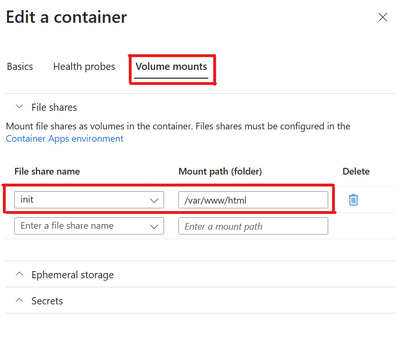
- Main app container configuration which uses php-apache image and serves the index.php file from DocumentRoot /var/www/html:
Output:

Logs:

by Contributed | Sep 17, 2023 | Technology
This article is contributed. See the original author and article here.
We got a new issue when our customer found provisioning a Sync Group named ‘XXX’ failed with error: Database re-provisioning failed with the exception ‘SqlException ID: XX-900f-42a5-9852-XXX, Error Code: -2146232060 – SqlError Number:229, Message: SQL error with code 229.’. Following I would like to share some details what is the error and the solution to fix it.
Let’s break this down:
- Sync Group Issue: The Sync Group ‘XXX’ is experiencing a problem.
- Database re-provisioning failed: The attempt to reset or reprovision the database in this group failed.
- SqlException ID: A unique identifier associated with this particular SQL exception.
- Error Code -2146232060: The error code associated with this exception.
- SqlError Number 229: This points to the error number from the SQL Server. In SQL Server, error 229 is related to a “Permission Denied” error.
Root Cause
The SqlError Number 229, “Permission Denied,” is the most telling part of the error message. It means that the process trying to perform the action doesn’t have adequate permissions to carry out its task.
In the context of Sync Groups, several operations occur behind the scenes to ensure data is kept consistent across all nodes. These operations include accessing metadata tables, system-created tracking tables, and executing certain stored procedures. If any part of this chain lacks the necessary permissions, the entire sync process could fail.
Solution
The error was ultimately resolved by granting SELECT, INSERT, UPDATE, and DELETE permissions on sync metadata and system-created tracking tables. Moreover, EXECUTE permission was granted on stored procedures created by the service.
Here’s a more detailed breakdown:
SELECT, INSERT, UPDATE, and DELETE Permissions: These CRUD (Create, Read, Update, Delete) permissions ensure that all basic operations can be performed on the relevant tables. Without these, data synchronization is impossible, as the system can’t read from the source, update the destination, or handle discrepancies.
EXECUTE Permission on Stored Procedures: Stored procedures are sets of precompiled queries that might be executed during the sync process. Without permission to execute these procedures, the sync process might be hindered.
Conclusion
Errors like the “SqlException ID” are more than just roadblocks; they’re opportunities for us to delve deep into our systems, understand their intricacies, and make them more robust. By understanding permissions and ensuring that all processes have the access they need, we can create a more seamless and error-free synchronization experience. Always remember to regularly audit permissions, especially after updates or system changes, to prevent such issues in the future
If you need more information how DataSync works at database level, enabling SQL Profiler (using, for, example, the plugin of SQL Profiler in Azure Data Studio) for you could see a lot of internal details.
Enjoy!


Recent Comments