This article is contributed. See the original author and article here.
In today’s fast-paced business environment, leaders must stay ahead of ever-shifting demands while contending with fragmented data, manual reconciliations, and reactive reporting processes. Traditional analytics tools often reside outside core systems, forcing organizations to juggle multiple data sources and spreadsheets. This approach delays timely decisions and makes it nearly impossible to pivot quickly when market conditions change.
Business performance analytics (built into ERP solutions within Microsoft Dynamics 365) tackles these challenges by bringing together financial, operational, and organizational data within a single, governed foundation. Rather than dealing with siloed systems and batch updates, you gain real-time insights that are directly process-aware—eliminating delays, data harmonization overhead, and disconnected reporting. Even more exciting, Dynamics 365 extends analytics beyond dashboards, enabling AI capabilities that can proactively recommend or even execute business actions on your behalf.
Below, we explore how Business performance analytics unifies your data estate, drives smarter decisions through Copilot and agents, and sets you on a path to fully integrated and autonomous business processes.
Bringing data together: A single, context-aware model
Most organizations rely on disparate tools and manual processes to piece together financial statements, operational dashboards, and performance metrics. Unfortunately, these patchwork efforts waste time and often produce errors or duplications. This causes even more challenges as leaders increasingly look to generative AI to automate repetitive tasks and support predictive decision making. AI’s effectiveness depends on the quality and timeliness of the underlying data. For AI Agents to deliver real value, they need to operate on a data estate that is continuously updated, context-aware, and governed.
Business performance analytics unifies data from Microsoft Dynamics 365 Finance, Microsoft Dynamics 365 Supply Chain Management, Microsoft Dynamics 365 Sales, Microsoft Dynamics 365 Customer Insights, Microsoft Dynamics 365 Field Service, Microsoft Dynamics 365 Human Resources, and third-party sources—preserving the context of your processes in a single, dimensional model. This approach delivers an analytics strategy that is:
Process-aware out of the box. Because it’s built into Dynamics 365, Business performance analytics inherently understands cost centers, product categories, HR structures, project operations, and more. This means no manual mapping or external reconciliation is needed to see how a product delay affects supply chain costs or how shifting budgets impact workforce allocations.
Always up to date. Unlike traditional, standalone analytics that require nightly data loads, Business performance analytics refreshes data frequently. Finance, HR, supply chain and operations leaders see critical changes as they happen—giving you the agility to react to rising demand, fluctuations in resource utilization, or unexpected expenses.
Context-rich. Business performance analytics provide dimensional analysis across financial, operational, and organizational data. Need to compare revenue by region or analyze cost variances by project? Simply slice and dice the data without wrestling with manual exports or complicated transformations.
Governed and protected. With role-based security, data encryption, and centralized governance, your teams—and your agents—access only authorized data. This instills confidence that shared insights won’t compromise sensitive information.
By bringing data into a single, governed model, your entire organization can speak the same language. Finance, supply chain, field service, and HR no longer work in silos. Instead, they share a unified foundation that streamlines analytics and AI investments to expedite decision making.
Agents: From insight to autonomous action
Many analytics solutions connect data to provide insight, but few connect directly to your ERP system to suggest or even execute next steps. By harnessing AI capabilities within Dynamics 365, you can move from reactive reporting to proactive, autonomous processes.
Autonomous monitoring and alerts. Agents can be created to continuously watch financial performance, supply chain metrics, and workforce signals. Once an anomaly is detected—like unexpected spending spikes or inventory shortfalls—they can alert the right managers in Microsoft Teams or email.
Proactive decision assistance. Instead of diving into massive spreadsheets, managers receive scenario-based recommendations built on historical and real-time data. Agents might suggest renegotiating a vendor contract or reprioritizing marketing spend to optimize ROI.
Automated execution. Imagine your system adjusting procurement orders based on forecasted demand or automatically recommending reallocation of budgets across cost centers. When data reveals that immediate action is needed, Agents can trigger or schedule tasks in Dynamics 365.
By connecting data from disparate sources and mapping directly into ERP, Business performance analytics provides the “brains” for Agents to continuously optimize operations.
Accelerate analytics with Microsoft Fabric
Business performance analytics works seamlessly with Fabric to provide organizations with a scalable, AI-powered data foundation that extends well beyond traditional ERP analytics solutions. This integration addresses a key challenge for many organizations as they look to reconcile data between ERP systems and external analytics platforms. Fabric removes this friction by unifying data storage, analysis, and governance:
OneLake architecture. Easily combine data from Business performance analytics with additional structured or unstructured data—like Internet of Things (IoT) signals or historical archives. With a consistent governance layer, your analytics remain secure and compliant.
Direct Lake mode. Traditional analytics pipelines rely on batch processing, introducing delays. With Direct Lake, you can query data instantly. Finance teams can analyze transactions that landed minutes ago, while supply chain managers gain immediate insights into inventory fluctuations.
Microsoft Copilot Studio and advanced AI. Fabric extends beyond data storage. Integrate with Copilot Studio to rapidly build AI models that utilize a broader data context. This synergy helps you predict everything from late shipments to demand spikes—well before they become actual bottlenecks.
Ultimately, the Fabric integration with Business performance analytics means you can broaden your analytics scope without leaving the governed environment of Dynamics 365.
Business performance analytics
Unify data across your enterprise, and deliver near real-time insights.
Planning for the future: Integrated business planning and analytics
While Business performance analytics delivers immediate insights, organizations often need more robust forecasting, budgeting, and scenario modeling. By connecting to integrated business planning solutions in Dynamics 365—such as Business performance planning or Supply chain planning—you unite daily insights with forward-looking strategies:
Unified budgets and forecasts. Finance teams can build rolling forecasts that pull live data from operations, so you’re never basing budgets on stale assumptions.
Closing the loop with operations. Demand shifts can be identified by agents to automatically adjust your supply chain forecast, helping to ensure inventory and workforce capacities align.
Streamlined scenarios. Business performance analytics lays the real-time foundation. Planning tools let you run what-if analyses to see how changes in demand, staffing, or market conditions might affect revenue and expenses.
By linking operational reporting and strategic planning under a single data model, you can achieve continuous planning—a major shift from the static, siloed budgeting processes of the past. Below provides an overview of planning and analytics within the ERP solutions of Dynamics 365 and how they work alongside Business performance analytics:
Capability
Purpose
When to use It
Get started today
Business performance analytics
Gain actionable insights into financial and operational performance.
Use when analyzing financial statements, cash flow trends, budget versus actual performance, or identifying cost variances.
Enable Business performance analytics to access prebuilt dashboards and reports, giving you near real-time visibility into results.
Business performance planning
Align financial forecasting, operational planning, and workforce planning (licensed with Finance Premium).
Use when creating financial forecasts, setting budget allocations, scenario modeling, or aligning operational plans.
Activate Business performance planning capabilities to start integrating forecasts, budgets, and workforce planning into daily execution.
Supply chain planning
Optimize demand forecasting and inventory management (licensed with Supply Chain Premium).
Use when predicting demand, managing supplier lead times, mitigating risks, and balancing inventory levels with sales forecasts.
Deploy Supply chain planning with demand planning to enhance visibility, align production schedules, and streamline operations.
With this approach to integrated business planning, leadership can align corporate strategy, budgeting, demand forecasting, and production capacity without juggling multiple data sets or tools. This comprehensive approach helps to ensure every team—from finance and supply chain to sales and human resources—draws on a consistent, reliable data foundation for strategic decisions and execution.
Tailored for every industry
Whether your organization is in manufacturing, retail, healthcare, or professional services, Business performance analytics adapts to your unique processes:
Product-centric companies. Manage production schedules, inventory levels, and logistics based on real-time demand signals, eliminating overstock or missed sales.
Service-centric organizations. Track resource utilization, billable hours, and project profitability in one model, reducing the risk of revenue leakage or unbilled work.
Asset-intensive sectors. Optimize maintenance schedules and capital investments by forecasting the impact on operating budgets and asset lifecycles.
Because Business performance analytics is built into Dynamics 365, you can seamlessly extend it for industry-specific scenarios—without the heavy lifting of third-party integrations.
A future-ready approach: From static reporting to autonomous execution
Typical analytics solutions stop at reports and dashboards. Business performance analytics in Dynamics 365 goes further by providing an end-to-end continuum: from real-time insights, to AI recommendations, to automated actions. As we look toward the future, we aim to ensure:
Integrated data, not data dumps. No external data lakes or manual extracts will be required. Your data stays within a governed, process-aware model.
Seamless AI. Agents will be able to shift your organization away from after-the-fact reporting to proactive decision making, drastically cutting response times.
Governed, scalable architecture. You can tie to Fabric for more extensive analytics, advanced AI, and the flexibility to handle multiple data sources at once.
In a rapidly evolving market, the ability to act swiftly is critical. Business performance analytics helps ensure you have the right data at the right time, with embedded intelligence and the option for autonomous execution—helping you adapt, innovate, and grow, no matter the challenges ahead.
Ready to empower your teams with better business visibility?
Eliminate silos. Unify visibility across your business with process-aware analytics, like record to report, procure to pay, order to cash, and hire to retire in a single, governed framework.
Accelerate decisions. Combine near real-time data and agents to detect anomalies and recommend the next best action—before issues escalate.
Scale securely. Expand seamlessly via Fabric, helping to ensure your analytics remain fast, governed, and AI-ready, no matter how large your data grows.
By adopting Business performance analytics within Dynamics 365, you lay the groundwork for an agile, insight-driven organization—one that doesn’t just track performance but actively shapes it.
Learn more about business performance analytics, contact us today.
This article is contributed. See the original author and article here.
Dynamics 365 Contact Center provides out-of-the-box analytics that monitor key operations metrics in a contact center. Customers can leverage data model customization and extend these analytics to fit their organizational needs. When customizing real-time analytics, there is a potential that the reports are slow and don’t meet the performance goals your organization expects. One way to improve the performance and latency of real-time analytics is to update the connection limits.
The importance of connection limits
At its core, Power BI’s connection limit determines how many simultaneous connections you can make to a data source. By default, this limit is 10, which suffices for simpler or smaller datasets. However, for more intricate and voluminous datasets, this constraint becomes a bottleneck, hindering the performance and responsiveness of reports.
Why should you increase the limit to more than 300 connections?
Increasing the maximum connections beyond 300 provides several notable advantages:
Enhanced Performance: More connections enable faster data retrieval and processing, leading to quicker report generation and smoother interactions.
Scalability: As your datasets and usage grow, the ability to handle more connections ensures that performance remains robust and scalable.
Optimized Custom Reports: Customized reports often involve complex queries and calculations. More connections allow these operations to be executed more efficiently, improving the overall user experience.
Situations that require customized reports can vary greatly. One reason you might want to create a highly customized report is to show detailed information about the performance of product-based brands in a retail organization. Out-of-the-box reports can show overall conversation metrics across channels in a contact center. But with custom reports, admins can create individual reports about each brand according to the organization’s taxonomy. When managers want to review these reports regularly, it’s important to be able to optimize the speed of report generation, especially as the number of products grows and the goals of the organization change.
How to update the connection limit
Updating the maximum connections in Power BI is a straightforward process. Here’s how to update the published data model in Power BI.
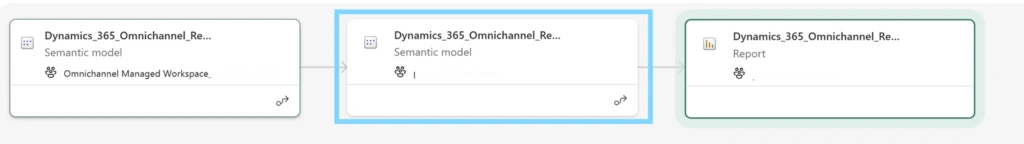
Download the Dynamics_365_Omnichannel_Realtime_analytics schematic model from the Power BI portal.
Open the schematic model using Power BI desktop.
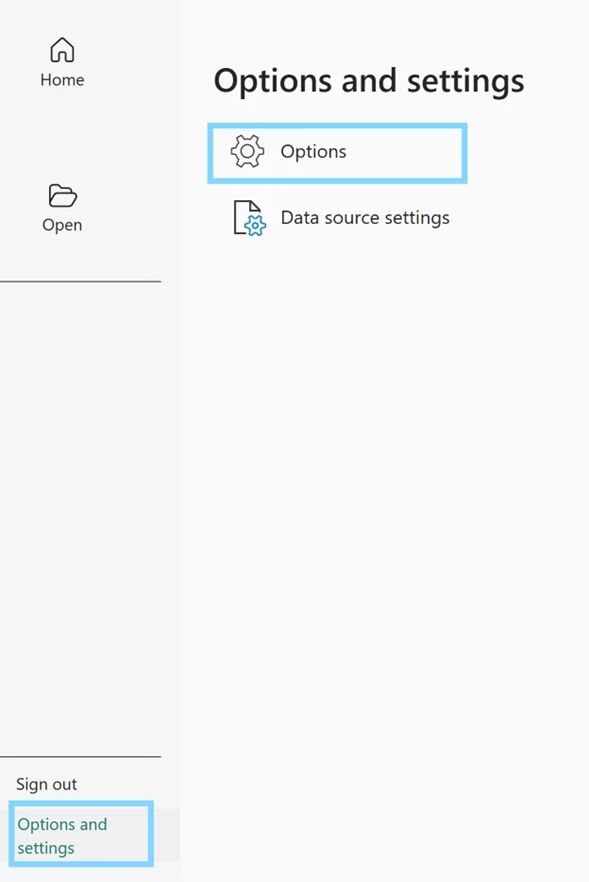
Click Options and settings and then Options.
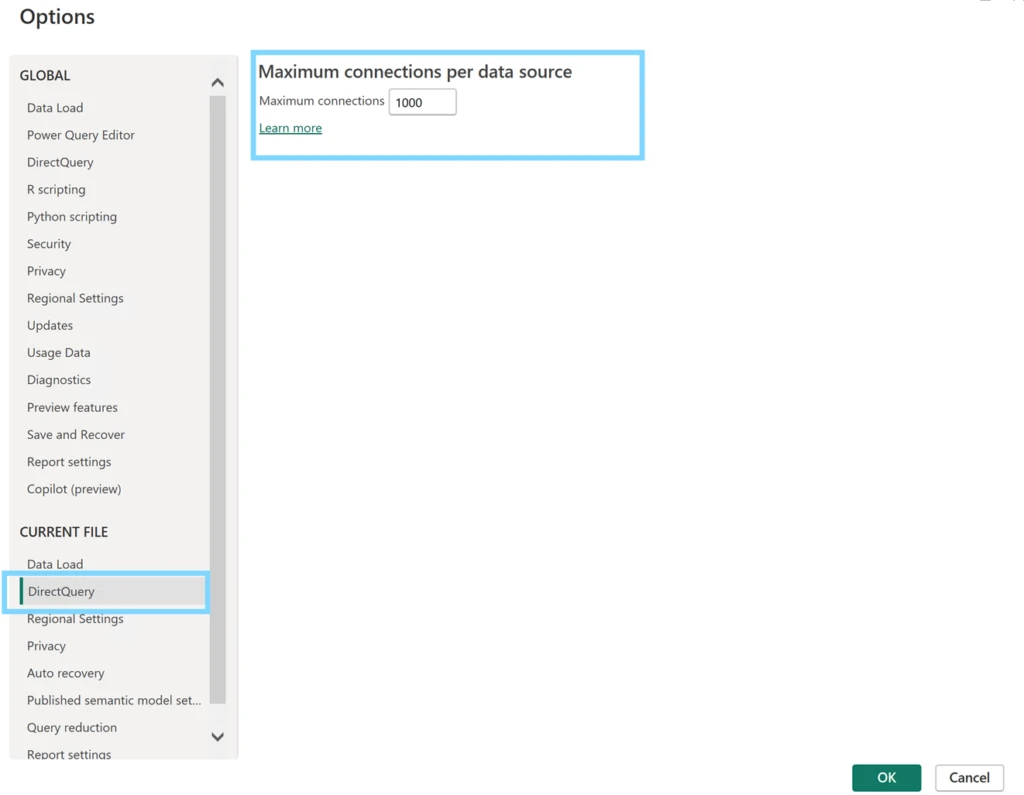
Under DirectQuery, change the Maximum connections field to a number greater than 300.
Click OK.
Save and publish the schematic data model to the same workspace where you downloaded the model.
You will receive a warning that this will be applied to all the reports/dashboard that is referencing this schematic data model. You can accept it and proceed to publish it to the workspace.
Updating the maximum connections in Power BI from 10 to 300 or more is a strategic move that can markedly improve the performance of your customized reports.
This article is contributed. See the original author and article here.
We are excited to announce the Copilot Studio-powered customer feedback survey in Dynamics 365 Contact Center, now in preview. Now, contact center managers can use Copilot Studio Survey in the Contact Center admin center to dynamically respond to customer feedback.
Traditionally, management can take a long time to act on the feedback that customers provide. Additionally, managers may have to use various tools to capture customer feedback across different channels. In the era of AI, we can reimagine customer feedback management in Dynamics to enable real-time, automated, and personalized feedback loops, helping our customers unlock immense business value.
With this feature, contact center managers can use the generative AI capabilities of Copilot Studio bots to streamline the survey configuration process across channels. Supervisors get a holistic view of the feedback, all while maintaining flexibility and customization.
Choose your customer feedback survey
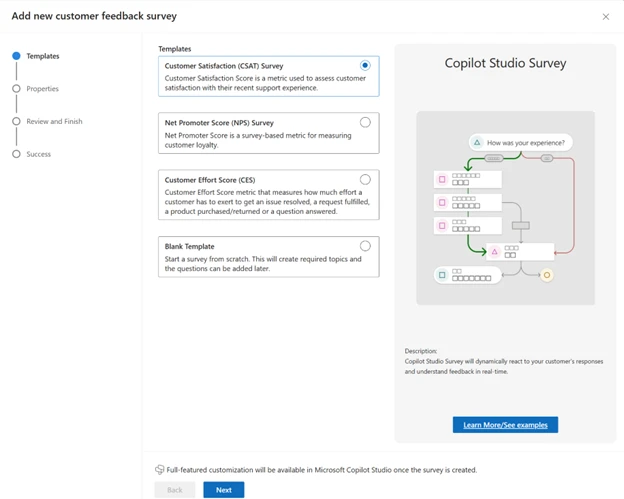
Starting in Dynamics, you can quickly author survey bots using either a blank template or one of three standard survey metrics:
Customer Satisfaction Score
Net Promoter Score
Customer Effort Score.
After creating the survey bot, you can open it in Copilot Studio for bot authoring and customization. Add additional questions, use Power Automate to trigger workflows based on customer responses, and design your bot to meet your business needs. Best of all, once your bot is published, you can use it across voice, live chat, and social channels. The result is a unified, centralized survey configuration process.
Copilot-powered customer feedback in action
For a real-world example, let’s use Contoso Bank, which places a high value on customer feedback. The Net Promoter Score (NPS) metric is of particular interest, as it helps them measure customer loyalty. To leverage this, they use the new Copilot-powered customer feedback survey feature to quickly create an NPS survey bot from the Dynamics 365 Contact Center admin center and deploy it across all their channels. In Copilot Studio, they customize the bot to trigger a Power Automate flow to create a follow-up case if the score is less than 5. This bot engages with customers at the end of the call or conversation and gathers their feedback. If the NPS score is less than 5, it triggers Power Automate to create a follow-up case. This ensures they promptly attend to any unhappy customers, thereby quickly improving overall customer satisfaction and loyalty for Contoso Bank.
In today’s world, where customer feedback is crucial, this feature is a game-changer. Businesses can quickly gather and act on feedback, ensuring they stay responsive and attuned to customer needs. The result is customer satisfaction and loyalty.
Learn more
To learn more about enabling and using the Copilot-powered survey, read the documentation.


Recent Comments