This article is contributed. See the original author and article here.
3 Easy steps to perform Logging in Asp.net core after its published to production servers.
There are times when we face challenges to debug the applications which is already in production and we need to know what is happening for that piece of code and so on.
There can be any number of issues ranging from “startup” to “page throwing errors after deploying to IIS server” etc.
In Visual studio we get the detailed information in output window, when we build or run the application and there are certain providers which we can enable to see logging in much detailed but once it’s published to IIS we are left out with very less options that we can see.
Sample output window from VS for simple hello world !

In this blog, we will discuss how we can generate ideal view of what we see locally in Visual studio output window and get similar output in the form of logs on the server, especially for asp.net core applications which are already published to production servers. Also we will see how we can include additional providers to generate logs for Asp.netcore applications.
Three easy steps!
Step 1:
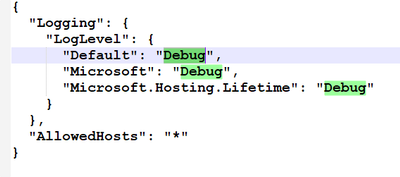
Once we publish the application to IIS server, go to Web.config and make stdoutLogEnabled to True as shown below and save and close the file. Then go to Appsettings.json file and edit the Log Level section to get a log file generated within the same folder. Ensure your application pool’s identity has write permissions to application folder where we have the web.config.
(There are other Providers we can use in place of Debug as well please see the references for more information)
Web.config:
Step 2:
Once we change the values of above elements to Debug with a capital ‘D’ as case sensitive then restart the application pool to take effect. This not mandatory step to do but just to get more information.
AppSettings.json:
Step 3:
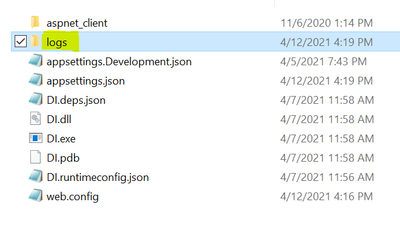
Browse the application and you should see the log file got generated which gives debug level information which is very useful to identify or troubleshoot any issues in production.

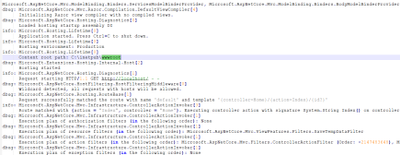
Sample from the log got generated:
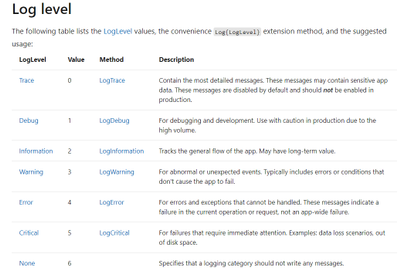
There are different log levels that you can use.
How to log the same information using Perfview/Dotnet Trace or any other ETW based data capturing tools?
For logging the same information we saw in the stdout log using Perfview/dotnet-trace, we need to make sure that “Event Source” logging provider is enabled.
This can be done by using the Generic host and then call CreateDefaultBuilder in Program.cs, which adds the following logging providers:
- Console
- Debug
- EventSource
- EventLog: Windows only
Just like below:

Sometimes, we override the default set of logging added by Host.CreateDefaultBuilder by calling ClearProviders() in “ConfigureLogging” method to add additional logging providers like Azure Application Insights etc. In that case, if we want to collect ETW based traces, then its necessary to add “logging.AddEventSourceLogger()” like below:
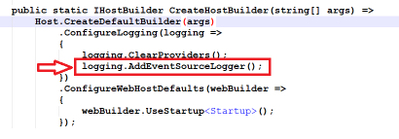
Next step is to add “Logging” in AppSettings.json and defining log levels. If we want debug level logs only for Event Source logging provider, we should add highlighted section as well:
{
“Logging”: {
“LogLevel”: {
“Default”: “Information”,
“Microsoft”: “Warning”,
“Microsoft.Hosting.Lifetime”: “Information”
},
“EventSource”: {
“LogLevel”: {
“Default”: “Debug”,
“Microsoft”: “Debug”,
“Microsoft.Hosting.Lifetime”: “Debug”
}
}
},
“AllowedHosts”: “*”
}
Once we make the above changes and capture Perfview/Dotnet-trace, the events would look like below when we analyze them:
LoggerName | Level | EventName |
Microsoft.Extensions.Hosting.Internal.Host | 1 | Hosting starting |
Microsoft.AspNetCore.Hosting.Diagnostics | 1 | Loaded hosting startup assembly ASPNETCORETEST |
Microsoft.Hosting.Lifetime | 2 | Application started. Press Ctrl+C to shut down. |
Microsoft.Hosting.Lifetime | 2 | Hosting environment: Development |
Microsoft.Hosting.Lifetime | 2 | Content root path: C:UserssudixisourcereposASPNETCORETESTASPNETCORETEST |
Microsoft.Extensions.Hosting.Internal.Host | 1 | Hosting started |
Microsoft.AspNetCore.Hosting.Diagnostics |
|
|
Microsoft.AspNetCore.Hosting.Diagnostics | 2 | Request starting HTTP/2.0 GET https://localhost:44338/ |
Microsoft.AspNetCore.HostFiltering.HostFilteringMiddleware | 1 | WildcardDetected |
Microsoft.AspNetCore.Routing.Matching.DfaMatcher | 1 | CandidatesFound |
Microsoft.AspNetCore.Routing.EndpointRoutingMiddleware | 1 | MatchSuccess |
Microsoft.AspNetCore.Routing.EndpointMiddleware | 2 | ExecutingEndpoint |
Microsoft.AspNetCore.Routing.EndpointMiddleware | 2 | ExecutedEndpoint |
Microsoft.AspNetCore.Hosting.Diagnostics | 2 | Request finished in 113.6961ms 200 |
Microsoft.AspNetCore.Hosting.Diagnostics |
|
|
Microsoft.AspNetCore.Hosting.Diagnostics |
|
|
Microsoft.AspNetCore.Hosting.Diagnostics | 2 | Request starting HTTP/2.0 GET https://localhost:44338/favicon.ico |
Microsoft.AspNetCore.Routing.Matching.DfaMatcher | 1 | CandidatesNotFound |
Microsoft.AspNetCore.Routing.EndpointRoutingMiddleware | 1 | MatchFailure |
Microsoft.AspNetCore.Hosting.Diagnostics | 2 | Request finished in 6.7227ms 404 |
Microsoft.AspNetCore.Hosting.Diagnostics |
|
|
When collecting Perfview, we should make sure to provider add the string *Microsoft-Extensions-Logging in the additional [Please do not miss * at the beginning] for Perfview to collect events emitted by Event Source Logging provider:
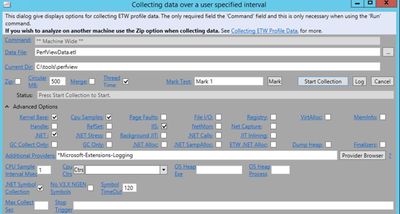
Using dotnet-trace, we can collect the Event Source emitted events by running below commands:
Sample commands to get started:
Capture basic CPU samples with .NET and ASP.NET Core events:
dotnet-trace collect –profile cpu-sampling –providers Microsoft-Extensions-Logging:4:5 -p ###
Capture basic CPU samples with .NET, ANC & Kestrel, Sys.Net.Http, and TPL Task events:
dotnet-trace collect –profile cpu-sampling –providers Microsoft-Extensions-Logging:4:5,Microsoft-AspNetCore-Server-Kestrel,Microsoft-System-Net-Http,System-Threading-Tasks-TplEventSource::5 -p ###
For additional references: Logging in .NET Core and ASP.NET Core | Microsoft Docs
Hope this helps!
Brought to you by Dr. Ware, Microsoft Office 365 Silver Partner, Charleston SC.


Recent Comments