This article is contributed. See the original author and article here.
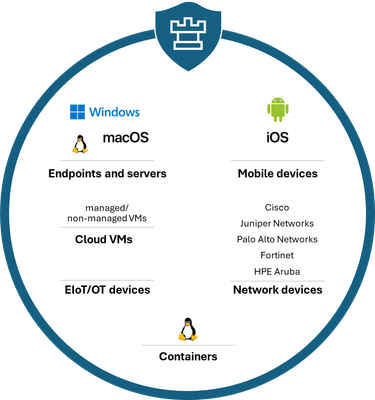
Microsoft has established itself as a leading solution for vulnerability risk management (VRM) by leveraging its industry-leading threat intelligence and security expertise. Microsoft Defender Vulnerability Management covers the end-to-end VRM lifecycle to identify, assess, prioritize, and remediate vulnerabilities across platforms and workloads. Making it an ideal tool for an expanded attack surface taking advantage of our context-aware, risk-based prioritization breach likelihood predictions and business contexts to prioritize vulnerabilities across their portfolio of managed and unmanaged devices.
Figure: Platform and workload coverage in Defender Vulnerability Management
We are excited to announce that on 1 April, 2024 all Microsoft Defender Vulnerability Management capabilities are available to government cloud customers.
Organizations across commercial, education and government environments can now get the complete set of capabilities for their environment. Defender Vulnerability Management has both core and premium capabilities where the core capabilities are included as part of Defender for Endpoint P2 and premium capabilities available as an add-on. For organizations that are not yet on Defender for Endpoint Plan 2 we also provide a standalone offer that includes both core and premium. Organizations looking for server protection for their hybrid cloud environment the vulnerability management core capabilities are available in Defender for Servers plan 1 and premium capabilities in Defender for Servers plan 2.
Figure: Availability of core and premium capabilities across offerings that include Defender Vulnerability Management for endpoints and servers.
More information about the Defender Vulnerability Management premium capabilities now available in GCC, GCC-High and DOD in these blogs:
This article is contributed. See the original author and article here.
Getting customer signoff on a completed Work Order is a key job to be done for any service technician. Earlier this year, Dynamics 365 Field Service released a new and improved signature control to capture customer signatures on mobile devices. It supports drawing a signature on the screen as well as typing a name in lieu of a drawn signature. This enhancement was a key customer request, and also helps the scenario to be more accessible for our users.
How it works
Technicians in the field can open the form that has been configured to capture the customer signature on the Field Service mobile app and hand over the device to the customer.
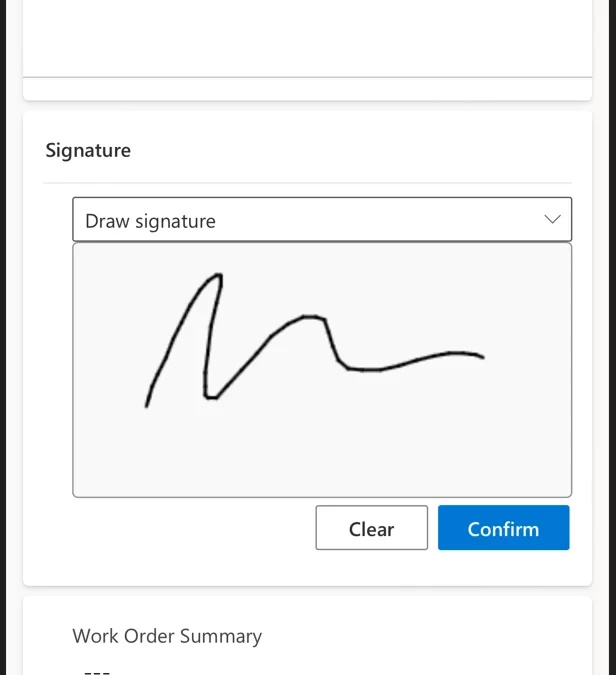
Drawing the signature on the screen
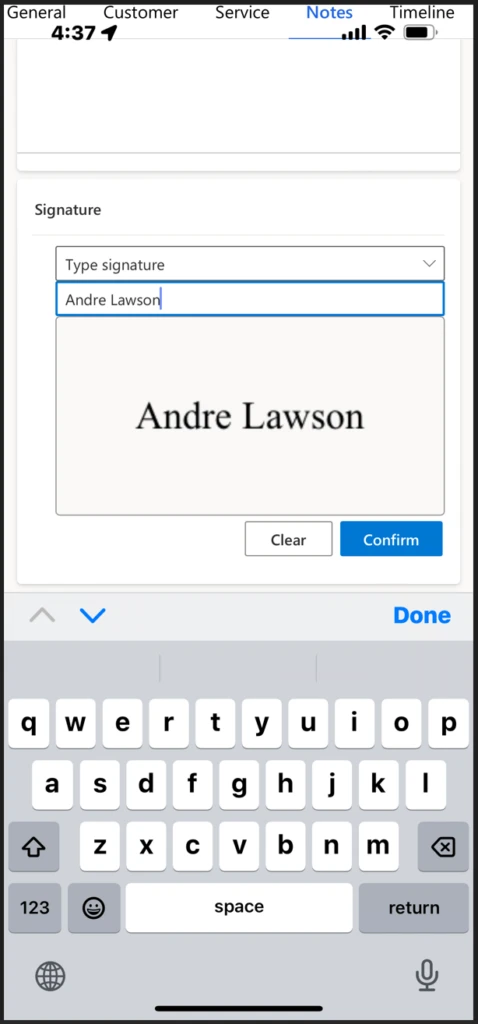
Technicians will then be able to choose how they want to enter the signature, either drawing it on the screen with their finger or stylus pen, or by typing it on the keyboard.
Typing the signature using keyboard
How to configure a form to add the control
If you use default forms provided by Microsoft, the existing signature controls have already been updated, and there’s no action needed to configure it.
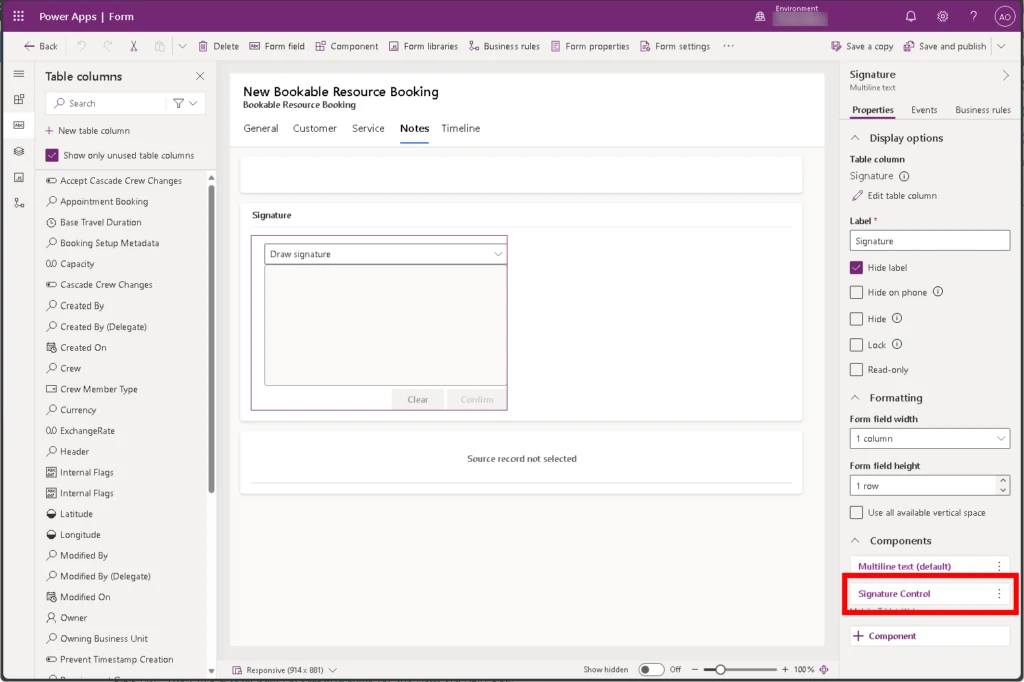
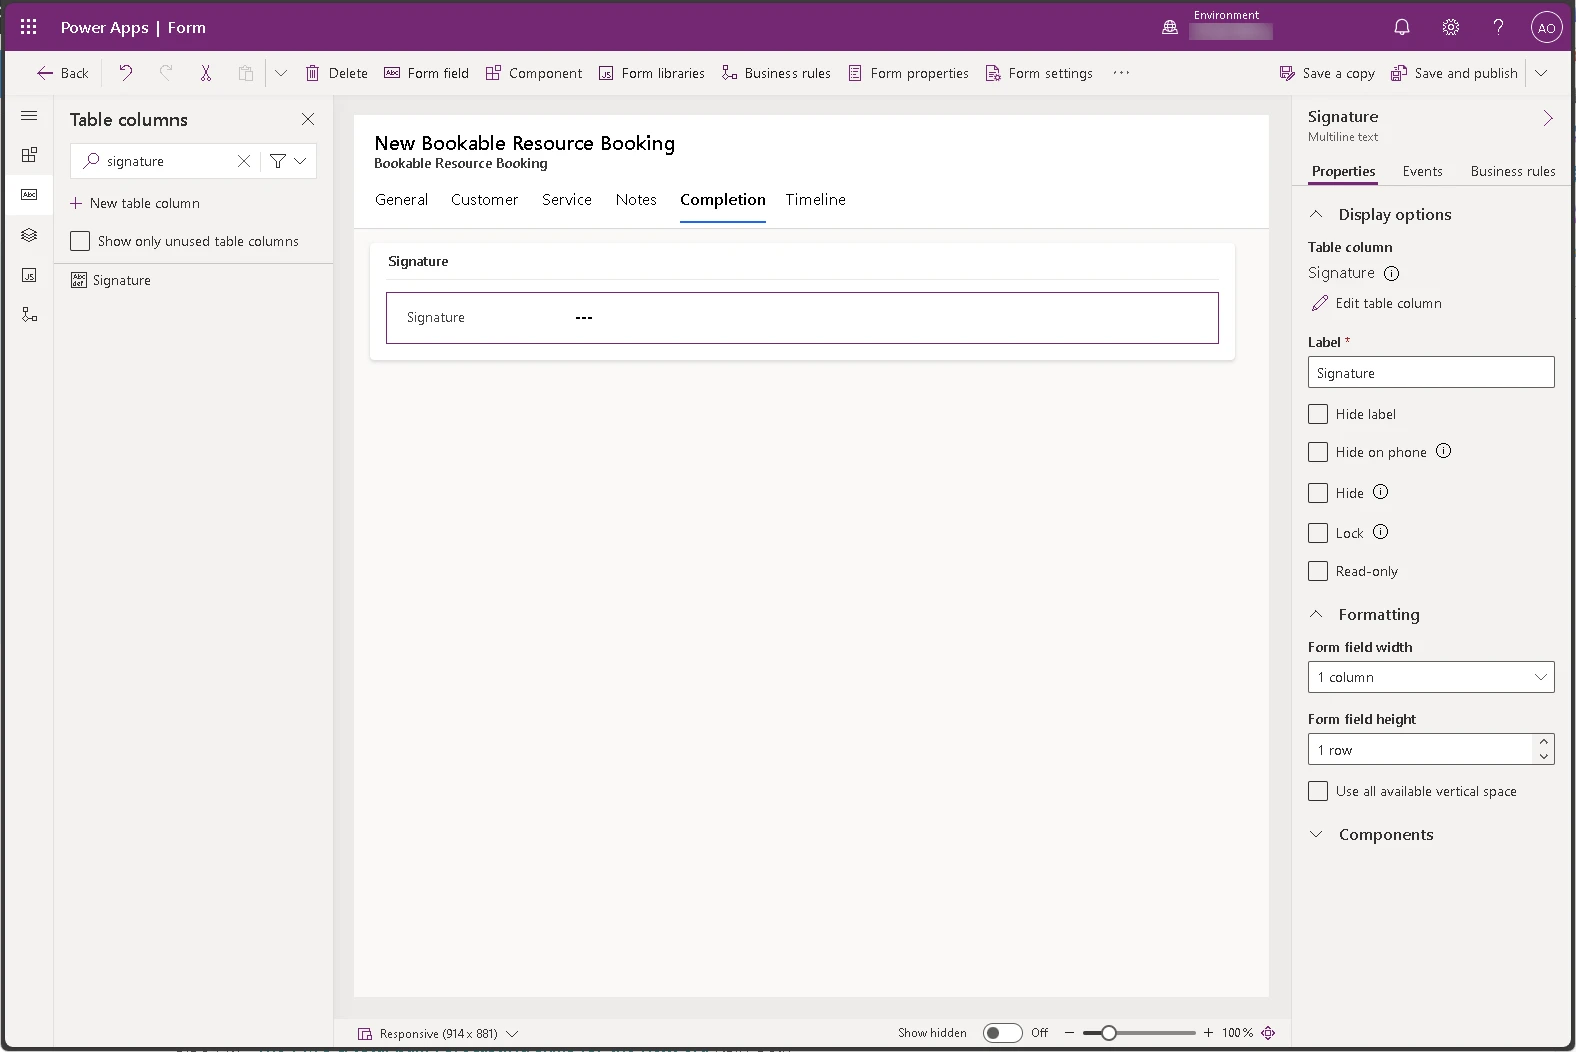
For example, the Booking and Work Order Form in the Bookable Resource Booking entity, contains the Signature field in the Notes tab. By opening this form in Power Apps, you find the associated component Signature Control
Add the signature control to a custom form
Follow these steps to add the new control to a custom form.
Edit a custom form and add the Signature field (or your custom Multiline text field where you store the customer signature) on your form. Optionally, hide the label, so the control can use all the available space on screen.
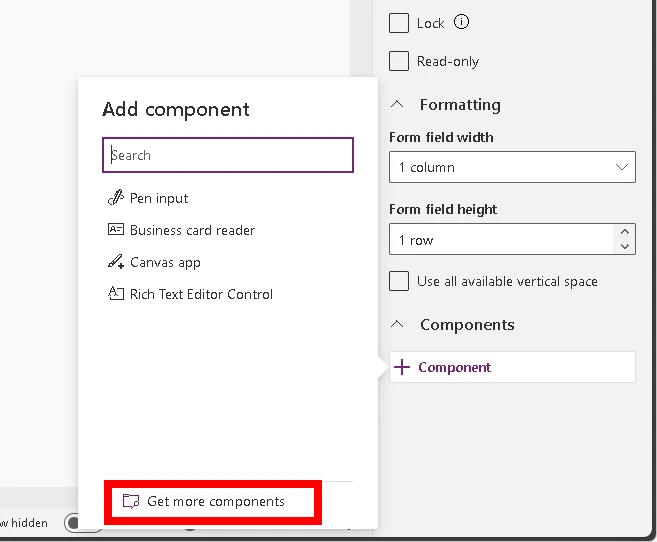
Expand the Components section at the bottom of the field detail pane and add the Signature Control component.
If the Signature Control is not in the list, select Get more components.
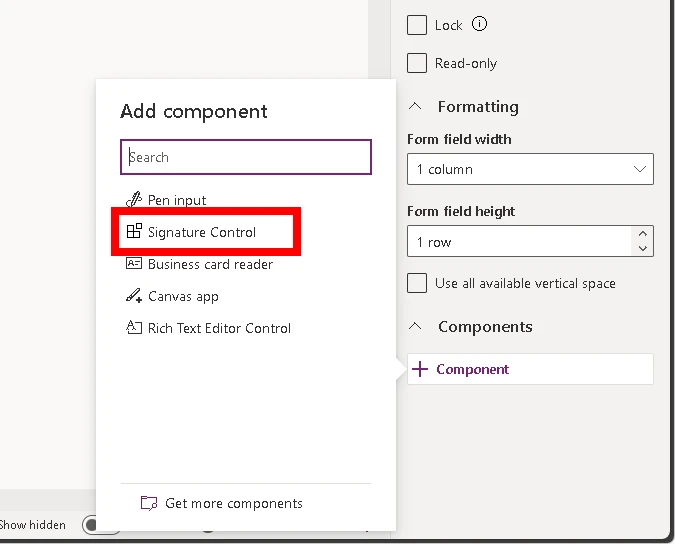
Note: The new Signature Control replaces the Pen input control.
Select the Signature Control in the list of controls to add it.
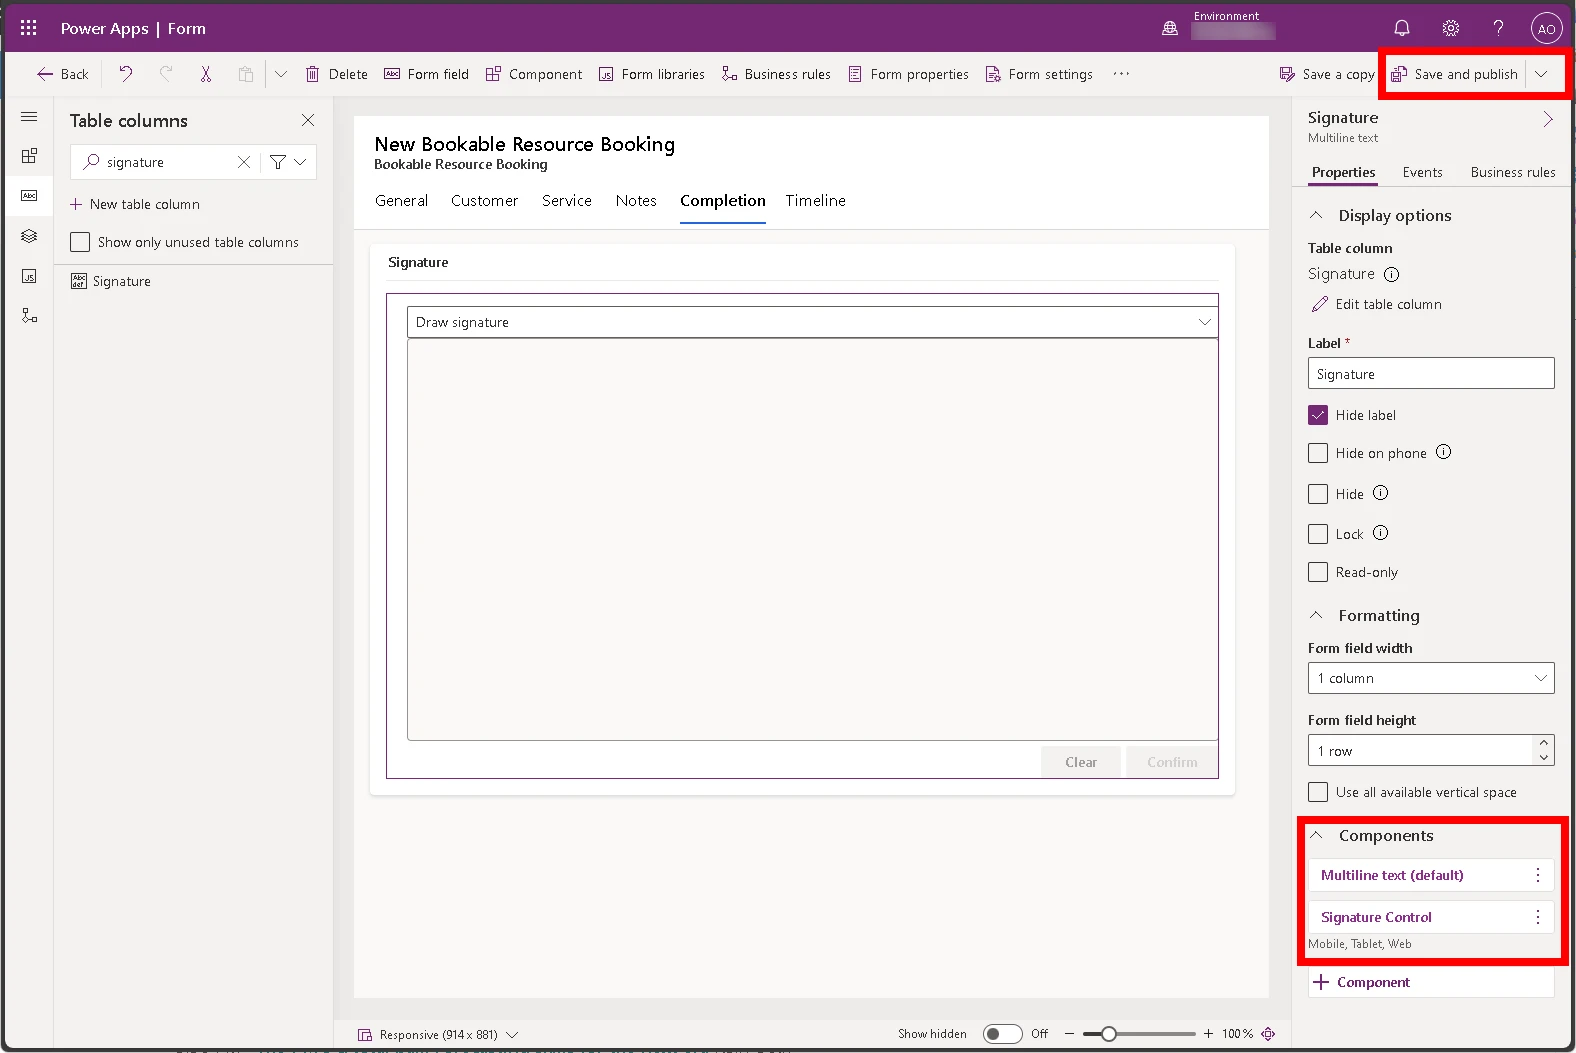
Save and Publish your form to make it available to your technicians.
We hope that these new enhancements in Field Service mobile will make your work even more productive. We would love to hear your feedback and suggestions on how to improve the product. Please feel free to leave comments in the Dynamics 365 Community Forum or suggest features in the Ideas portal.
This article is contributed. See the original author and article here.
Effective cost management in Azure Monitor and Azure Log Analytics is essential for controlling cloud expenditures. It involves strategic measures to reduce costs while maximizing the value derived from ingested, processed, and retained data. In Azure, achieving this balance entails adopting efficient data ingestion methods, smart retention policies, and judicious use of table transformations with Kusto Query Language (KQL).
Understanding the impact of data management practices on costs is crucial since each byte of data ingested and stored in Azure Log Analytics incurs expenses. Table transformations—such as filtering, projecting, aggregating, sorting, joining, and dropping data—are a great way to reduce storage and ingestion costs. They allow you to filter or modify data before it’s sent to a Log Analytics workspace. Reducing ingestion cost and also reducing long-term storage.
This document will explore four key areas to uncover strategies for optimizing the Azure Monitor and Azure Log Analytics environment, ensuring cost-effectiveness while maintaining high performance and data integrity. Our guide will provide comprehensive insights for managing cloud expenses within Azure services.
Key Areas of Focus:
Ingestion Cost Considerations: The volume of data ingested primarily influences costs. Implementing filters at the source is crucial to capture only the most relevant data.
Data Retention Strategies: Effective retention policies are vital for cost control. Azure Log Analytics allows automatic purging of data past certain thresholds, preventing unnecessary storage expenses.
Optimization through Transformations: Refining the dataset through table transformations can focus efforts on valuable data and reduce long-term storage needs. Note that these transformations won’t reduce costs within the minimum data retention period.
Cost Management Practices: Leveraging Azure Cost Management and Billing tools is crucial for gaining insight into usage patterns. These insights inform strategic adjustments, aligning costs with budgetary limits.
1) Ingestion Cost Considerations:
Efficient data ingestion within Azure Monitor and Log Analytics is a balancing act between capturing comprehensive insights and managing costs. This section delves into effective data ingestion strategies for Azure’s IaaS environments, highlighting the prudent use of Data Collection Rules (DCRs) to maintain data insight quality while addressing cost implications.
Data ingestion costs in Azure Log Analytics are incurred at the point of collection, with volume directly affecting expenses. It’s imperative to establish a first line of defense against high costs at this stage. Sampling at the source is critical, ensuring that applications and resources only transmit necessary data. This preliminary filtering sets the stage for cost-effective data management. Within Azure’s environment, DCRs become a pivotal mechanism where this essential data sampling commences. They streamline the collection process by specifying what data is collected and how. However, it’s important to recognize that while DCRs are comprehensive, they may not encompass all types of data or sources. For more nuanced or complex requirements, additional configuration or tools may be necessary beyond the standard scope of DCRs.
In addition:
Navigating Azure Monitor Ingestion in IaaS:
Azure Virtual Machines (VMs) provide a spectrum of logging options, which bear on both the depth of operational insights and the consequent costs. The strategic use of DCRs, in concert with tools like Log Diagnostic settings and Insights, is essential for proficient monitoring and management of VMs.”
A) Log Diagnostic Settings:
When enabling Log Diagnostic Settings in Azure, you are presented with the option to select a Data Collection Rule, although you are not given an option to modify the collection rule, you can access the DCR settings by navigating to the Azure Monitor Service Section. DCRs help tailor what logs and metrics are collected. They support routing diagnostics to Azure Monitor Logs, Storage, or Event Hubs and are valuable for detailed data needs like VM boot logs or performance counters.
To minimize costs with DCRs:
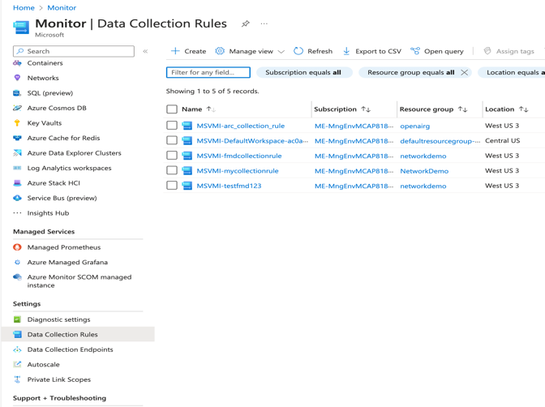
Filter at Source: DCRs can enforce filters to send only pertinent data to the workspace, to modify the filters, Navigate to the Azure Portal, select Azure Monitor, under Settings select Data Collection Rules, select the collection rule you are trying to modify and click on Data Sources, here you can modify what is collected. Some Items such as Microsoft-Perf allows you to add a transformation at this level.
Efficient Collection: DCRs can reduce collection frequency or focus on key metrics, which may require additional insights for complex data patterns. In the Azure portal under the collection rule, select the data source, such as Performance Counters, and here you can adjust the sample rate (frequency) of data collection such as CPU sample rate 60 seconds, adjust the counters based on your need.
Regular Reviews: While DCRs automate some collection practices, manual oversight is still needed to identify and address high-volume sources.
B) Insights (Azure Monitor for VMs):
Purpose: Azure VM Insights is an extension of Azure Monitor designed to deliver a thorough monitoring solution, furnishing detailed performance metrics, visual dependency maps, and vital health statistics for your virtual machines.
Details: Leveraging the Log Analytics agent, Azure VM Insights captures and synthesizes data from your VMs, offering a cohesive dashboard that showcases CPU, memory, disk, and network performance, alongside process details and inter-service dependencies.
Use Cases: Azure VM Insights is pivotal for advanced performance monitoring and diagnostics. It enables the early detection of performance issues, aids in discerning system alterations, and proactively alerts you to potential disruptions before they manifest significantly.
To Enable VM Insights, select the Data Collection Rule which defines the Log analytics workspace to be used.
Cost-saving measures include:
Selective Collection: DCRs ensure only essential metrics are collected, yet understanding which metrics are essential can require nuanced analysis.
Metric Collection Frequency: Adjusting the frequency via DCRs can mitigate overload, but determining optimal intervals may require manual analysis.
Use Automation and Azure policy for Configuration: The cornerstone of scalable and cost-effective monitoring is the implementation of standardized configurations across all your virtual machine (VM) assets. Automation plays a pivotal role in this process, ensuring that monitoring configurations are consistent, error-free, and aligned with organizational policies and compliance requirements.
Azure Policy for Monitoring Consistency: Azure Policy is a service in Azure that you can use to create, assign, and manage policies. These policies enforce different rules over your resources, so those resources stay compliant with your corporate standards and service level agreements. Azure Policy can ensure that all VMs in your subscription have the required monitoring agents installed and configured correctly.
You can define policies that audit or even deploy particular settings like log retention periods and specific diagnostic settings, ensuring compliance and aiding in cost control. For example, a policy could be set to automatically deploy Log Analytics agents to any new VM that is created within a subscription. Another policy might require that certain performance metrics are collected and could audit VMs to ensure that collection is happening as expected. If a VM is found not to be in compliance, Azure Policy can trigger a remediation task that brings the VM into compliance by automatically configuring the correct settings.
C) Logs (Azure Monitor Logs):
Purpose: Azure Monitor Logs are pivotal for storing and analyzing log data in the Log Analytics workspace, leveraging Kusto Query Language (KQL) for complex queries.
Cost Control in Detail: While Azure Monitor Logs are adept at aggregating data from diverse sources, including VMs and application logs, effective cost management is essential. DCRs control the collection of logs for storage and analysis in Log Analytics same collection rules apply.
Azure Monitor Basic Logs: Azure monitor logs offers two log plans that let you reduce log ingestion and retention costs and take advantage of Azure Monitor’s advanced features and analytic capabilities based on your needs. The default value of the tables in an Azure Log Analytics Workspace is “Analytics” this plan provides full analysis capabilities and makes log data available for queries, it provides features such as alerts, and use by other services. The plan “Basic” lets you save on the cost of ingesting and storing high-volume verbose logs in your Log Analytics workspace for debugging, troubleshooting, and auditing, but not for analytics and alerts. The retention period is fixed at 8 days.
– From the Log Analytics workspace menu select Tables
– Select the context menu for the table you want to configure and select “manage table”
– From the table plan dropdown on the table configuration screen, select “Basic” or Analytics.
– Not all tables support the Basic plan for a list of tables please visit the documentation listed at the end of this document.
– Select Save.
2) Data Retention Strategies:
Effective retention policies play a vital role in cost control. Azure Log Analytics enables the automatic purging of data past certain retention thresholds, avoiding unnecessary storage expenses for data that is no longer needed. Azure Monitor Logs retain data in two states: interactive retention, which lets you retain Analytics logs for interactive queries of up to 2 years, and Archive, which lets you keep older, less used data in your workspace at a reduced cost. You can access data in the archived state by using search jobs and restore you can keep data in archive state for up to 12 years.
Purpose: Implementing well-defined data retention policies is essential to balance the accessibility of historical data with cost management in Azure Log Analytics. The purpose is to retain only the data that adds value to your organization while minimizing storage and associated costs.
Automated Purging: Azure Log Analytics facilitates cost control through automated data purging. Set retention policies to automatically delete data that exceeds your specified retention threshold, ensuring you’re not paying for storage you don’t need.
Retention Policy Design:
Assessment of Data Value: Regularly evaluate the importance of different data types and their relevance over time to determine the appropriate retention periods.
Compliance Considerations: Ensure that retention periods comply with regulatory requirements and organizational data governance policies.
Cost Reduction Techniques:
Reduction in Retention Period: By retaining only necessary data, you reduce the volume of data stored, leading to direct cost savings on storage resources. Some techniques include data purging, data deduplication, data archiving and life-cycle management policies.
Setting the Global Retention Period: Navigate to the Azure portal and select the Log Analytics Workspace. In the Settings, locate Usage and Estimated Costs, select Data Retention and specify the retention period. This will set the retention period globally for all tables in a Log Analytics workspace.
Setting Per Table Retention period:
you can also specify retention periods for each individual table in the Log Analytics Workspace. In the Azure portal navigate and select the Log Analytics Workspace. In the Settings, select Tables, at the end of each table select the three dots and select manage table, here you can change the retention settings for the table. If needed, you can reduce the interactive retention period to as little as four days using the API or CLI.
Interactive and Archive Retention Period:
lets you retain Analytic logs for interactive queries of up to 2 years. From the Log Analytics workspaces menu in the Azure portal, select your workspaces menu, select Tables. Select the context menu for the table you want to configure and select Manage Table. Configure the interactive retention period. i.e. 30 days Configure the Total Retention Period the difference between the interactive period and the total period is the Archive Period. This difference will show up under the configuration menu. Blue for interactive and orange for Archive period.
Automatic Purging data: If you set the data retention period to 30 days, you can purge older data immediately by using the immediatePurgeDataOn30Days parameter in the Azure Resource Manager. Workspaces with a 30-day retention might keep data for 31 days if this parameter is not set.
Data Deduplication: Azure log analytics workspaces does not offer built-in data de-duplication features, however you can implement data duplication as part of the ingestion process before sending the data to Azure Log Analytics using an Azure function or a logic app.
Move older data to Azure Blob using Data export: Data Export in a log analytics workspace lets you continuously export data per selected tables in your workspace. The data can be exported to a storage account or Azure event hubs. Once the data is in a storage account the data can use life-cycle policies. Another benefit of exporting data is that smaller data sets result in quicker query execution times and potentially lower compute costs
3) Optimization Through Transformations:
The primary purpose of data transformations within Azure Log Analytics is to enhance the efficiency of data handling, by honing in on the essential information, thus refining the datasets for better utility. During this process, which occurs within Azure Monitor’s ingestion pipeline, data undergoes transformations after the source delivers it but before it reaches its final destination (LAW). This key step not only serves to reduce data ingestion costs by eliminating extraneous rows and columns but also ensures adherence to privacy standards through the anonymization of sensitive information. By adding layers of context and optimizing for relevance, the transformations offer enriched data quality while simultaneously allowing for granular access control and streamlined cost management.
There are two ways to do transformations, one at the Data Collection Rule level, which means you select only the items you need such as the Windows performance counters from a VM running the Windows OS in Azure, the second option is to do a transformation at the Table-Level in the Azure Log Analytics Workspace (LAW).
Transformation Process:
Data Selection: Transformations are defined in a data collection rule (DCR) and use a Kusto Query Language (KQL) statement that’s applied individually to each entry in the incoming data and create output in the structure expected by the destination.
Table Transformations: Utilize Azure Log Analytics’ Kusto Query Language (KQL) to perform transformations on specific tables within the Azure Log Analytics Workspace. Not all tables support transformations please check the for a complete list.
As an example, to add a table transformation for the ‘events’ table in Azure Log Analytics for cost optimization, you could perform the following steps:
Navigate to the Azure portal
Go to your Log Analytics Workspaces
Select the workspace
Under Settings select Tables.
Under the tables panel select the three dots to the right of the table row and click on “create transformation”
– Select a Data Collection Rule
– Under the Schema and transformation select “Transformation editor”
Source will show all data in the table, and a KQL query will allow you to select and project only the data needed.
source
| where severity == “Critical”
| extend Properties = parse_json(properties)
| project
TimeGenerated = todatetime([“time”]),
Category = category,
StatusDescription = StatusDescription,
EventName = name,
EventId = tostring(Properties.EventId)
Cost Reduction Techniques:
Reduced Storage: Setup Data Collection Rules to only capture the desired data, and setup Table Transformations to only allow data required into the Log Analytics workspace.
Regular Revision: Continuously evaluate and update transformation logic to ensure it reflects the current data landscape and business objectives.
4) Cost Management Practices:
The primary objective in the cost management is finding out where the charges are coming from and figuring out ways to optimize either ingestion at the source, or by adopting some or all the strategies outlined in this document. The primary tool that can be used in Azure is the Azure Cost Management and Billing tool. It is used to obtain a clear and actionable view of your Azure expenditure. These tools provide critical insights into how resources are consumed, enabling informed decision-making for cost optimization. In addition to the strategies outlined already, the following are other Cost and Management techniques:
Cost Control Mechanisms:
Budgets and Alerts: Set up budgets for different projects or services and configure alerts to notify you when spending approaches or exceeds these budgets.
Commitment Tiers: Provide a discount on your workspace ingestion costs when you commit to a specific amount of daily data. Commitment can start at 100GB per day at a 15% discount from the pay-as-you-go pricing and as the amount increases the percent discount grows as well. To take advantage of these navigate to the Azure portal, select log analytic workspaces, select your workspace, under settings select Usage and estimated costs, scroll down to see the available commitment tiers.
Log analytic workspaces placement: thoughtful placement of the Log Analytics Workspaces is important and can significantly impact expenses. Start with a single workspace to simplify management and querying. As your requirements evolve, consider creating multiple workspaces based on specific needs such as compliance. Regional placement should also be considered to avoid egress charges. Creating separate workspaces in each region might reduce egress costs, but consolidating into a single workspace could allow you to benefit from Commitment Tiers and further cost savings.
Implementation Strategies:
Tagging and Grouping: Implement resource tagging to improve visibility and control over cloud costs by logically grouping expenditures.
Cost Allocation: Allocate costs back to departments or projects, encouraging accountability and cost-conscious behavior. To find data volume by Azure Resource, Resource Group, or subscription you can use KQL queries such as the following from the Log Analytics workspace Log section :
find where TimeGenerated between(startofday(ago(1d))..startofday(now())) project ResourceId, IsBillable | where IsBillable == true
In conclusion, this document has provided a structured approach to cost optimization in Azure, specifically for services related to Azure Monitor and Log Analytics. Through careful planning of ingestion strategies, data retention policies, transformative data practices, and prudent cost management practices, organizations can significantly reduce their cloud expenditures without sacrificing the depth and integrity of their analytics. Each section outlined actionable insights, from filtering and sampling data at ingestion to employing intelligent retention and transformation strategies, all aimed at achieving a cost-effective yet robust Azure logging environment. By consistently applying these strategies and regularly reviewing usage and cost patterns with Azure Cost Management tools, businesses can ensure their cloud operations remain within budgetary constraints while maintaining high performance and compliance standards.
This article is contributed. See the original author and article here.
Introduction
Exclusions in Azure WAF (Web Application Firewall) are a critical feature that allows administrators to fine-tune security rules by specifying elements that should not be evaluated by WAF rules. This capability is essential for reducing false positives and ensuring that legitimate traffic flows unimpeded. Exclusions are designed to fine-tune the WAF’s sensitivity, allowing legitimate traffic to pass through while maintaining robust security measures. They are particularly useful in scenarios where certain request attributes, such as specific cookie values or query strings, are known to be safe but might trigger WAF rules due to their content or structure.
Azure WAF Exclusions: A Closer Look
Azure WAF exclusions can be applied to a rule, set of rules, rule group, or globally for the entire ruleset. This flexibility is crucial for meeting application-specific requirements and reducing false positives. For instance, exclusions introduced with CRS 3.2 on regional WAF with Application Gateway now allow attribute exclusions definitions by name or value of header, cookies, and arguments.
Attributes for WAF exclusions
Attributes that can be excluded include:
Request headers
Request cookies
Query strings
Post args
JSON entity (only for AFD WAF)
Operators for exclusions include:
Equals: For exact matches.
Starts with: Matches fields starting with a specific selector value.
Ends with: Matches fields ending with a specified selector value.
Contains: Matches fields containing a specific selector value.
Equals any: Matches all request fields (useful when exact values are unknown).
Note: The “Equals Any” condition automatically converts any value you enter in the selector field to an asterisk (*) by the backend when creating an exclusion. This feature is especially valuable when handling unknown or random values.
Exclusions can be applied on:
Rule
Rule set
Rule group
Global
Azure Front Door WAF: Exclusion Example
Azure Front Door WAF allows for exclusions to be set at a detailed level, targeting the values of match variables like request headers, cookies, and query strings. This granularity ensures that only the necessary parts of a request are excluded from rule evaluation, reducing the likelihood of false positives without significantly impacting the overall security posture.
When configuring Azure Web Application Firewall (WAF) to inspect JSON request bodies, it’s crucial to understand how to handle legitimate requests that might otherwise be flagged as potential threats. For instance, consider the following JSON request body:
JSON Example
{
“posts”: [
{
“eid”: 1,
“comment”: “”
},
{
“eid”: 2,
“comment”: “”1=1″”
}
]
}
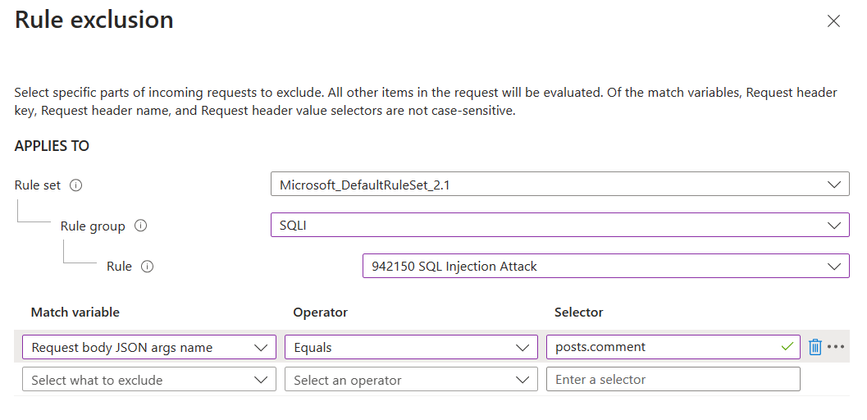
In this example, the “1=1” in the comment field could be mistaken by the WAF as a SQL injection attempt. However, if this pattern is a normal part of your application’s operation, you can create an exclusion to prevent false positives. By setting an exclusion with a match variable of Request body JSON args name, an operator of Equals, and a selector of posts.comment, you instruct the WAF to overlook the “comment” property when scanning for threats. To refine the exclusion and make it more specific, we have applied it solely to the ‘SQLI’ rule group and the ‘942150 SQL Injection Attack’ rule. This ensures that only this particular selector is exempt from inspection by this rule, while all other rules will continue to inspect it for any threats.
Note: JSON request bodies inspection For Azure Front Door WAF is available from DRS 2.0 or newer.
Application Gateway WAF: Exclusion Example
For WAF on Application gateway we will use a different JSON example:
JSON Example
{
“properties”: {
“credentials”: {
“emai.l=l”: “admin”,
“password”: “test”
}
}
}
In the previous example, we examined the value of the selector. However, in this case, our focus is on excluding the selector key itself, rather than excluding the value within the key. Above in the JSON example you can see “properties.credentials.emai.l=l” and This specific key contains “l=l”, which could potentially trigger an SQL injection attack rule. To exclude this specific selector, we’ve created an exclusion rule matching the variable “Request Arg Keys” with the value “properties.credentials.emai.l=l”. This exclusion prevents further false positives.
Furthermore, within Application Gateway WAF, you have the flexibility to selectively apply this exclusion to specific rules. In our scenario, we’ve opted to apply it to Rule 942130: SQL Injection Attack: SQL Tautology. This means that we’re excluding this particular key only for this specific rule, while still ensuring that the rest of the JSON is thoroughly inspected by the remaining ruleset
Note: Request attributes by names function similarly to request attributes by values and are included for backward compatibility with CRS 3.1 and earlier versions. However, we it’s recommended using request attributes by values instead of attributes by names. For instance, opt for RequestHeaderValues rather than RequestHeaderNames
This approach ensures that legitimate traffic is not inadvertently blocked, maintaining the flow of your application while still protecting against actual security risks. It’s a delicate balance between security and functionality, and exclusions are a powerful tool in the WAF’s arsenal to achieve this balance. Always verify the legitimacy of such patterns before creating exclusions to maintain the security posture of your application.
Match variable mapping.
When setting up exclusions, it can be challenging to map the Match variables you observe in your logs to the corresponding configuration on your Web Application Firewall (WAF). By referring to this table, you can streamline the exclusion process and ensure that your WAF is accurately tuned to your traffic.
Azure Application Gateway
MatchVars in Logs
MatchVars for Excl.
REQUEST_HEADERS_NAMES
Request Header Keys
REQUEST_HEADERS
Request Header Values/Names
REQUEST_COOKIES_NAMES
Request Cookie Keys
REQUEST_COOKIES
Request Cookie Values/Names
ARGS_NAMES
Request Arg Keys
ARGS
Request Arg Values/Names
ARGS_GET
Request Arg Values/Names
REQUEST_URI
Custom Rule
REQUEST_BODY
Request Arg Values/Names
REQUEST_BASENAME
Custom Rule (Part of URI)
MULTIPART_STRICT_ERROR
N/A
REQUEST_METHOD
N/A
REQUEST_PROTOCOL
N/A
Request_Filename
Custom
REQUEST_URI_RAW
Custom
XML
Custom
MULTIPART_STRICT_ERROR
N/A
Azure Front Door WAF
MatchVars in Logs
MatchVars for Excl.
HeaderValue
Request header name
CookieValue
Request cookie name
QueryParamValue
Query string args name
MultipartParamValue
Request body post args name
JsonValue
Request body JSON args name
URI
Custom Rule
InitialBodyContents*
Custom Rule
DecodedInitialBodyContents*
Custom Rule
Best Practices for Implementing Exclusions
When implementing exclusions, it’s crucial to follow a structured approach:
Document Current Settings: Before making any changes, document all existing WAF settings, including rules and exclusions.
Test in Staging: Apply and test exclusions in a non-production environment to ensure they work as intended without introducing new risks.
Apply to Production: Once verified, apply the tested exclusions to the production environment, monitoring closely for any unexpected behavior.
Conclusion
Exclusions in Azure WAF, whether for Azure Front Door or Application Gateway, offer a nuanced approach to web application security. By understanding and utilizing these features, administrators can ensure that security measures are effective without disrupting legitimate user activity. As Azure WAF continues to evolve, the ability to fine-tune security through exclusions will remain a cornerstone of its effectiveness.
This article is contributed. See the original author and article here.
In today’s dynamic business environment, efficient resource allocation and planning are paramount for the success of any organization. Microsoft Dynamics 365 Customer Service brings a powerful forecasting feature that empowers businesses to predict and manage their service volumes and agent demands effectively. Leveraging AI-based algorithms, this intelligent forecasting model runs behind the scenes, analyzing historical data and trends to provide accurate predictions. With the ability to forecast both volume and agent demand, organizations can streamline their operations, optimize resource allocation, and ultimately enhance customer satisfaction. This blog post focuses on volume forecasting for cases and conversations as well as agent forecasting for conversations.
Front-office and back-office forecasting
Dynamics 365 Customer Service recognizes the diverse nature of service channels, distinguishing between front office and back-office operations. Front office channels encompass voice, chat, email, messaging, and social channels, representing direct interactions with customers referred to as conversations in Dynamics 365. Back-office operations, on the other hand, refer to cases that require internal processing and resolution. Customer Service offers flexibility in forecasting front-office, back-office, or blended agents. This capability enables organizations to tailor their strategies to the specific needs of each operational area, ensuring optimal resource utilization and service delivery.
Volume forecasting
Forecasting provides daily forecasts for case and conversation volumes for up to six months into the future. Daily forecasts enable organizations to anticipate and prepare for fluctuations in service demand. Additionally, the system offers intraday forecasts at 15-minute intervals. Intraday forecasts allow for granular planning up to six weeks ahead. This level of foresight empowers businesses to allocate resources efficiently, ensuring optimal service levels.
Agent Forecasting
In addition to volume forecasting, organizations can forecast agent demand for conversations on a daily interval for up to six months into the future. Like volume forecasting, the system provides intraday forecasts at 15-minute intervals, allowing for precise resource allocation and scheduling.
Incorporating service-level metrics
The feature considers operational metrics such as service level, shrinkage, and concurrency when forecasting agent demand. By considering these factors, organizations can ensure that the agent capacity forecast aligns with service level agreements and operational constraints, maximizing efficiency and customer satisfaction.
Auto-detection of seasonality
By analyzing historical traffic patterns, our AI model automatically detects seasonality, enabling more accurate forecasts. This feature helps organizations adapt their operations to seasonal variations in service demand. Addressing these variations helps organizations maintain high service levels regardless of fluctuations in customer activity.
Auto-detection of holidays
Our forecasting model utilizes historical traffic patterns to automatically identify holidays, which leads to more precise predictions. This functionality assists organizations in adjusting their operations according to holiday-related changes in service demand across various regions, guaranteeing that they can maintain optimal service levels despite fluctuations in customer activity during holidays.
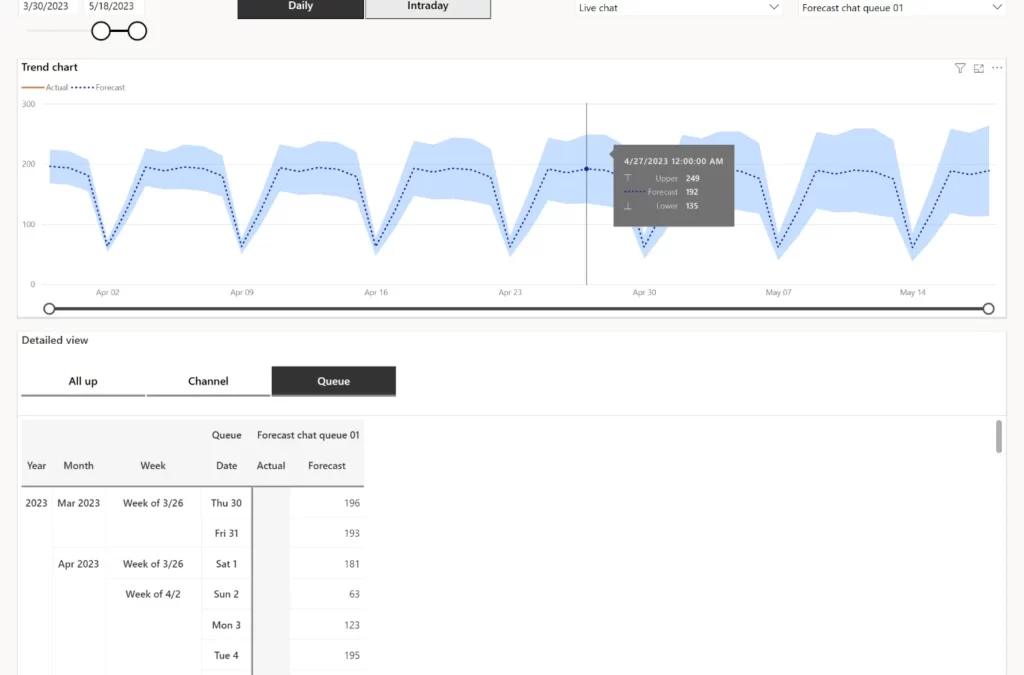
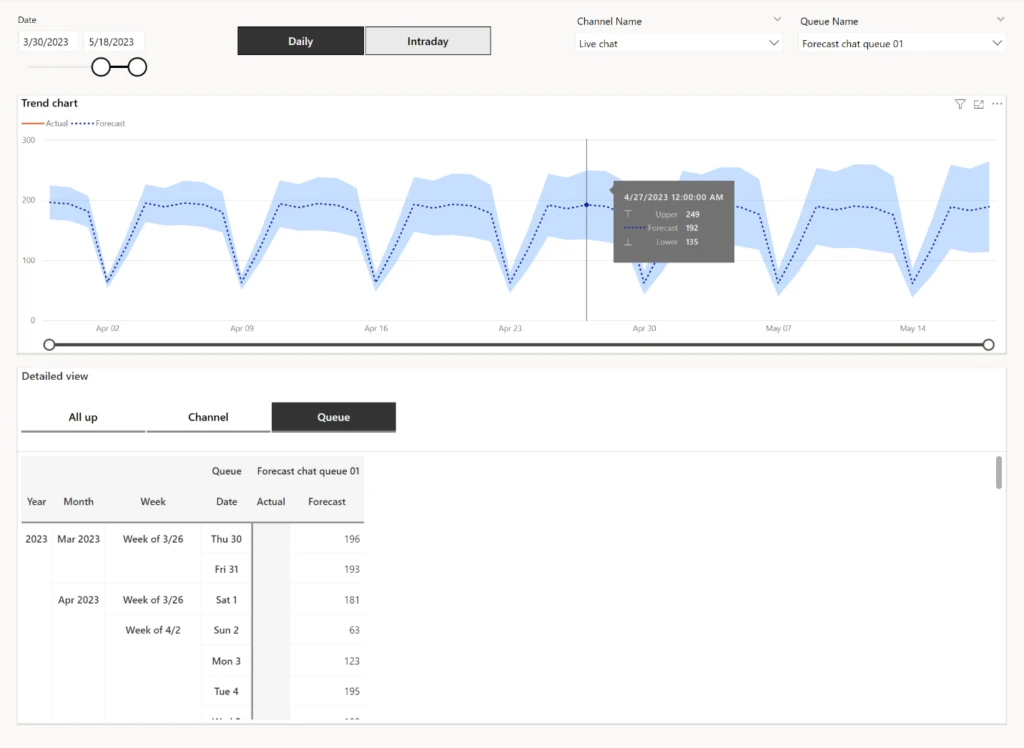
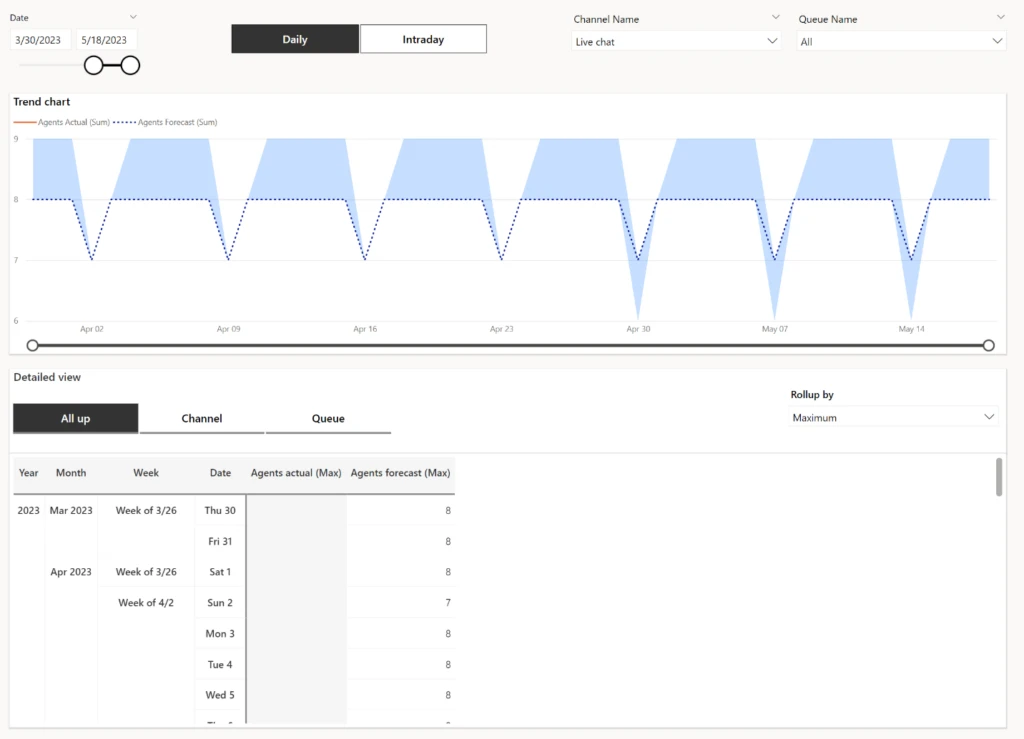
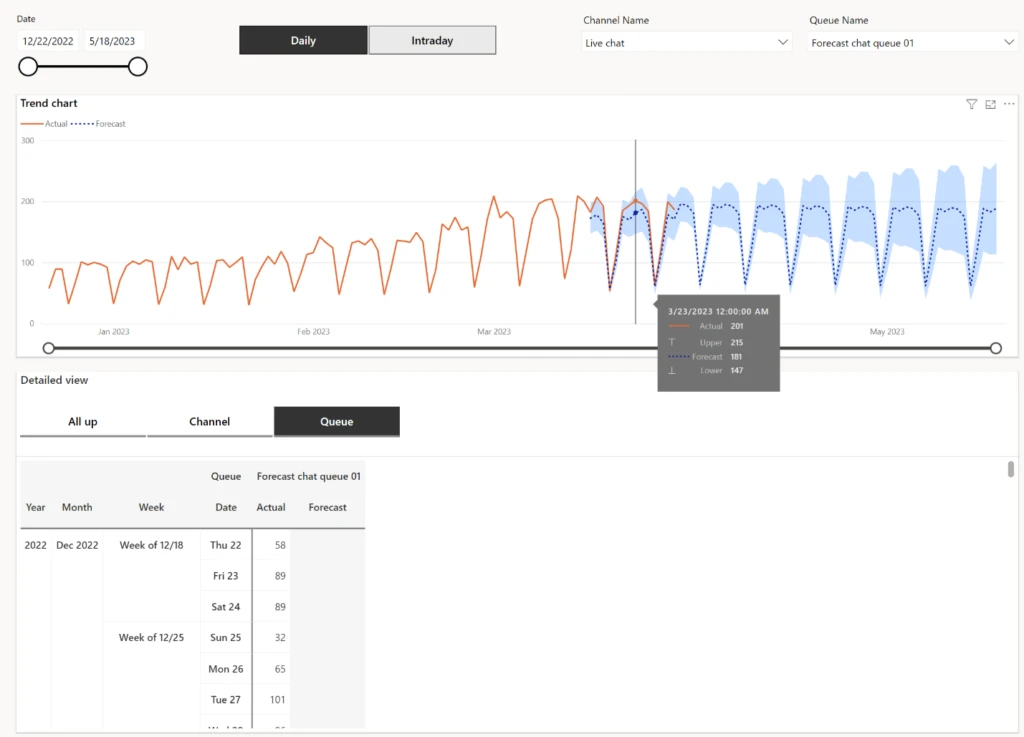
Forecast vs. actual charts
User-friendly charts are available to visually represent service volume and agent demand forecasts alongside actual performance across daily, weekly, and monthly intervals for up to six months. This comparison enables organizations to assess the accuracy of their forecasts and identify areas for improvement.
Customizable slicing and exporting
The flexibility of forecasting extends to its ability to slice forecast data by channels and queues, providing insights tailored to specific operational needs. Moreover, users can export forecast data into a spreadsheet for further analysis or integration with other tools, enhancing the usability and accessibility of the forecasting feature.
Key considerations for accuracy
We recommend the following criteria for using historical data to generate accurate forecasts.
Non-sparse data: The dataset contains information for every day, ensuring that there isn’t missing or incomplete data. Each day has a recorded volume, providing a comprehensive set of observations.
Clear weekly pattern: The data shows a weekly pattern, wherein the volume consistently follows a specific trend. For instance, weekends consistently have low volumes, while workdays show higher volumes, and vice versa. This pattern helps establish a reliable basis for forecasting.
Volume-based accuracy: If the criteria are met, the forecast quality improves with larger volume inputs. Higher volumes of data contribute to a more accurate and robust forecast.
Absence of level shift: Recent days and future periods don’t experience any sudden or significant shifts in volume levels. This absence of sudden changes ensures that the historical patterns stay relevant and dependable for forecasting purposes.
Longer historical data set: If all the above criteria are met, a longer history of data further improves the forecast accuracy. A greater historical data set provides a more comprehensive understanding of the patterns and trends over time. With an extended history, the forecast model can capture and incorporate more variations, leading to more accurate predictions.
Weighting recent forecast accuracy: When considering future periods, understand the forecast’s accuracy tends to be higher for more immediate timeframes. As time progresses, the certainty and precision of the forecast may decrease. Therefore, the most recent forecast should be given more weight and considered to have better accuracy compared to future forecasts.
Stay ahead of the curve
In conclusion, forecasting offers a comprehensive solution for predicting support volumes and agent demand, empowering organizations to optimize their operations and enhance customer satisfaction. With daily and intraday forecasts, and auto-detection of seasonality, businesses can achieve greater efficiency and agility in their service delivery. With Dynamics 365 Customer Service, organizations are driving success and growth through effective resource planning and management.


Recent Comments