This article is contributed. See the original author and article here.
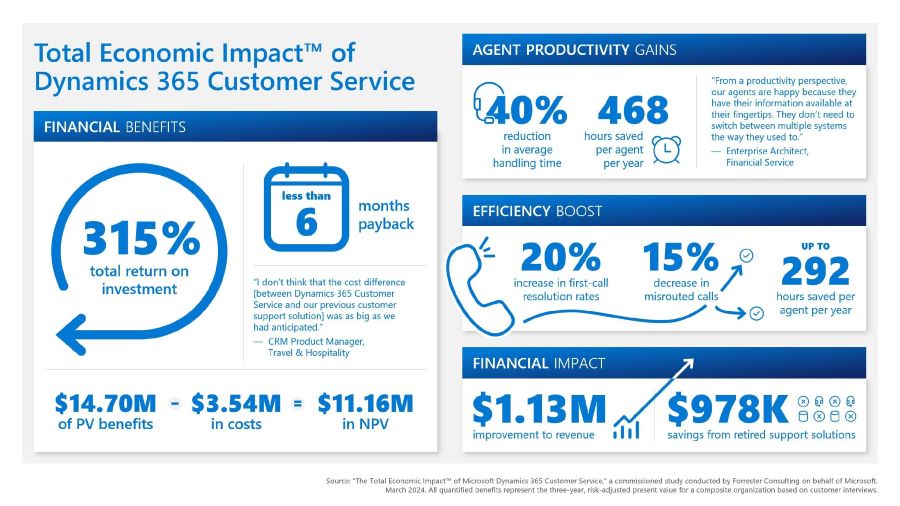
Great customer service is absolutely critical to any organization’s success. Today, organizations require modern solutions that can help them support customers on the channels and touchpoints of their choice, by providing customers with self-service options and arming customer support agents with access to information and experts to resolve issues quickly and efficiently. We are pleased to share the results of a March 2024 Forrester Consulting Total Economic ImpactTM (TEI) Study commissioned by Microsoft. Forrester calculates Dynamics 365 Customer Service delivered benefits of $14.70 million over three years to a composite organization. The total investment required was $3.54 million over three years and provided a ROI of 315% with a payback period of less than six months.
Methodology and purpose
Forrester’s TEI study is a methodology developed specifically to assist companies with the complexities of procuring technology solutions. The TEI study also aids technology vendors in objectively evaluating and communicating their solutions’ value proposition. To these ends, the TEI study discussed here provides a framework for business-decision-makers to assess the potential financial impact of implementing Dynamics 365 Customer Service.
dynamics 365 customer service drives roi and enhances operations
Ultimately, the financial impact of the 2023 study is a projection for a composite organization developed by Forrester through real-world interviews with five businesses that currently use Dynamics 365 Customer Service. These businesses’ experiences and the interview results are aggregated to create a composite organization to obtain data about costs, benefits, and risks. For this study, the composite organization is a $1 billion industry-agnostic organization that operates at multiple locations around the world. It has 5,000 employees total, and 500 of those are customer support agents who support a growing customer base. Each agent works an average of six hours a day and spends 75% of that time on support interactions.
Continue reading to learn what key challenges the composite organization faces and the study’s critical findings.
Key challenges
In the interviews conducted for this TEI study, the organizations shared the following common challenges:
A disparate stack of aging customer support and customer relationship management (CRM) solutions.
Siloed customer data, which led to suboptimal support.
Increasing support capacity requirements.
An inconsistent and one-sized customer experience.
With these challenges top of mind, the organizations wanted to find and invest in a customer service solution that could:
Integrate seamlessly with other Microsoft solutions, including other Microsoft Dynamics 365 modules, Microsoft Power BI, and Microsoft Teams.
Deliver automation and AI-driven insights to the customer support function to enable agents to deliver a better support experience while limiting the requirements for additional support agents.
Help establish and curate a knowledgebase to help agents further support the customer experience.
Key findings
Microsoft Dynamics 365 Customer Service provides service organizations’ agents the tools they need to deliver faster, seamless, personalized experiences across any channel. Dynamics 365 Customer Service simplifies and automates support agent processes with Microsoft Copilot in Dynamics 365 Customer Service while delivering faster support experiences to organizations’ customers, which can improve customer satisfaction and lead to additional revenue and profit.
Forrester’s study revealed four quantifiable impact areas: improved handling times leading to greater agent productivity, improvements to first-call resolution and misrouted calls, improvement to sales pipeline generation leading to revenue increases, and cost savings after retiring other customer service solutions.
Let’s take a closer look at each of these areas below to understand how Dynamics 365 Customer Service delivers value for customer support organizations.
Reduced call handling time by 40%
Interviewees noted several inefficiencies across their organizations’ previous customer service solutions that increased agents’ interaction time with customers:
Multiple solutions for different support functions, leading to siloed customer data and relevant support information.
Lack of visibility into customer histories and best practices for service and resolution.
A one-size-fits-all approach to service-case routing.
No automation for common support tasks.
Implementing Dynamics 365 Customer Service enabled their organizations to automate manual aspects of their agents’ daily responsibilities, which helped to reduce the time they spent searching for customer information and best practices. Because agents were able to have shorter, more efficient interactions with customers, the composite organization saved an average of 468 hours per agent each year.
Improved first-call resolution by 20%—and decreased misroutes by 15%
With their legacy customer support tools, agents at the study’s participant organizations had no easily accessible customer knowledge base with records of common support issues. They also had no easy way to locate specialists who could help resolve issues, so calls were frequently misrouted to the wrong specialists.
With Dynamics 365 Customer Service, they found they could automatically route support cases to the best specialists depending on the nature of the case. This helped them to both increase first-call resolution rates by 20% and shorten the overall time of interactions. They also decreased the times agents misrouted calls to the wrong specialists by 15%. Overall, the composite organization’s agents saved up to 292 hours per year.
Increased sales pipeline generation to drive additional profitability
Some interviewees shared revenue impact to their organizations’ revenue based on the implementation of Dynamics 365 Customer Service. A CRM product manager at a travel and hospitality organization explained that because Dynamics 365 Customer service automates the majority of searches performed by agents, they can spend more time on revenue-linked interactions. Another interviewee at a manufacturing organization said that customer information and leads are shared between support agents using Dynamics 365 Customer Service and salespeople using Microsoft Dynamics 365 Sales, enabling salespeople to see customer interactions and identify opportunities for new revenue.
Saved up to $978,000 in costs on retired customer service solution(s)
By implementing Dynamics 365 Customer Service, participant organizations were able to retire their previous customer service solutions, saving costs on license fees, infrastructure, and personnel maintenance hours. Interviewees from one manufacturing organization said their company reclaimed nearly $100,000 annually by decommissioning two third-party customer service solutions made redundant by Dynamics 365 Customer Service.
Other benefits
Forrester Consulting Total Impact Study
See the total economic impact of Dynamics 365 Customer Service
Study participants mentioned additional benefits to their organizations that were not quantified for this report, including:
Integration with other Microsoft products including Microsoft Power BI for discovering and predicting common support issues and Teams for easy collaboration between support agents and specialists to help resolve issues.
An improved customer support experience with reductions in key support metrics such as handle time, hold time, and resolution rates—and the ability to deliver faster, more personalized, and more nuanced support experiences with Dynamics 365 Customer Service.
Next steps
Forrester’s TEI study of Dynamics 365 Customer Service found four primary quantifiable impact areas and several soft benefits. Taken together, the study found that Dynamics 365 Customer Service delivered a total economic impact of $14.7 million in financial savings over three years. The total investment required was $3.54 million over three years and provided a ROI of 315%.
This article is contributed. See the original author and article here.
Welcome to our March 2024 update.
This month, export to CSV and show details in PivotTables are now available in Excel for the web. Also, creating Power BI-connected tables is available in Excel for Windows users, and Office Scripts for Office 365 E1 and F3 licenses.
Excel for Web:
Export to CSV
Show Details in PivotTables #FIA
Excel for Windows:
Create Power BI Connected Tables in Excel
Office Scripts for Office 365 E1 and F3 Licenses
Excel for Web
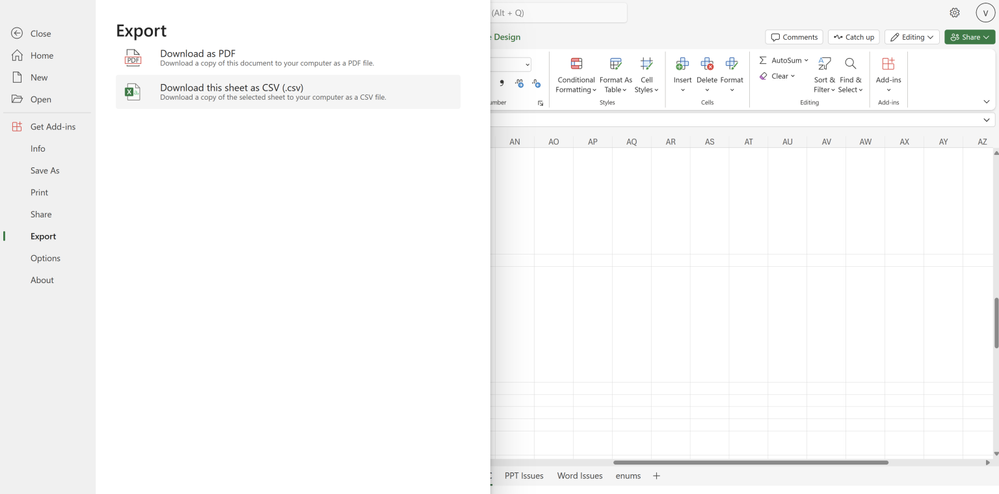
1. Export to CSV
The ability to export to CSV is now available to all Web users. This experience was already supported for Windows, and Mac users and we’ve now expanded this service to all Web users. Take advantage of this lightweight file format in Excel for the Web to exchange and use data between apps and across platforms. Read more here > Export to CSV
#FIA
2. Show Details in PivotTables We’ve added a new button on the ribbon under the ‘PivotTable Analyze’ tab called Show Details, this button allows you to drill into your PivotTables. Previously, you were able to double-click a value cell in the PivotTable and create a new table to further analyze the details for that value. This button makes this existing capability easier to find and use. This functionality was already available for Web users.
Excel for Windows
1. Create Power BI Connected Tables in Excel A new Insert Table option is now available for the Power BI Datasets pane in Excel. It enables users to create a connected table directly in Excel. This streamlines the workflow of adding data and is friendlier to more Excel users. This is now available for all Windows and Web users. Read more here >
Power BI Connected Tables
2. Office Scripts for Office 365 E1 and F3 Licenses Starting today you can find the Office Scripts feature set in the Automate tab on the Excel ribbon. Office Scripts is an automation platform in Excel that allows users with all levels of programming experience to automate their repetitive workflows. To get started, use the Action Recorder to record the actions you take in Excel. These actions are then translated into a script that you can run at any time. No programming experience required! Read more here > Office Scripts
Check if a specific feature is in your version of Excel
Your feedback helps shape the future of Excel. Please let us know how you like a particular feature and what we can improve upon—“Give a compliment” or “Make a suggestion”.. You can also submit new ideas or vote for other ideas via Microsoft Feedback.
Special thanks to our Excel MVPs David Benaim andBill Jelenfor their contribution to this month’s What’s New in Excel article. David publishes weeklyYouTube videosand regularLinkedIn postsabout the latest innovations in Excel and more. Bill is the founder and host ofMrExcel.comand the author of several books about Excel.
This article is contributed. See the original author and article here.
Microsoft Teams is where work happens, and now we’re excited to announce new Copilot in Teams enhancements that will supercharge collaboration and make hybrid meetings even better. Read on for all the details.
This article is contributed. See the original author and article here.
1. Overview
When gathering SharePoint data through Microsoft Graph Data Connect in a large tenant, you might be pulling many thousands, millions or even billions of objects. If you want to get just a subset of the results, there is a mechanism to filter the results at the source.
A common example is to pull the data just for one site (filtering for the site id) to get started with a large tenant. This way your results will be smaller, cheaper, and easier to handle. You can also use this to get just specific types of sites, like OneDrive or Communication sites.
In this blog, we’ll investigate how you can apply a filter to a dataset in Microsoft Graph Data Connect for SharePoint.
2. What is filtering?
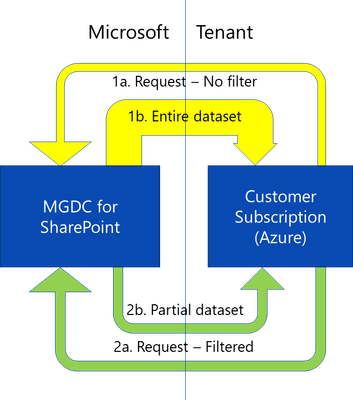
When you request data from the Microsoft Graph Data Connect for SharePoint, you get the full dataset. For instance, if you request the Sites dataset, you get all the sites in the tenant. This is described in the yellow paths below.
If you provide a filter with the request, you can get a partial dataset based on a filter expression. You could, for instance, request all sites with a template id of 21 (that means a OneDrive). This is shown by the green paths above.
In short, filtering delivers a partial dataset based on a filter expression specified in the request. Only objects that meet the criteria are delivered.
The main uses for filtering include:
Reducing the size of the transfers
Excluding sensitive data from the results
Filtering is available only in these specific SharePoint datasets:
SharePoint Sites
SharePoint Permissions
SharePoint Group
SharePoint Files (coming soon)
SharePoint File Actions (coming soon)
Note: Microsoft Graph Data Connect also offers an option to exclude specific columns from the results, which is another mechanism to protect sensitive data.
3. Datasets and Columns
This filtering feature applies only to the SharePoint datasets listed below. You can filter by Site Id in all SharePoint datasets. You can also filter by Template Id in the Sites, Files and File Actions datasets:
If you’re interested in filtering for additional SharePoint dataset columns, please let us know in the comments.
4. Expressions and Operators
Filters are specified using an expression. The expression usually includes a column (as described in the previous section), an operator and a constant.
To add a filter to your request, you must specify a DataFilter property in the JSON representation of the request. Start by selecting the Copy Data task you are using and going to the “Source” tab of the Copy Task properties.
Click on the “{ }” button on the top right (indicated above with a red arrow), which brings up the JSON definition for the request.
In the JSON definition, find the “source” section under “typeProperties”, where you can find the “dateFilterColumn”, the “startTime” and the “endTime” properties. Add a new “DataFilter” property with the expression you want to apply. Save the changes to the JSON and make sure to publish the pipeline to apply the changes.
In the screenshot above, you see the definition indicated by the red arrow: acitvity >> typeProperties >> source >> DataFilter >> RootWeb.WebTemplateId eq 21
Be very careful. If you specify the filtering expression in the wrong place in the JSON, the request may fail, or it could just run without filtering anything from the dataset. If you’re running this in a large production tenant, it is recommended to try this first in a small test or dev tenant.
6. More Request Metadata
As a result of this extra property in your request, the results will be filtered, and you will see fewer rows/objects in your output. Another way to see this is looking at the metadata file that is produced with any Microsoft Graph Data Connect run. Look for a folder called “metadata” in the same place you assigned to receive the data (your Azure account container and folder).
In the job metadata file associated with this request, you will see a few additional properties:
IsFilterApplied – Shows true if the request included a filter expression.
Filter – The expression passed by in the DataFilter property.
NumberOfRowsExtracted – Shows the number of rows after the filter was applied.
It is possible to combine the filtering and the delta features of the SharePoint datasets in Microsoft Graph Data Connect.
When you specify a filtering expression and two different dates, the dataset will be first filtered and then the differences between the two dates will be calculated.
If you pass an expression for filtering and there is a problem with it, Microsoft Graph Data Connect for SharePoint will fail the request and no data will be returned. An error message will be returned so you can understand what happened.
Here are some of the common error conditions:
Cannot filter and sample at the same time. If you specify both a DataFilter and the Top properties, you will get an error like this:
Operation on target Copy_Sites failed:
ErrorCode=UserErrorOffice365DataLoaderError,
'Type=Microsoft.DataTransfer.Common.Shared.HybridDeliveryException,
Message=Office365 data loading failed to execute.
office365LoadErrorType: PermanentError.
Not Supported: Both DataFilter and AdditionalDataSetProperties with 'top' can not be specified at the same time,
Source=Microsoft.DataTransfer.ClientLibrary,'
You specified a column name that is not one the columns supported for that dataset. If you specify a non-existent or unsupported column, you will get an error like this:
Operation on target Copy_Sites failed:
ErrorCode=UserErrorOffice365DataLoaderError,
'Type=Microsoft.DataTransfer.Common.Shared.HybridDeliveryException,
Message=Office365 data loading failed to execute.
office365LoadErrorType: PermanentError.
[1]: Invalid schema specified in filters.
Only few columns are supported for filters.
Supported Columns: ['Id', 'RootWeb.WebTemplateId'].
Usage Example: Id eq '00000000-0000-0000-0000-000000000000'
or RootWeb.WebTemplateId eq 21'
,Source=Microsoft.DataTransfer.ClientLibrary,'
You specified a bad expression. If you specify a malformed expression in your DataFilter expression, you will get an error.
9. Conclusion
I hope this blog post will help you get started with Filtering. For more information about Microsoft Graph Data Connect for SharePoint, please visit the collection of links I keep at Links about SharePoint on Microsoft Graph Data Connect.
This article is contributed. See the original author and article here.
In the dynamic field of service management, efficiency, accuracy, and streamlined processes are key. The new work order experience in Dynamics 365 Field Service, introduced in the 2023 release wave 2 (release plan), offers a refreshed user interface that revolutionizes work order creation, management, and scheduling. We’ve continued to refine and add new features based on your feedback, and starting wave 1 2024, the new experience will be the default for all organizations (release plan).
What Is the New Work Order Experience?
The new work order experience is a complete revamp of the existing work order management system within Dynamics 365 Field Service. It simplifies the entire lifecycle of work orders, easing seamless collaboration among service managers, technicians, and dispatchers. Here are the key features:
Experience the power of Copilot: Achieving operational excellence and building customer trust are paramount for organizations. Copilot, your companion in this journey, provides a summary of the current work order to help you get up to speed quickly. The contextually aware booking card suggests next steps, making the transition from incoming work to completed work smoother.
Streamlined forms: The new work order form features visually appealing layouts with fields that can be quickly updated, reducing clicks by up to 39%. Say goodbye to cumbersome data entry and hello to efficiency.
Enhanced Work Order List: The revamped work order list lets you understand what’s most important to you by introducing visuals to denote work order status, priority, and booked resources. Common actions are readily accessible inline or through the all-new side pane, dropping the need to open a full form for minor updates.
Let’s explore each of these capabilities in more detail.
Overview of the new experience
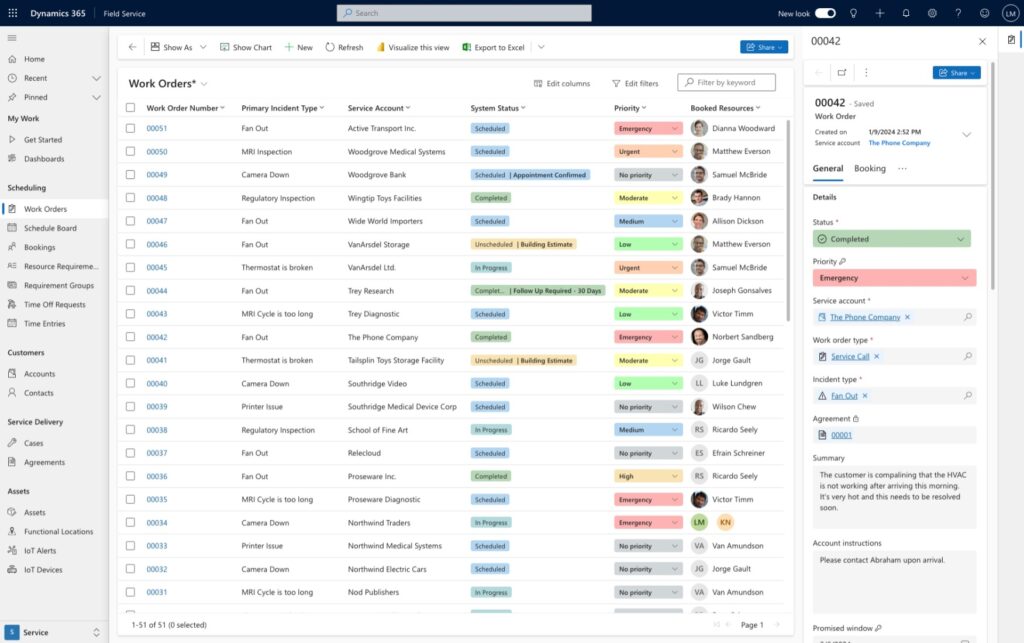
Work Order Grid
We’ve rebuilt the work order grid from the ground up to increase performance and enable new capabilities such as inline editing of commonly changed fields like priority. We’ve enhanced the visual appeal of the status field and recently added the ability to see booked resources too. You can now configure whether you want just the work order ID or all linked entities to be clickable in the grid. Lastly, we’ve built inline actions and introduced a side pane for quick edits within the flow of work.
Work Order Form
We’ve updated the work order form to reflect how most organizations manage their work from start to finish. The most vital information is now in the General tab, we’ve merged billable work into a unified Products and Services section, we’ve grouped tasks and inspections under Tasks, and we’ve pulled all reference materials – such as knowledge articles, Dynamics 365 Guides, and timeline media – into the References tab.
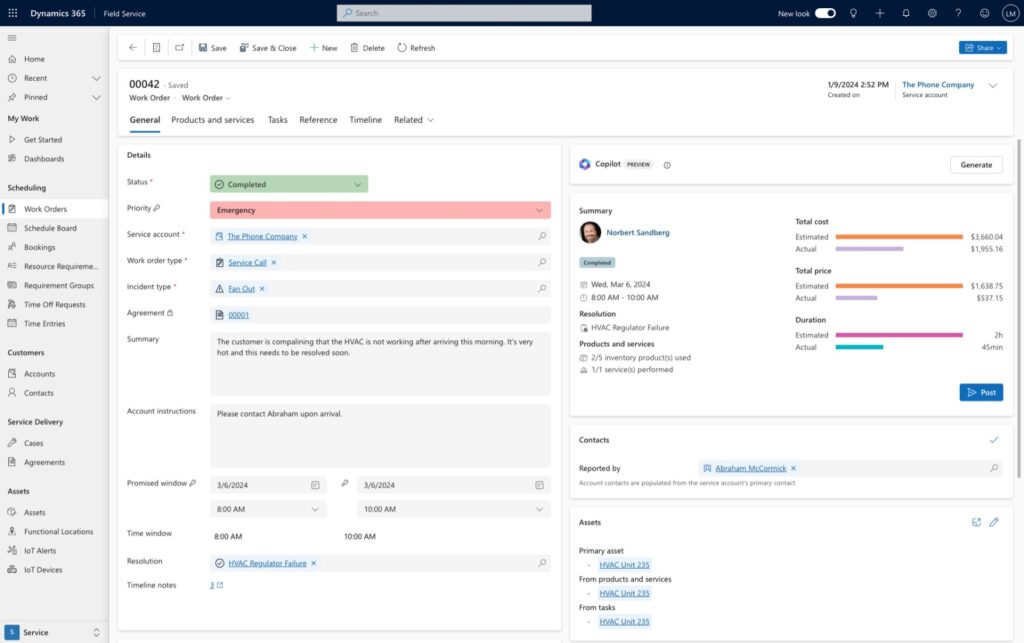
General
We reorganized the general tab into a two-column setup for improved readability and better usability, focusing on the most essential information for service organizations. These enhancements are designed to make your daily tasks smoother and more efficient, based on user feedback and telemetry. Key improvements include:
Copilot summary: Copilot helps you quickly catch up on work details and suggests next steps based on the work order status.
Contextually-aware booking card: This card is an evolution of the business process flow in Field Service, guiding you through the process of moving a work order from unscheduled to completed effortlessly.
Asset card redesign: Set and view primary assets, along with any assets linked to products or services, with improved visualization and navigation of the asset hierarchy.
Revamped locationcard: Easily pinpoint where work needs to be done on a map, with an enhanced visualization of functional locations using a hierarchical breadcrumb.
Modernized contactcard: Introduction of profile cards for detailed information on issue reporters and primary account contacts, facilitating easy communication via email, call, or Teams message.
Improved priority field: Features color-coded priority indicators for better understanding of emerging priorities.
Unified Status and Sub-status Field: Select both status and sub-status from a single field, with new color indicators for quick visual reference.
Timeline notes counter: Quickly check if there are any linked notes in the timeline, reducing the need to access the full timeline experience within the general tab.
Simplified action bar: Streamlined interface with commonly used actions, reducing clutter and focusing on essential functions.
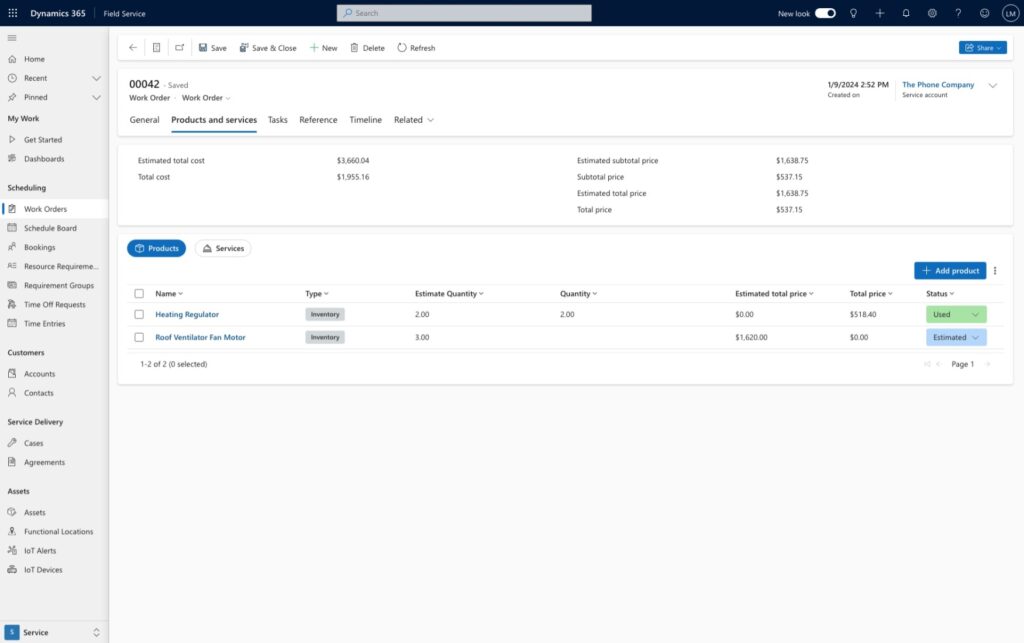
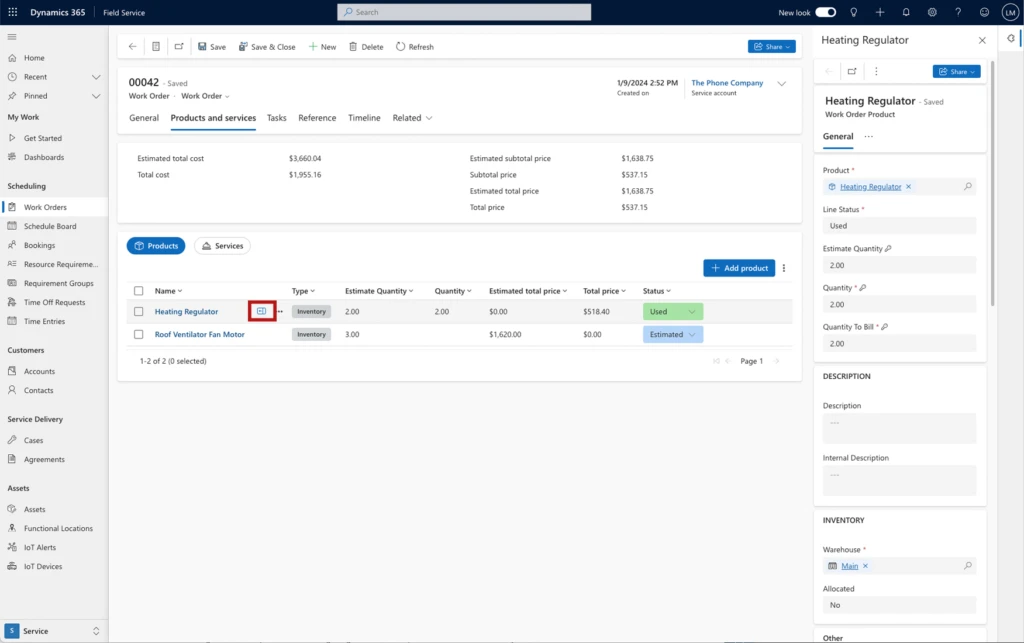
Products and Services
We’ve unified the Product and Services into a single tab, with a unified summary of financials atop it. Service managers can easily switch between the products and services view, make changes to used inventory and services inline, and open the side pane for more detailed changes.
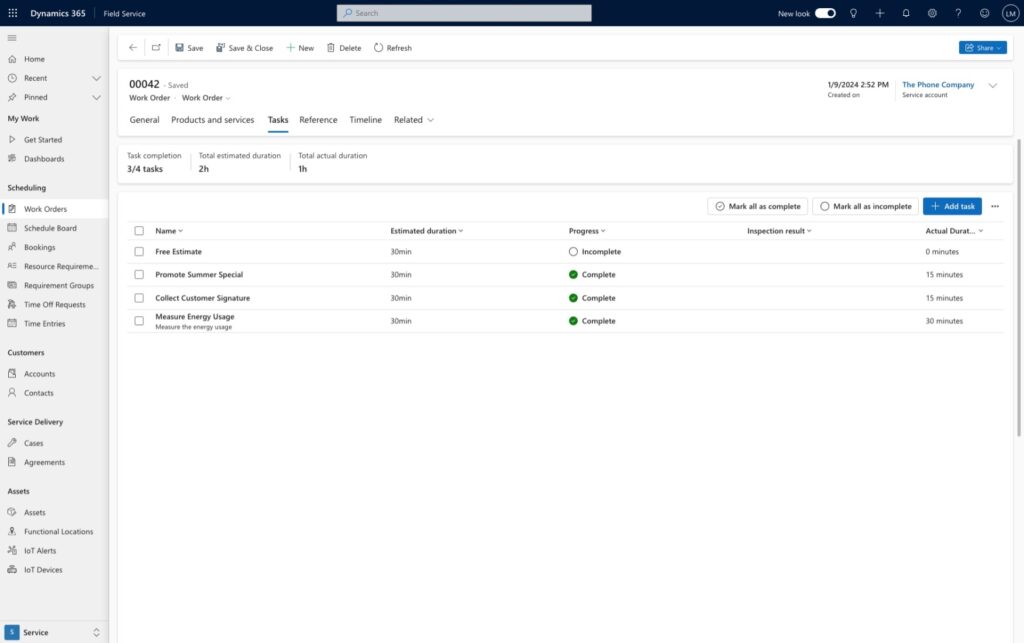
Tasks
The tasks section captures the steps that need to be done to complete the work. A summary card keeps count of scheduled vs. completed tasks and duration. You can also visualize if a tasks includes linked items to help technicians complete their work with Dynamics 365 Guides or capture their work result with inspections.
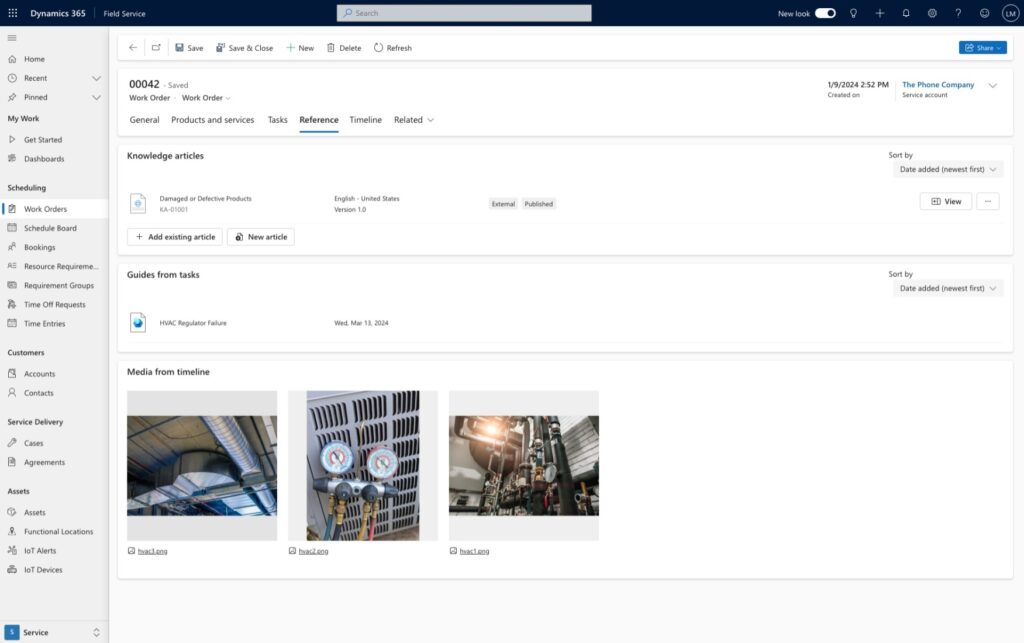
Reference
You can now find all your references in a unified experience that includes knowledge articles that capture fixes or known issues for commonly encountered issues, Dynamics 365 Guides that are linked to tasks, and media that has been attached to the timeline.
Side Panes
The introduction of the side panes is one of the biggest changes in the redesigned work order experience. Side panes allow you to see more details or make minor tweaks to related content in the context of your work. From being able to make tweaks to work order instructions from the work order grid, to updating product inventory financial data in a form, side panes keep you productive. Side panes are available in the work order grid, products and services grids, tasks grids, and when opening related items such as assets.
Transitioning to the new experience
Embracing change can be daunting, but the benefits are worth it. Starting wave 1 2024, the new experience will be the default for all organizations. There are several reasons why organizations should consider transitioning to the new experience starting now:
Stay ahead: The field service industry is evolving rapidly. By adopting the new work order experience, you position your organization at the forefront of innovation.
Future-proof your processes: Microsoft’s commitment to continuous improvement means that the new experience will evolve further. Be part of that journey.
Training and support: Microsoft provides resources to help you transition smoothly. We’ve invested in robust documentation to guide you and your organization through the process.
Next Steps
The new work order experience in Dynamics 365 Field Service isn’t just an upgrade—it’s a leap forward. Embrace it, empower your team, and elevate your field service operations. Efficiency, collaboration, and customer satisfaction await!
Ready to take the plunge? Start your journey today to ensure your organization stays competitive and prepared for the future of field service management. Explore the official documentation to get started, download our adoption playbook to aid you in the deployment process, and don’t forget to share your feedback using the Feedback button in the app header. Together, we’re shaping the future of field service management.


Recent Comments