This article is contributed. See the original author and article here.
Power Platform and Low Code are a fast-growing practice area for many partners and we want to hear from you about how you are building and expanding this practice and the type of services you offer, so that we can share back broad trends and insights with the partner community.
We are currently conducting a survey to identify and define the value partners realize through their relationship with Microsoft and Power Platform. This research is being done by IDC’s Channels and Alliances Research Group on behalf of Microsoft. Please use this link to take the survey: https://aka.ms/PowerPartnerProfitabilitySurvey. It takes approximately 10-15 minutes and we recommend that it is completed by your Power Platform practice lead. The questions included are related to Microsoft and Power Platform revenue growth, profit across resale, services and/or software, investments in your Power Platform practice, and Microsoft activities/programs that drive success.
We’re interested in learning about your practice development and the profitability of your Power Platform business. The information you provide will be aggregated and used in an IDC eBook, and will help Microsoft improve its partner strategy and programs related to Power Platform.
This article is contributed. See the original author and article here.
Learn how the upcoming 2024 release wave 1 will enable you to track and report your greenhouse gas emissions with ease and accuracy.
Sustainability is more than a buzzword. It’s a global imperative that demands urgent action from all sectors of society, including the business world. As regulations and expectations around environmental reporting evolve, organizations need reliable and efficient tools to measure and manage their impact on the planet.
That’s why we’re excited to announce that Dynamics 365 Business Central will soon offer new sustainability features that will help you comply with the latest standards and best practices, as well as drive positive changes for your business and the environment. Starting from the 2024 release wave 1, you’ll be able to track and report your greenhouse gas (GHG) emissions across three scopes defined by the ESG standard, using sustainability journals and built-in calculation methods. You’ll also be able to leverage the new Chart of Sustainability Accounts to organize and analyze your emission data with ease and transparency.
The new functionality is designed to oversee and regulate an organization’s environmental footprint by tracking various greenhouse gas (GHG) emissions, facilitating proper insights. This functionality will be a multi-wave investment and at this first release we delivered basic framework as a foundation for future expanding. The first version focuses on GHG emissions, and related to that the solution is focused on three emission scopes defined by the ESG standard. This feature supports the basic process of collecting emission data via sustainability journals, allowing for manual entry of known data, or utilizing built-in methods for calculating emissions footprints.
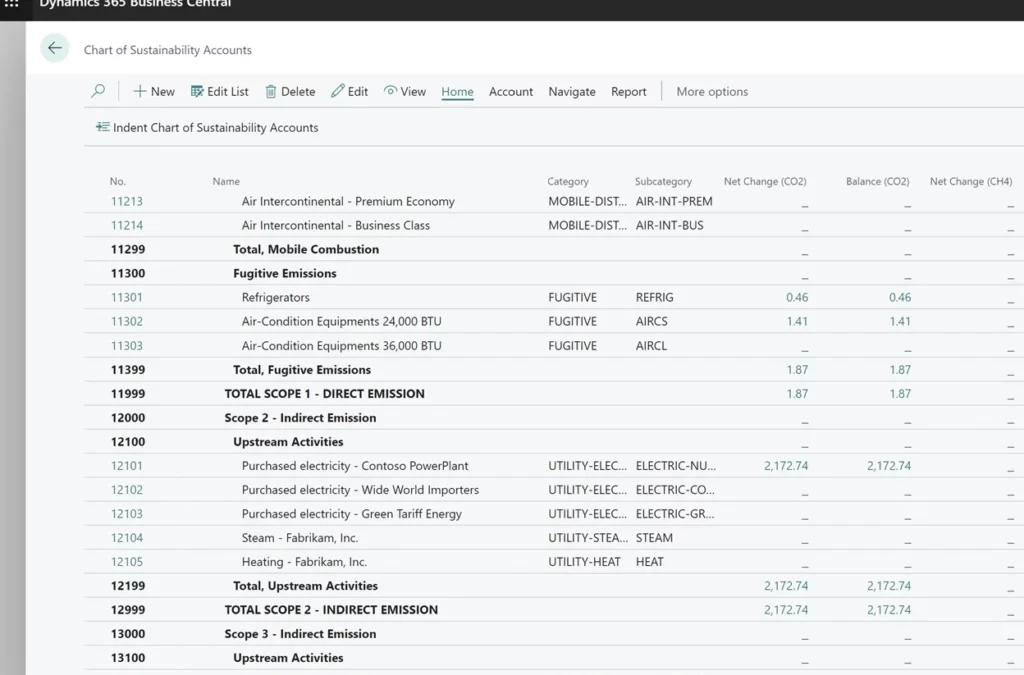
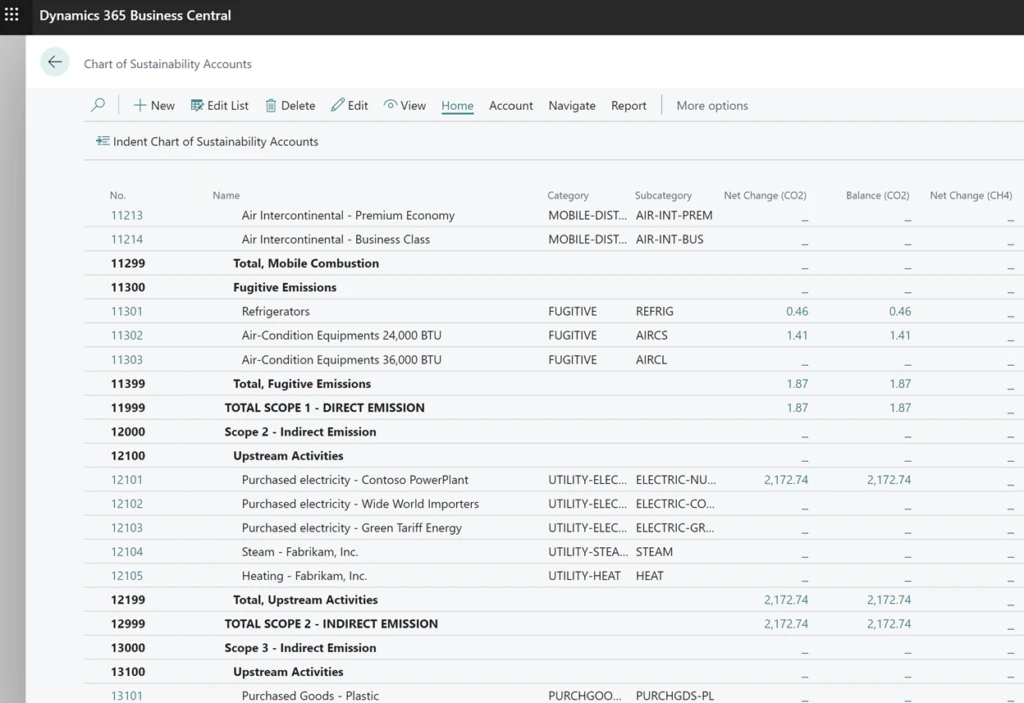
Chart of Sustainability Accounts
The Chart of Sustainability Accounts forms the foundational structured list used for recording all emissions data. It functions as a comprehensive framework that categorizes and organizes these accounts based on their attributes, such as scope or other groupings. Each account is typically assigned a unique code or number for easy reference and tracking, following the same structure as a traditional Chart of Accounts but customized specifically for monitoring sustainability-related data and metrics within an organization.
This chart typically encompasses categories such as energy consumption, greenhouse gas emissions, waste generation, and other pertinent sustainability metrics. Users have the flexibility to add Account Categories and Subcategories to define how the system behaves, selecting dedicated emissions for tracking, emission factors, formulas, and similar configurations.
In essence, the Chart of Sustainability Accounts serves as the backbone of the Sustainability feature, facilitating effective tracking, measurement, and management of sustainability-related data and metrics within the organization.
Chart of Sustainability Accounts
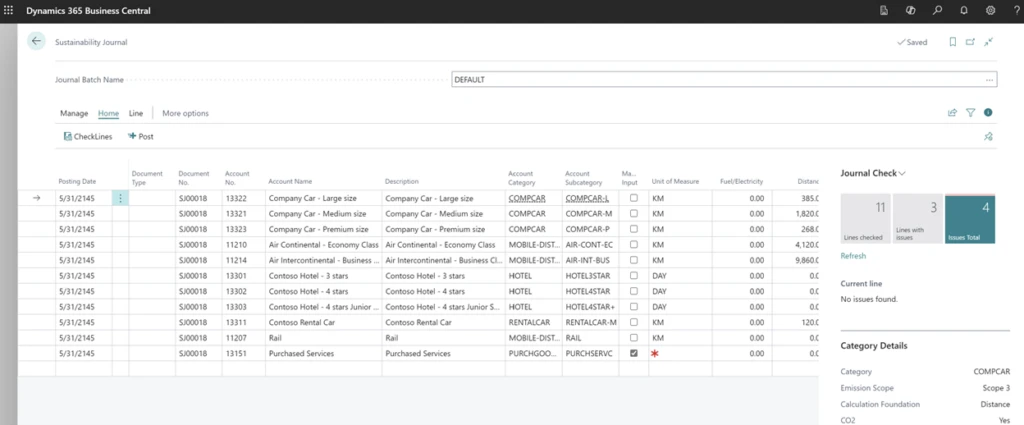
Sustainability Journals
Sustainability Journals are designed to track and record sustainability-related activities, and metrics within an organization, using the same user experience as other journals in Business Central. Within the journal, users have the option to input emissions manually if they possess the necessary information. Alternatively, if they lack this data, they can utilize built-in formulas to accurately calculate emissions based on specific known parameters corresponding to various types of sources and accounts.
When posting with a Sustainability Journal, entries are generated on the Sustainability Ledger. Similar to other journal types, users have the flexibility to utilize various templates and batches with specific configurations. They can opt for standard journals or recurring journals to manage sustainability data efficiently.
Sustainability Journal
Sustainability Entries
The Sustainability Ledger organizes all emission data according to the Chart of Sustainability Accounts. When a user posts the Sustainability Journal, all crucial data is recorded within the Sustainability Entries. Posting to these entries can be regulated by specific rules configured in the Sustainability Setup, and users can use dimensions in a manner consistent with other entries throughout Business Central. All reports are generated based on Sustainability Entries. Presently, there are several existing reports available for analyzing and tracking emissions. However, in future releases, Business Central will introduce additional reports for printing or submission to relevant authorities.
Future Development
As mentioned in the introduction, Microsoft will continue to enhance this feature by adding more horizontal capabilities and improving its connection with other features in Business Central, without focusing on industry-specific aspects. The development of new features will depend on research of the key elements for such solutions, compliance with regulatory requirements, and useful feedback from partners. Also, it is expected that ISV partners will use this basic framework to create industry-specific sustainability solutions.
This article is contributed. See the original author and article here.
Let’s say you work for a company that has a lot of APIs. You might have a few questions:
How do you manage the lifecycle of those APIs?
What governance would you apply to these APIs?
What is the list of environments needed to manage these APIs?
What are the deployment strategies for those APIs?
How would you integrate those APIs with other services?
As your company’s number of APIs increases, so does the complexity of managing them. Azure API Center (APIC) is a central repository for your APIs lifecycle management, and it offers the more efficient ways for management. Throughout this post, I will take a first look at what Azure API Center is and what it offers.
I’m not going to discuss how to provision an APIC instance in this article. But here’s the reference you can do it by yourself through Bicep – Azure API Center Sample
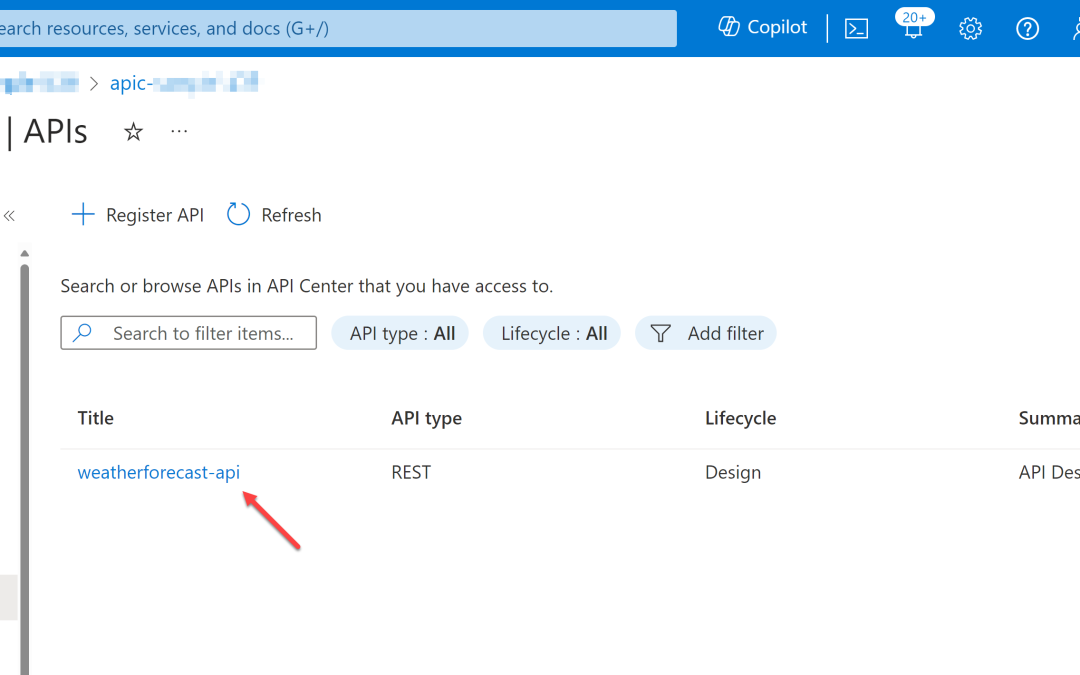
Register APIs to APIC
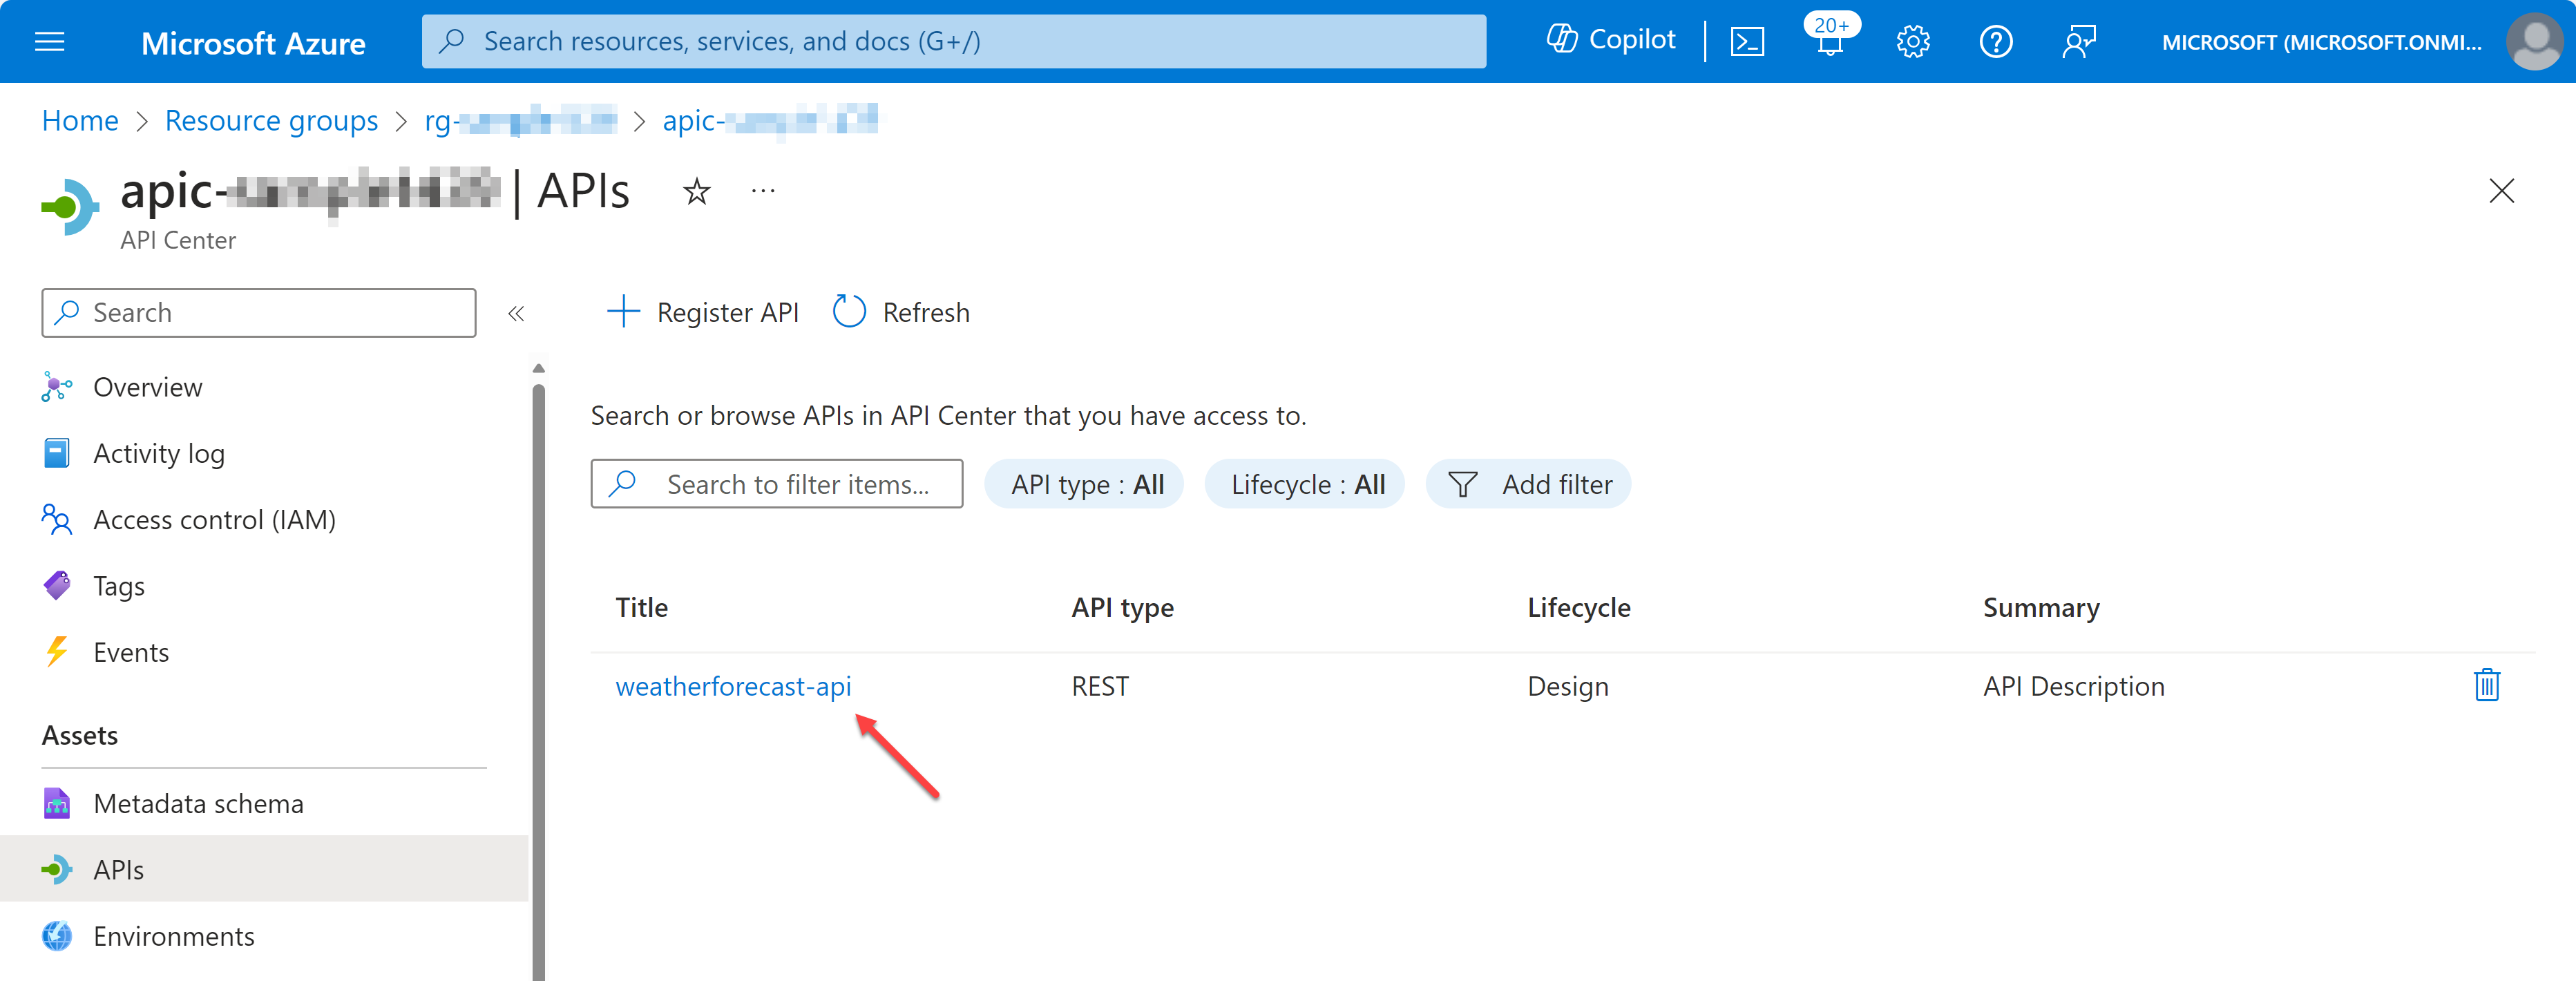
The purpose of using APIC is to manage your company’s APIs in a centralised manner. From design to deployment, APIC tracks all the histories. To register your APIs to APIC, you can use either Azure CLI or Azure Portal.
Let’s say there’s a weather forecast API you have designed and developed. You have an OpenAPI document for the API, but not implemented yet. Let’s register the API to APIC.
az apic api register
    -g "my-resource-group"
    -s "my-api-center"
    --api-location ./weather-forecast.json
If you want to register another API through the Azure Portal, you can do it by following the official documentation.
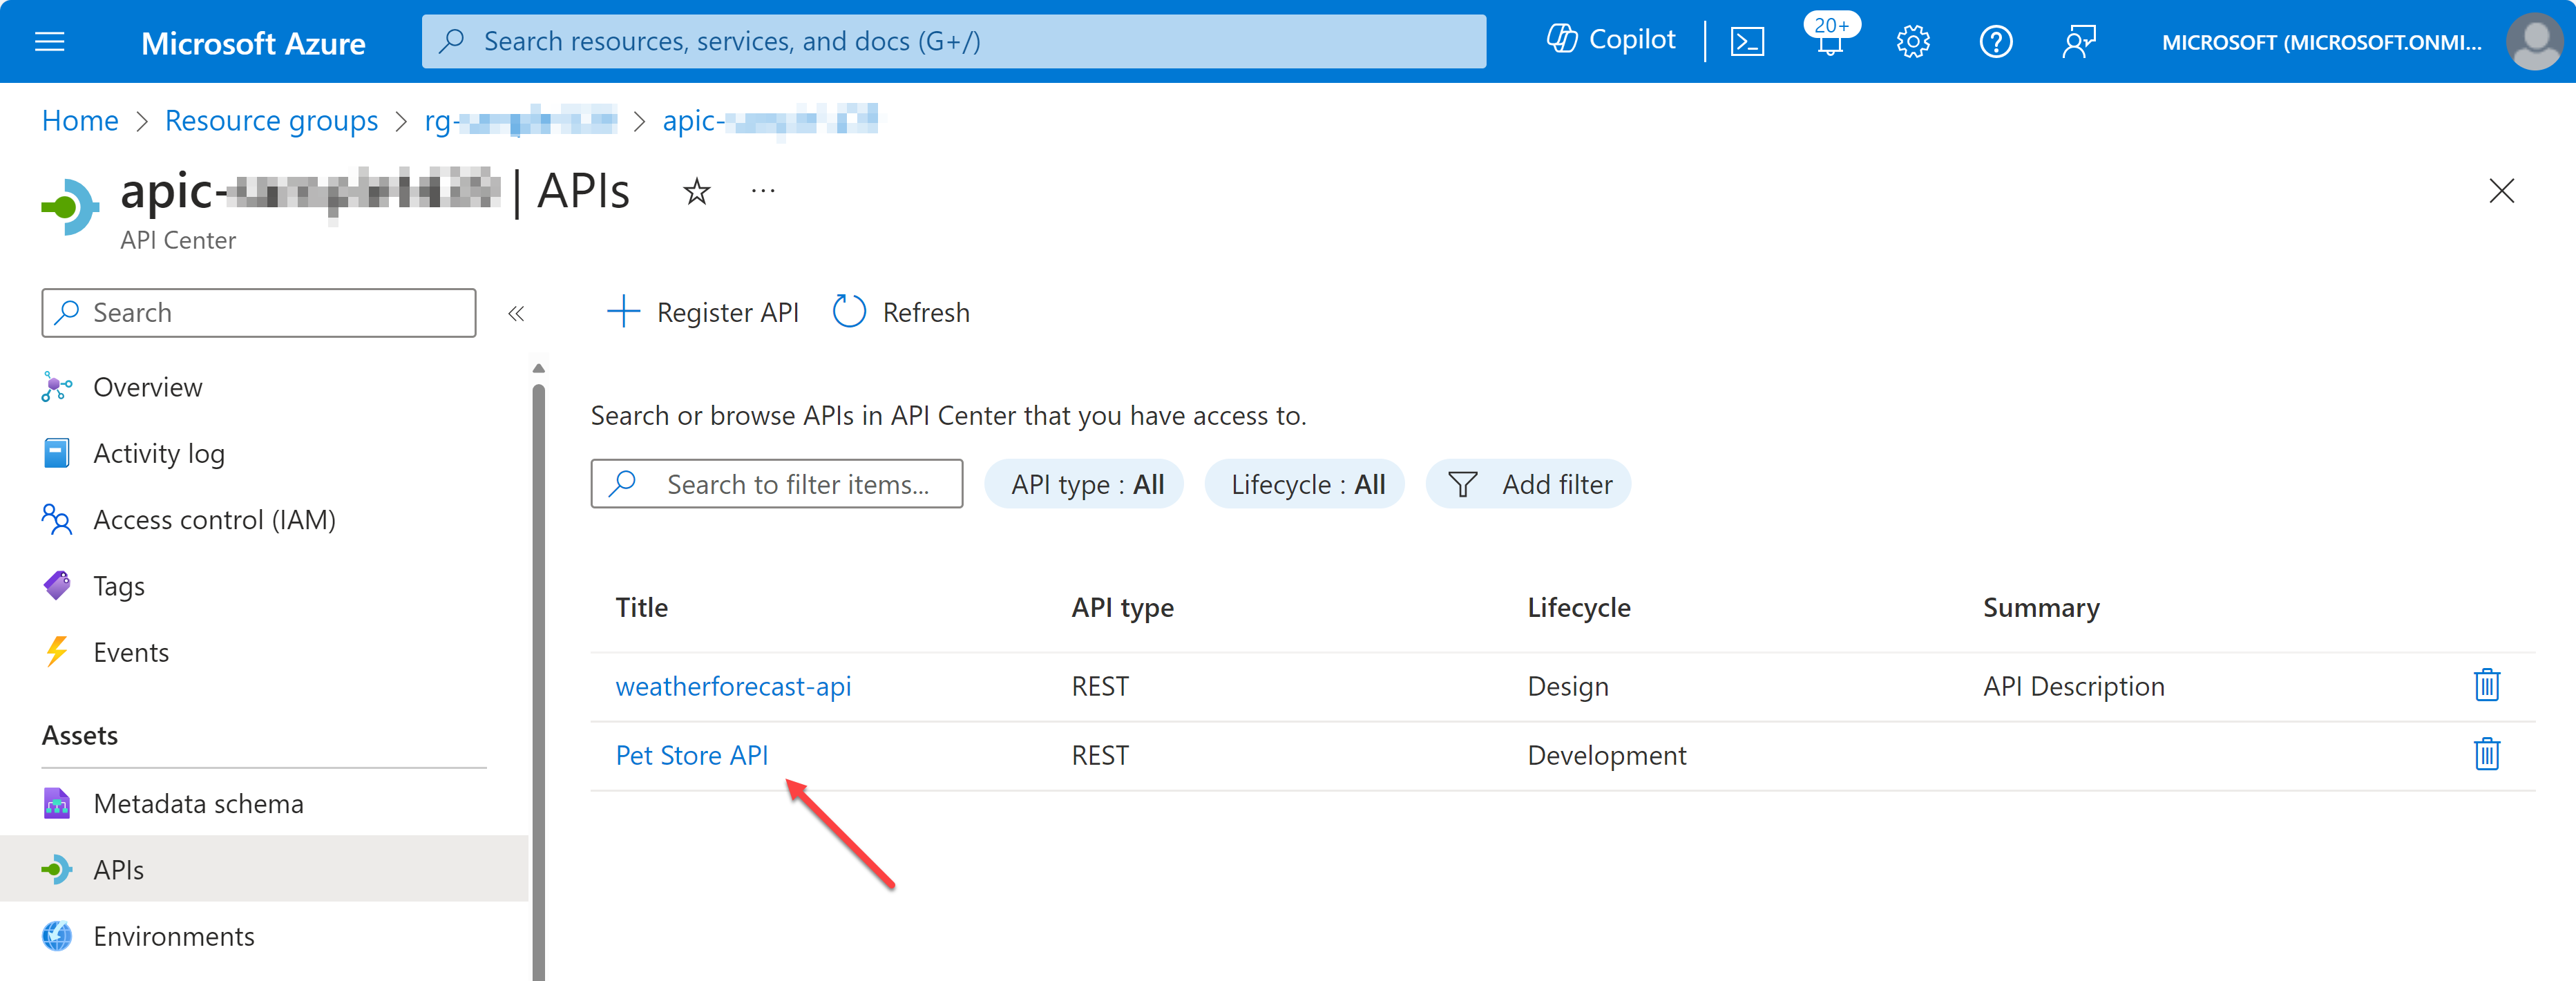
Import APIs from API Management to APIC
If you have already working APIs in Azure API Management (APIM), you can import them to APIC through Azure CLI. But it requires a few more steps to do so.
First of all, you need to activate Managed Identity to the APIC instance. It can be either system identity or user identity, but I’m going to use the system identity for now.
az apic service update
    -g "my-resource-group"
    -s "my-api-center"
    --identity '{ "type": "SystemAssigned" }'
Then, get the principal ID of the APIC instance.
APIC_PRINCIPAL_ID=$(az apic service show
    -g "my-resource-group"
    -s "my-api-center"
    --query "identity.principalId" -o tsv)
Now, register the APIC instance to the APIM instance as an APIM reader.
APIM_RESOURCE_ID=$(az apim show
    -g "my-resource-group"
    -s "my-api-center"
    --query "id" -o tsv)

az role assignment create
    --role "API Management Service Reader Role"
    --assignee-object-id $APIC_PRINCIPAL_ID
    --assignee-principal-type ServicePrincipal
    --scope $APIM_RESOURCE_ID
And finally, import APIs from APIM to APIC.
az apic service import-from-apim
    -g "my-resource-group"
    -s "my-api-center"
    --source-resource-ids "$APIM_RESOURCE_ID/apis/*"
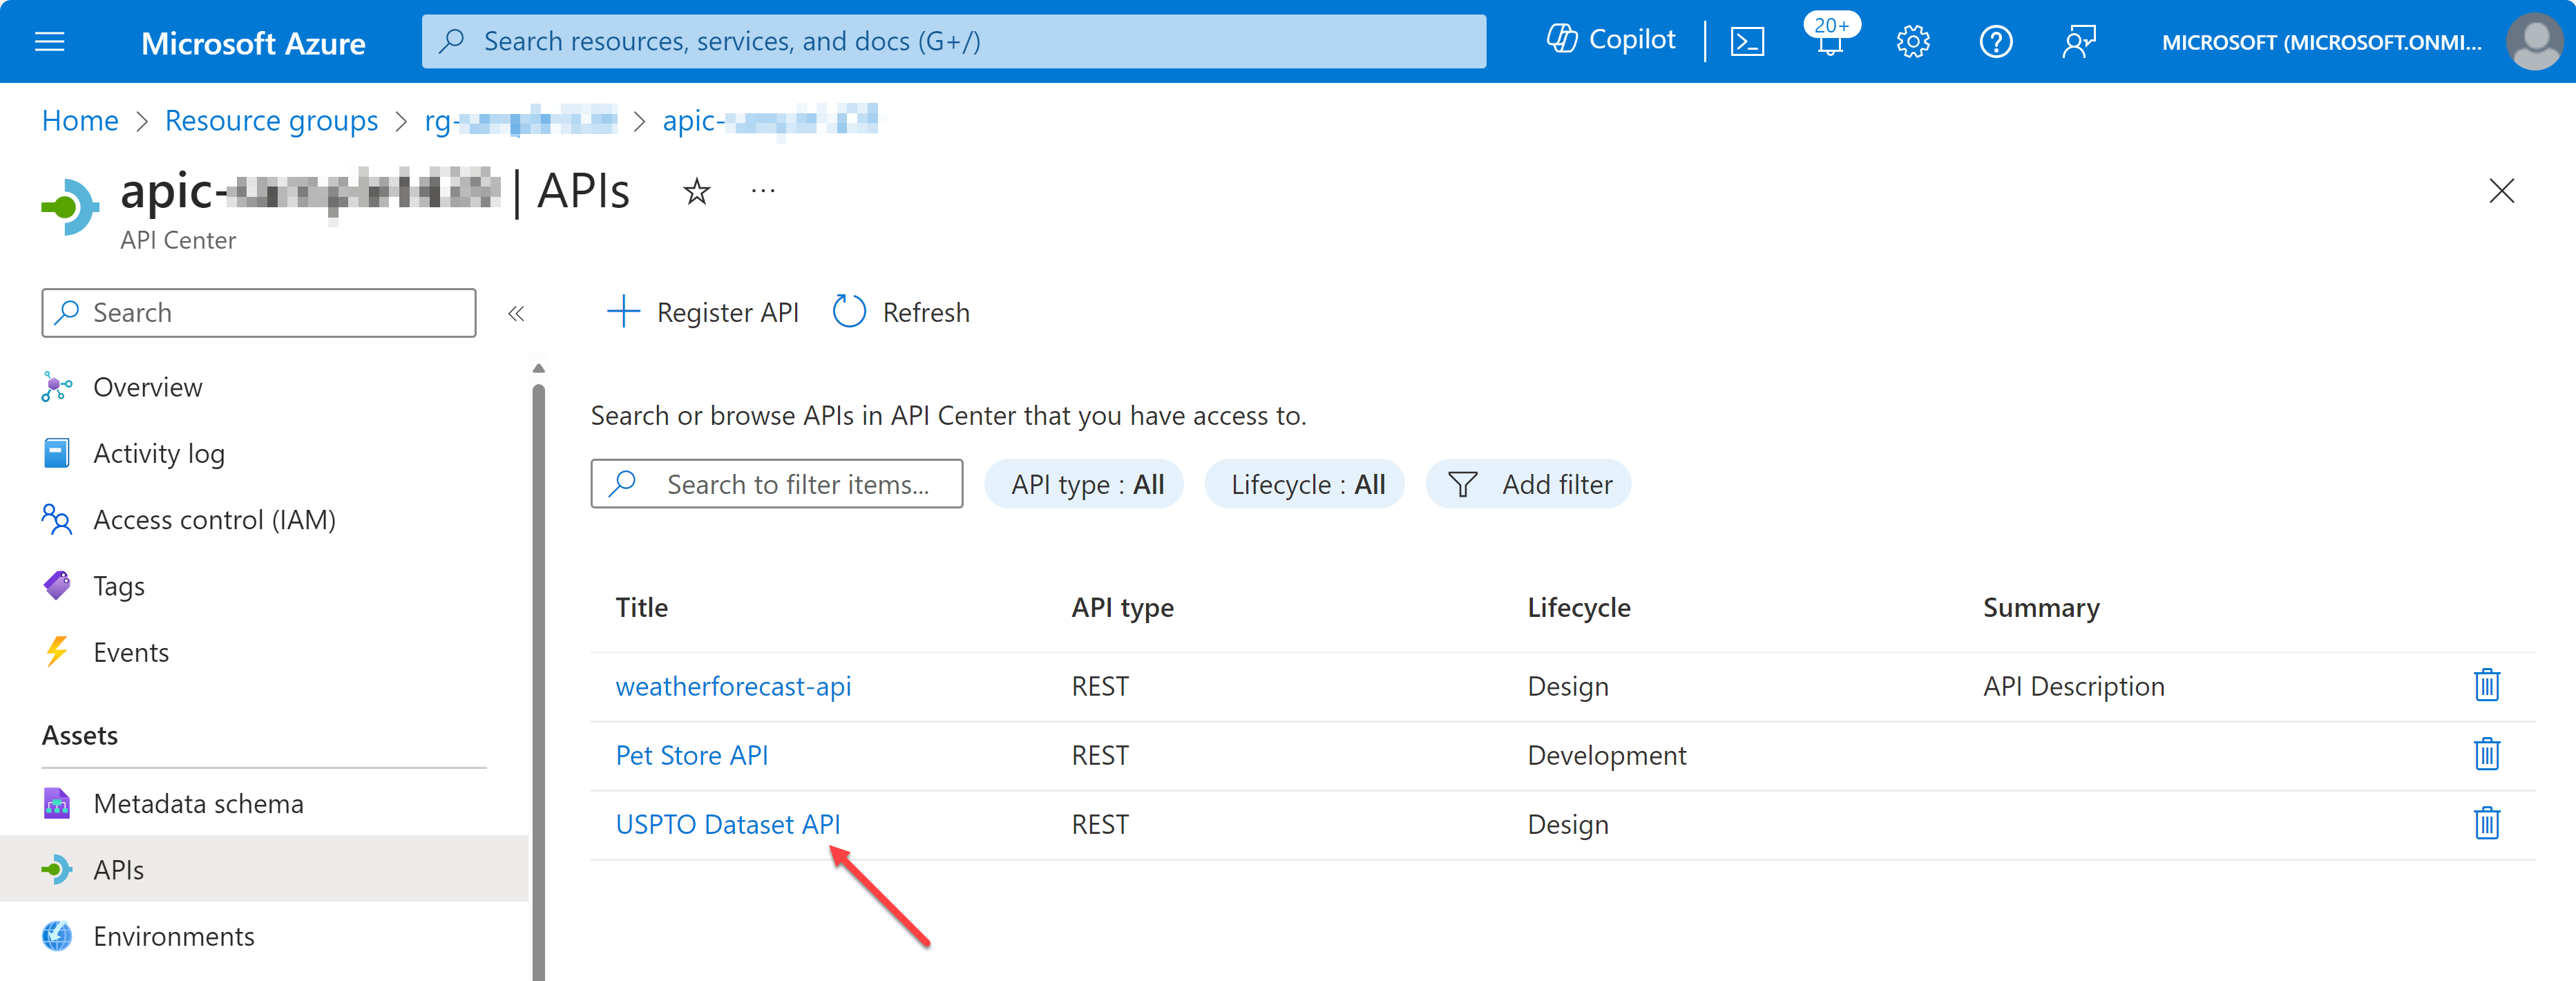
Now, you have registered and imported APIs to APIC. But registering those APIs to APIC does nothing to do with us. What’s next then? Let’s play around those APIs on Visual Studio Code.
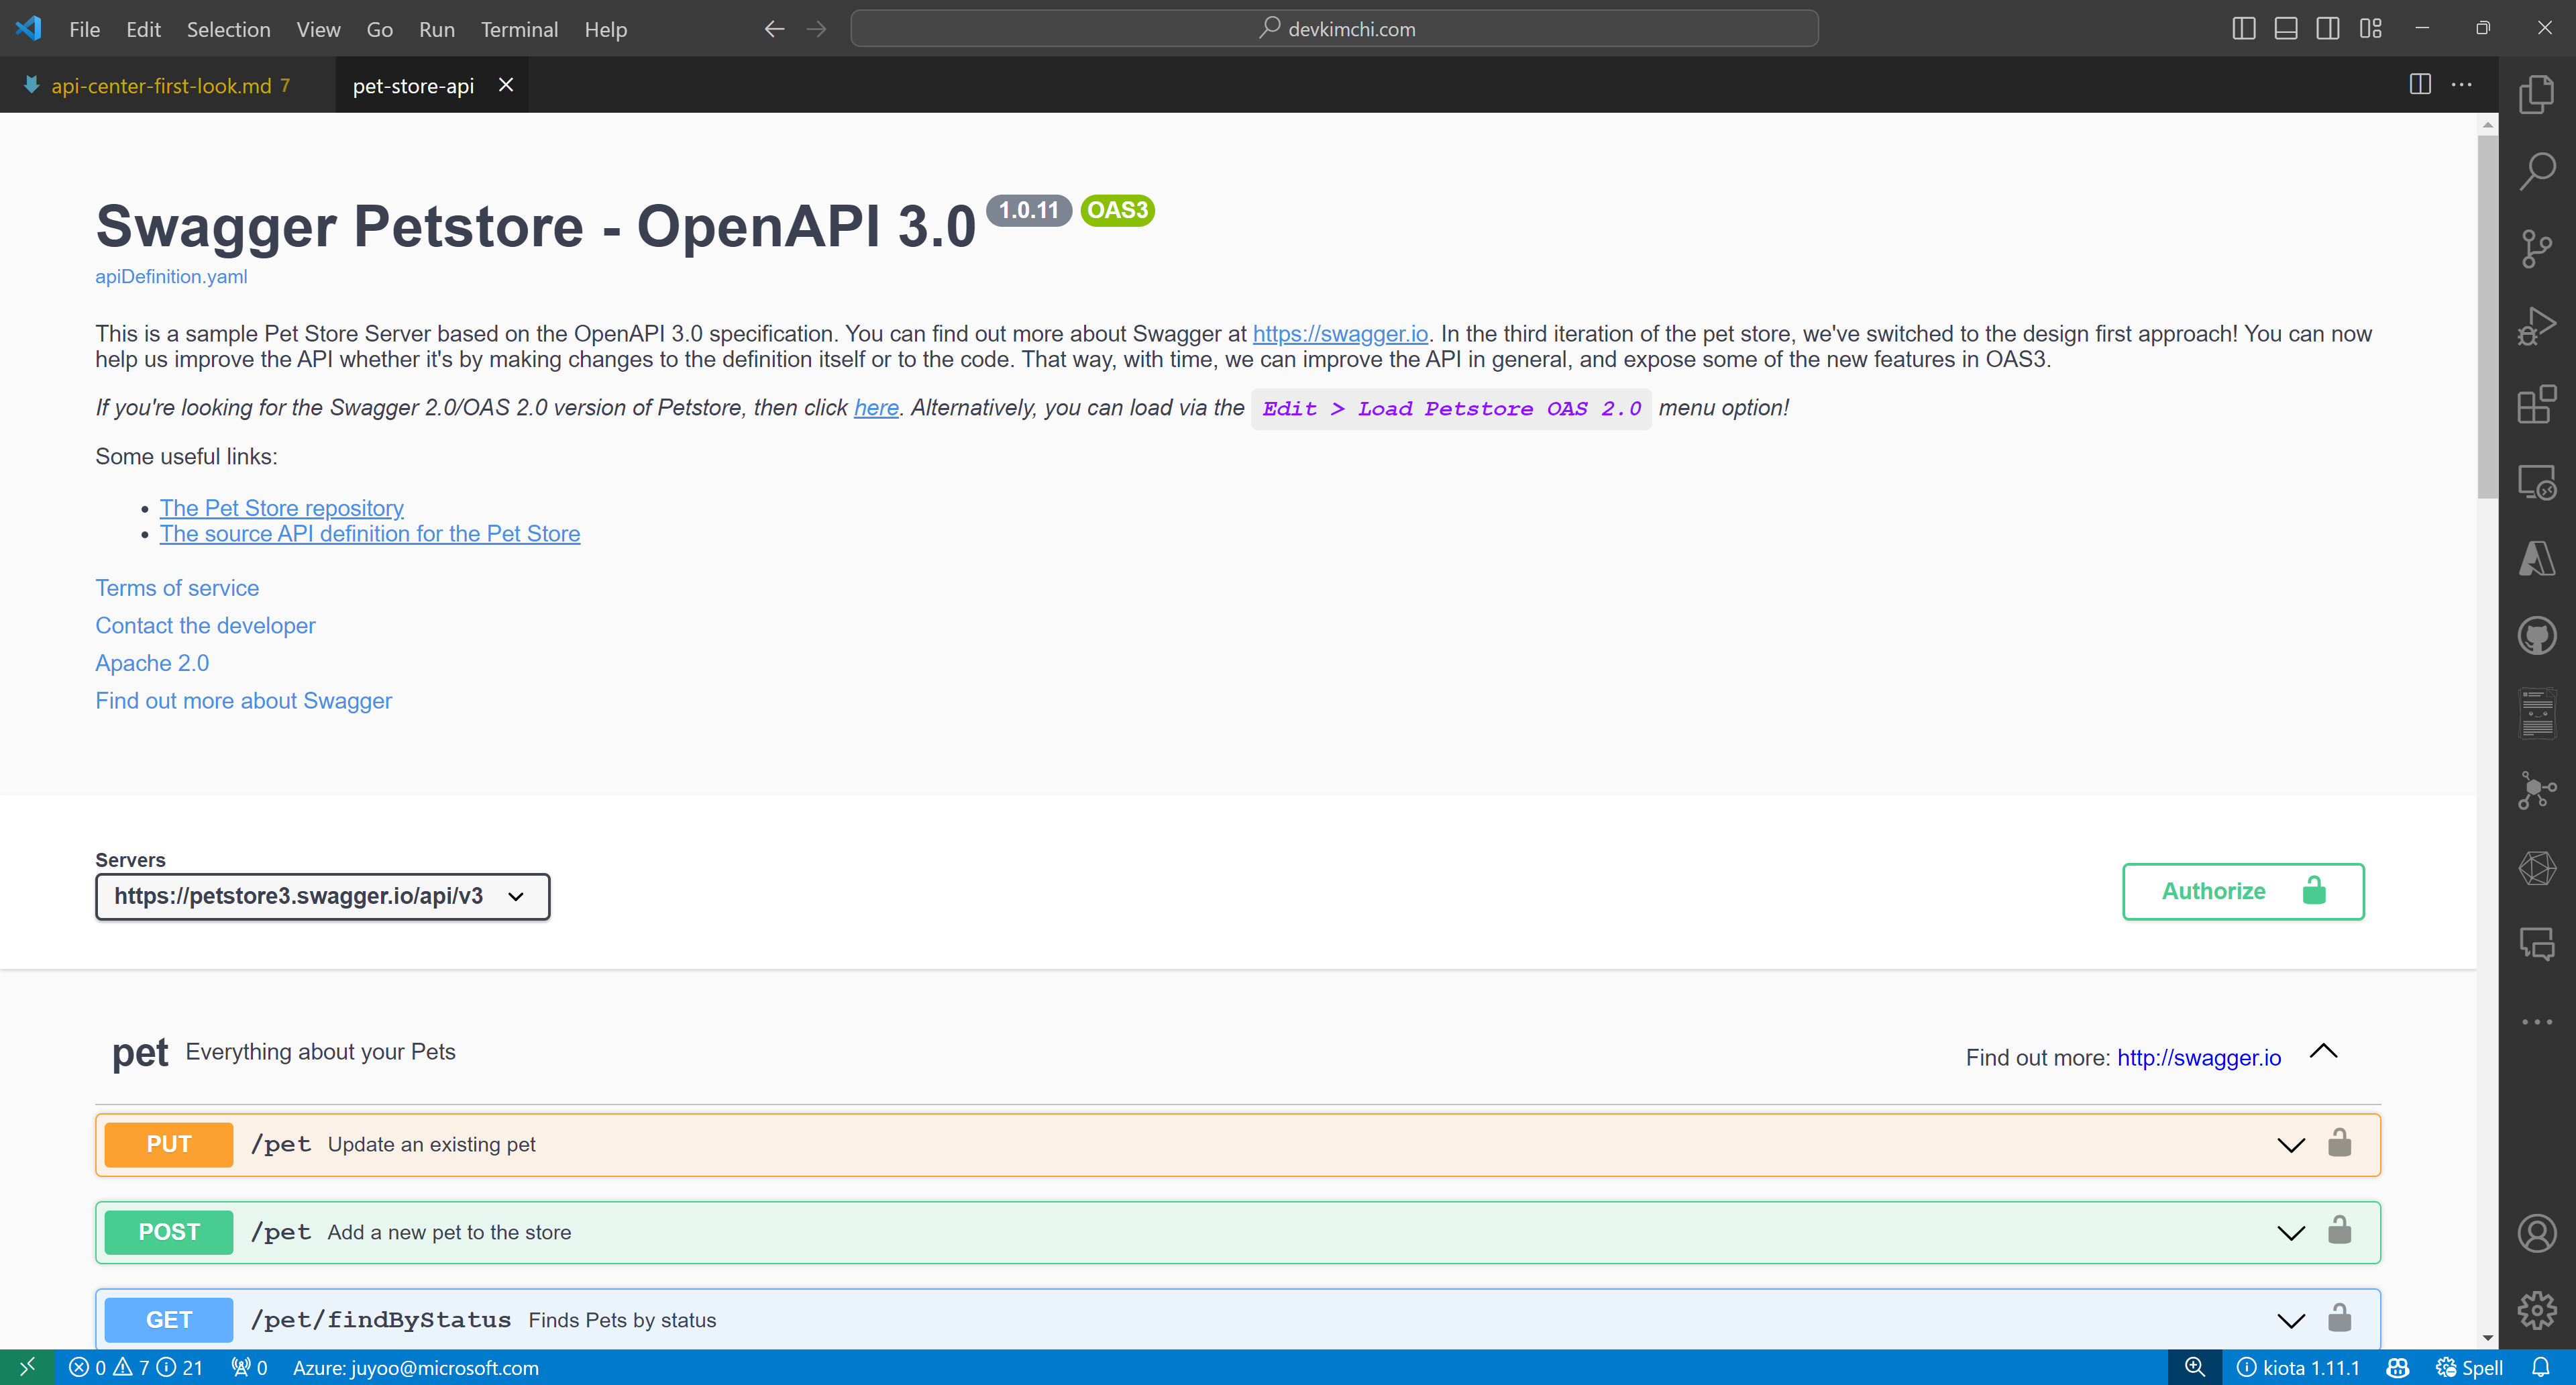
View APIs on Visual Studio Code – Swagger UI
So, what can you do with the APIs registered and imported to APIC? You can view the list of APIs on Visual Studio Code. First, you need to install the Azure API Center extension on Visual Studio Code.
Once you install the extension, you can see the list of APIs on the extension. Choose one of the APIs and right-click on it. Then, you can see the context menu. Click on the Open API Documentation menu item.
You will see the Swagger UI page, showing your API document. With this Swagger UI, you can test your API endpoints.
Test APIs on Visual Studio Code – Rest Client
Although you can test your API endpoints on the Swagger UI, you can also test them in a different way. For this, you need to install the Rest Client extension on Visual Studio Code.
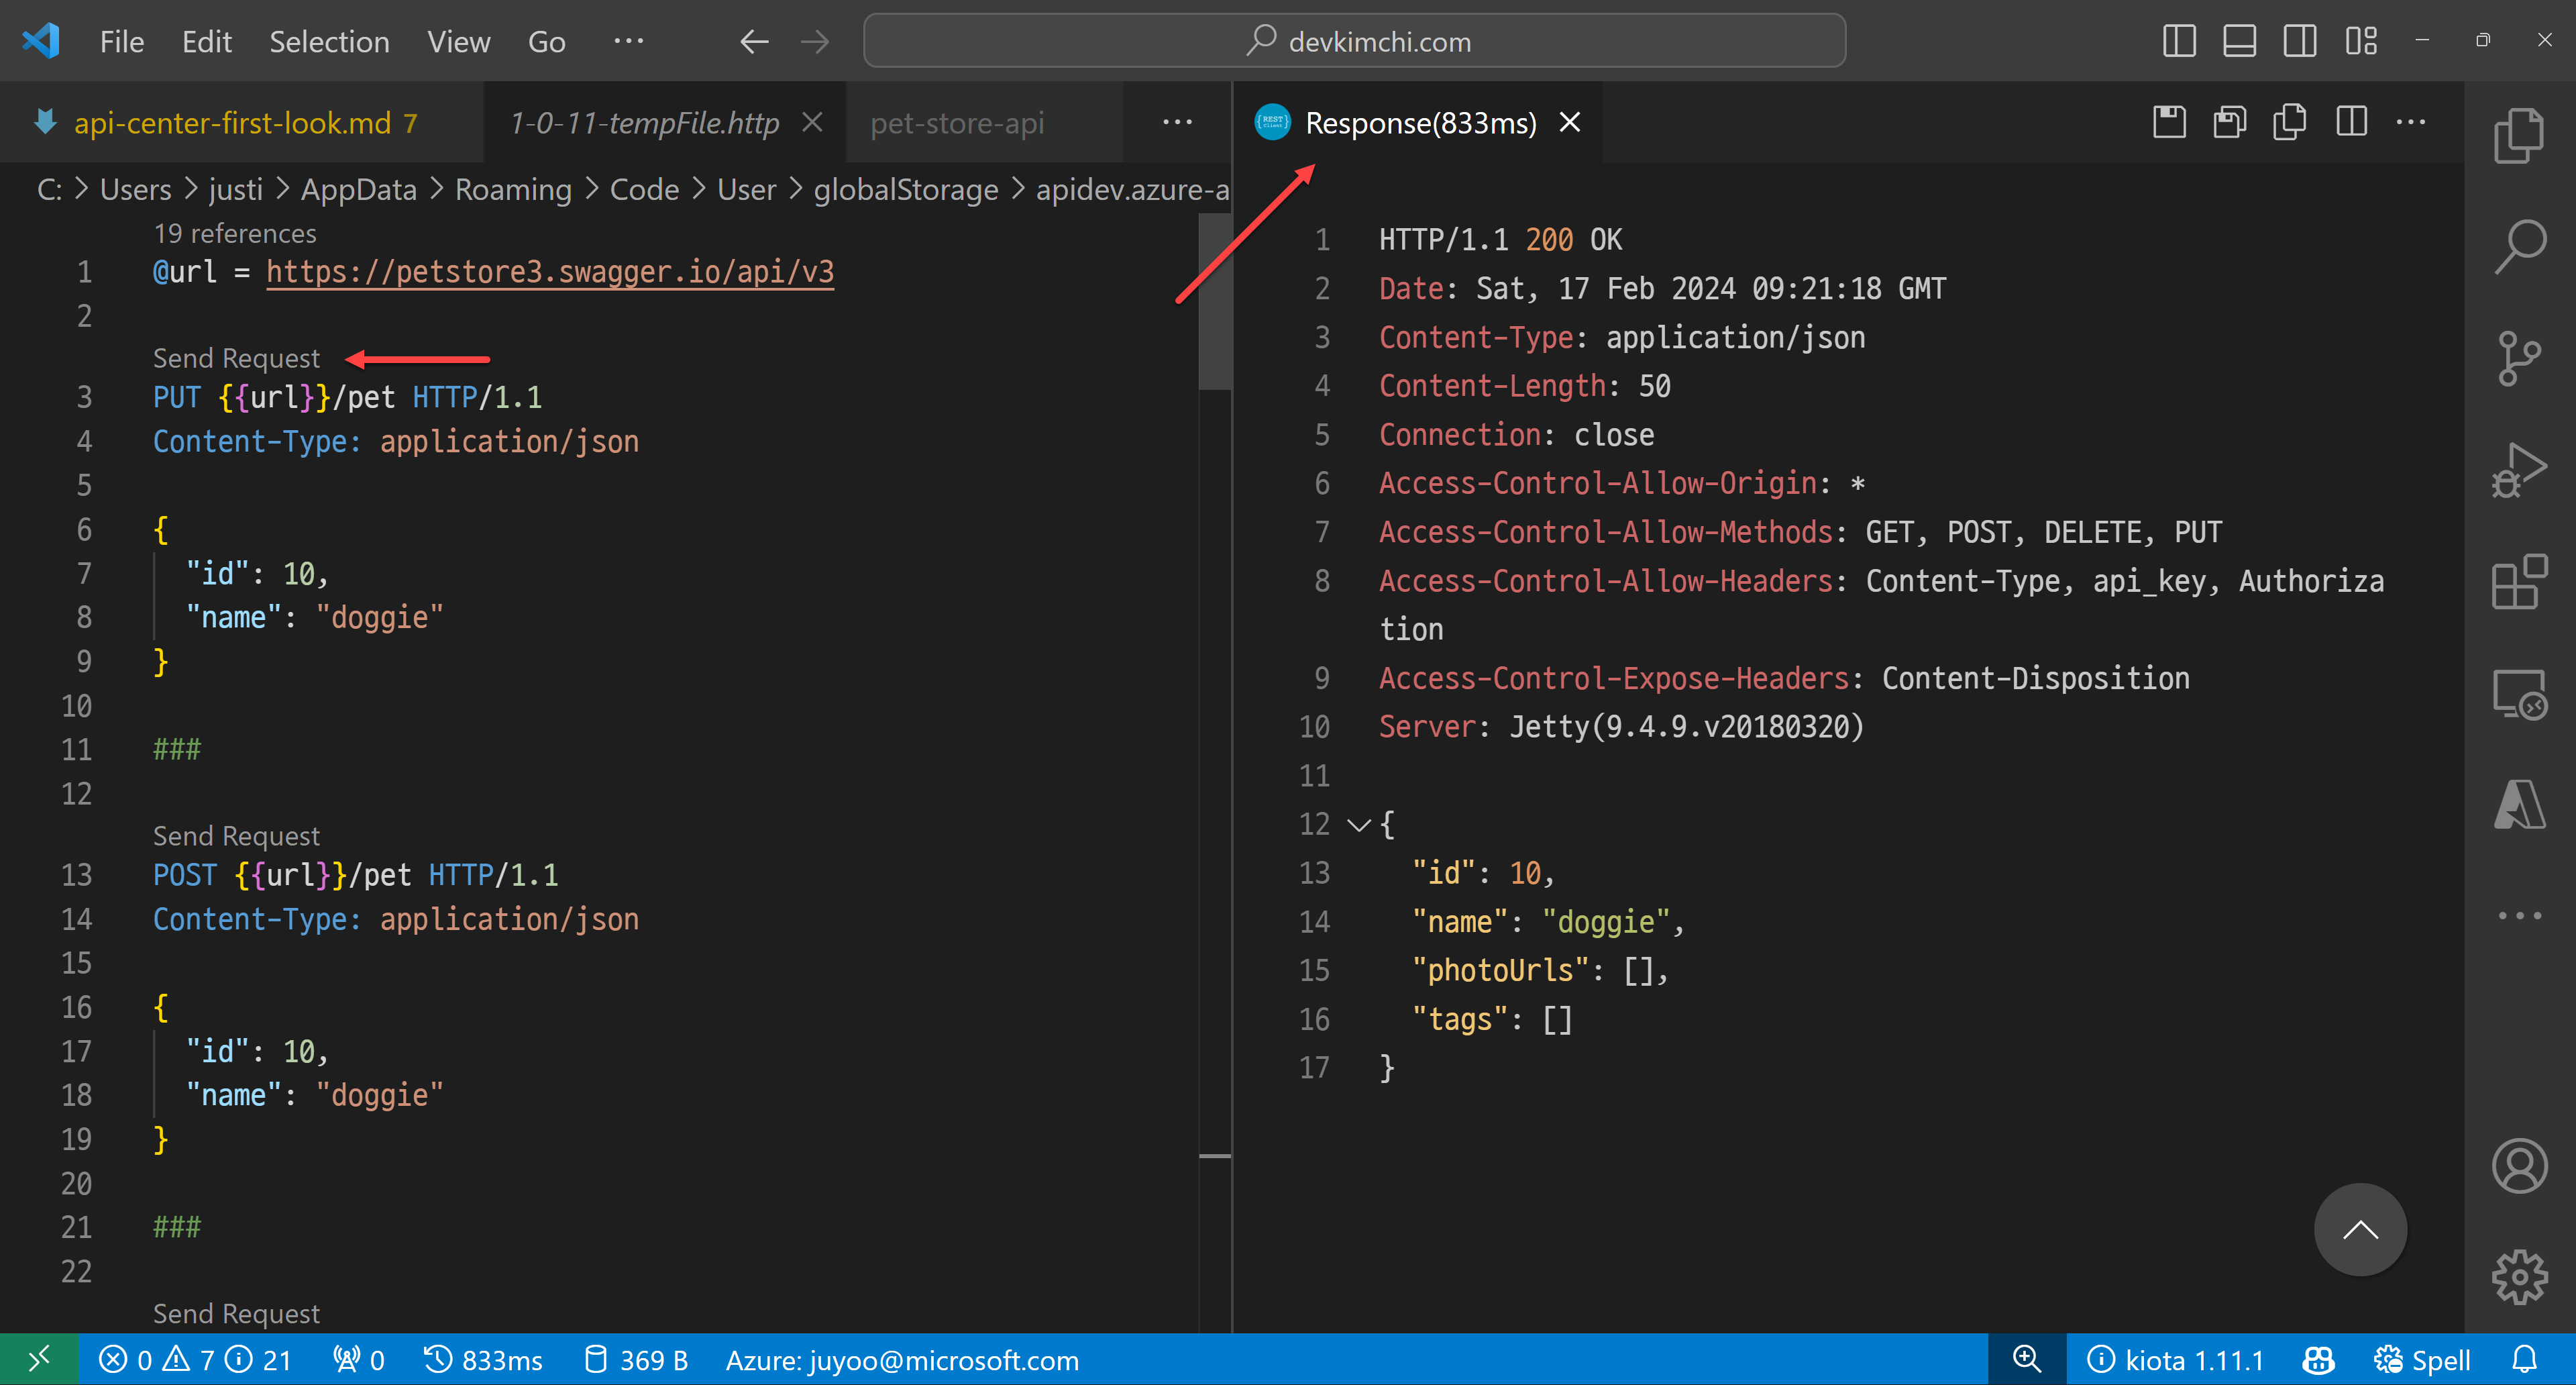
After you install the extension, choose one of the APIs and right-click on it. Then, you can see the context menu. Click on the Generate HTTP File menu item.
Within the HTTP file, you can actually test your API endpoints with different payloads.
Generate client SDK on Visual Studio Code – Kiota
You can write up the client SDK by yourself. But it’s time consuming and fragile because the API can change at any time. But what if somebody or a tool creates the client SDK on your behalf?
One of the greatest features of this APIC extension offers is to generate client SDKs. You can generate the client SDKs for your APIs in different languages. Although the API itself has no implementation yet, you can still work with the client SDK because you know what you need to send and what you will receive in return through the SDK. For this, you need to install the Kiota extension on Visual Studio Code.
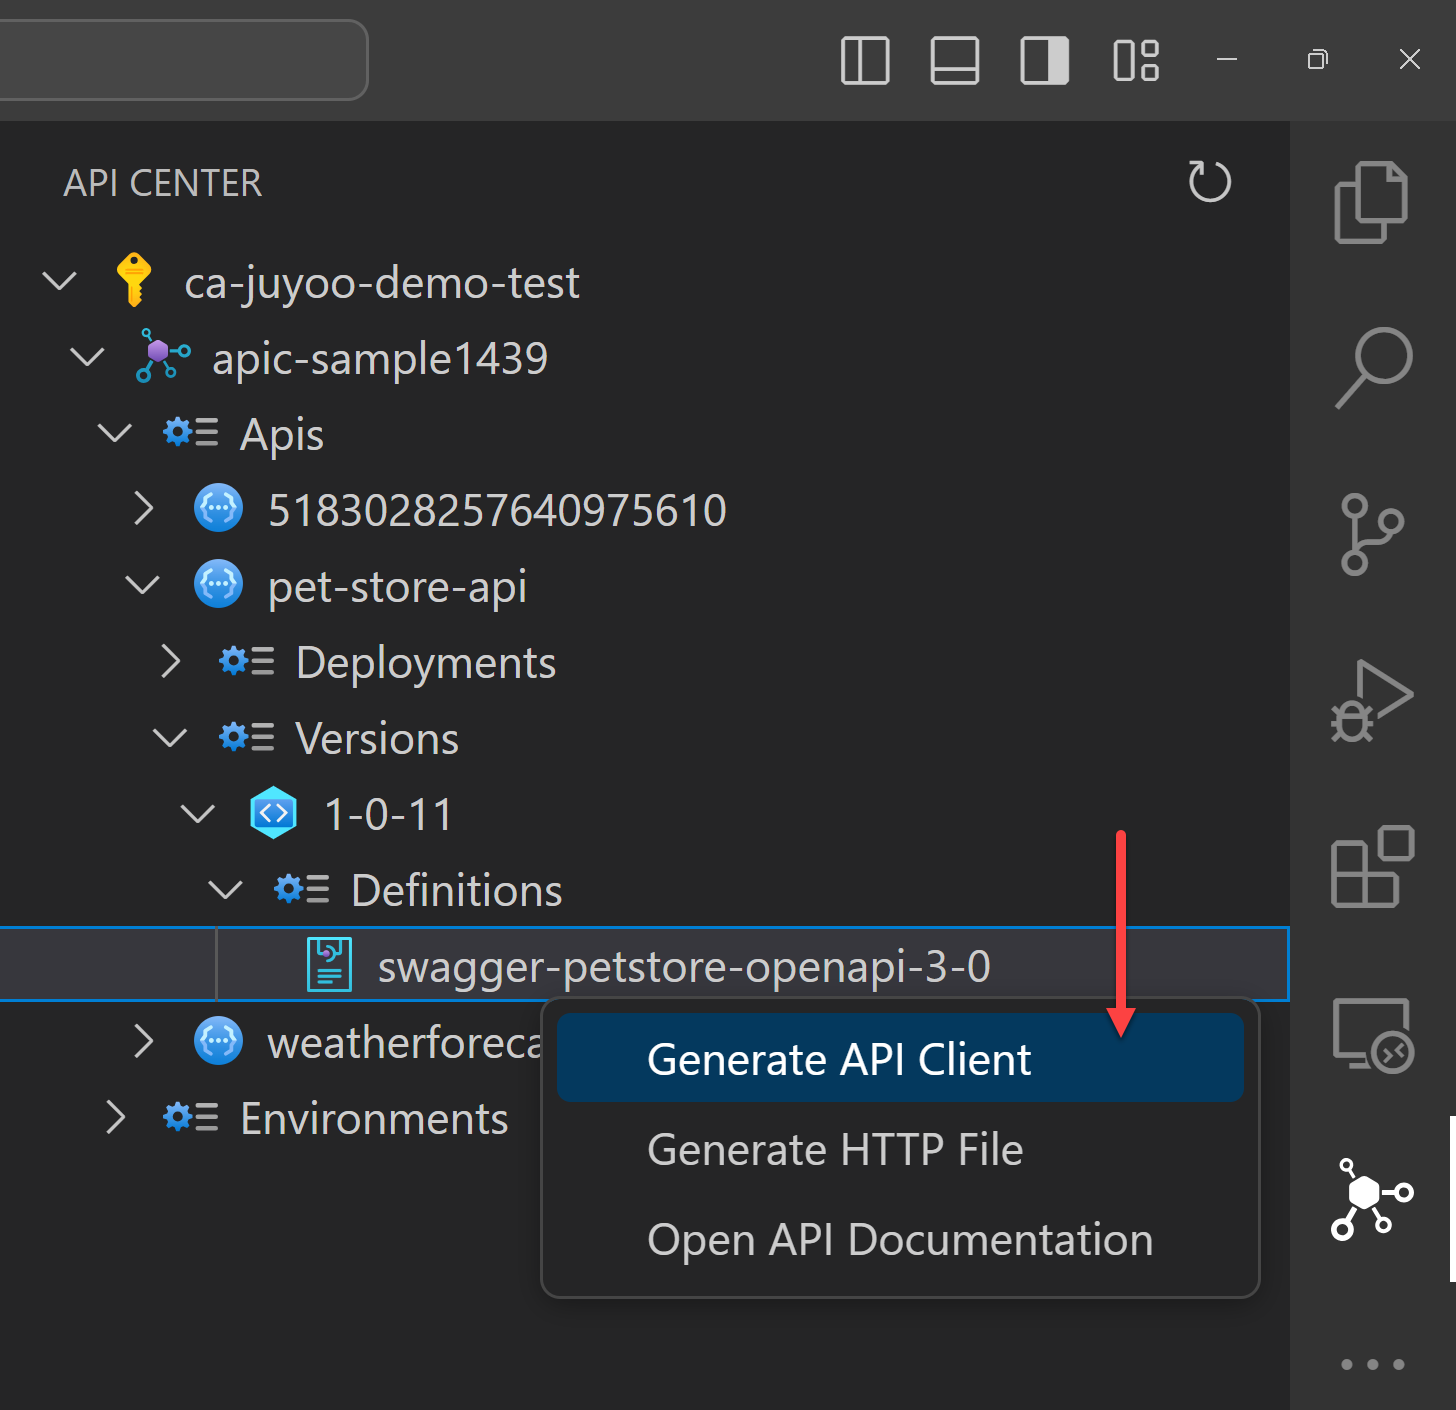
After you install the extension, choose one of the APIs and right-click on it. Then, you can see the context menu. Click on the Generate API Client menu item.
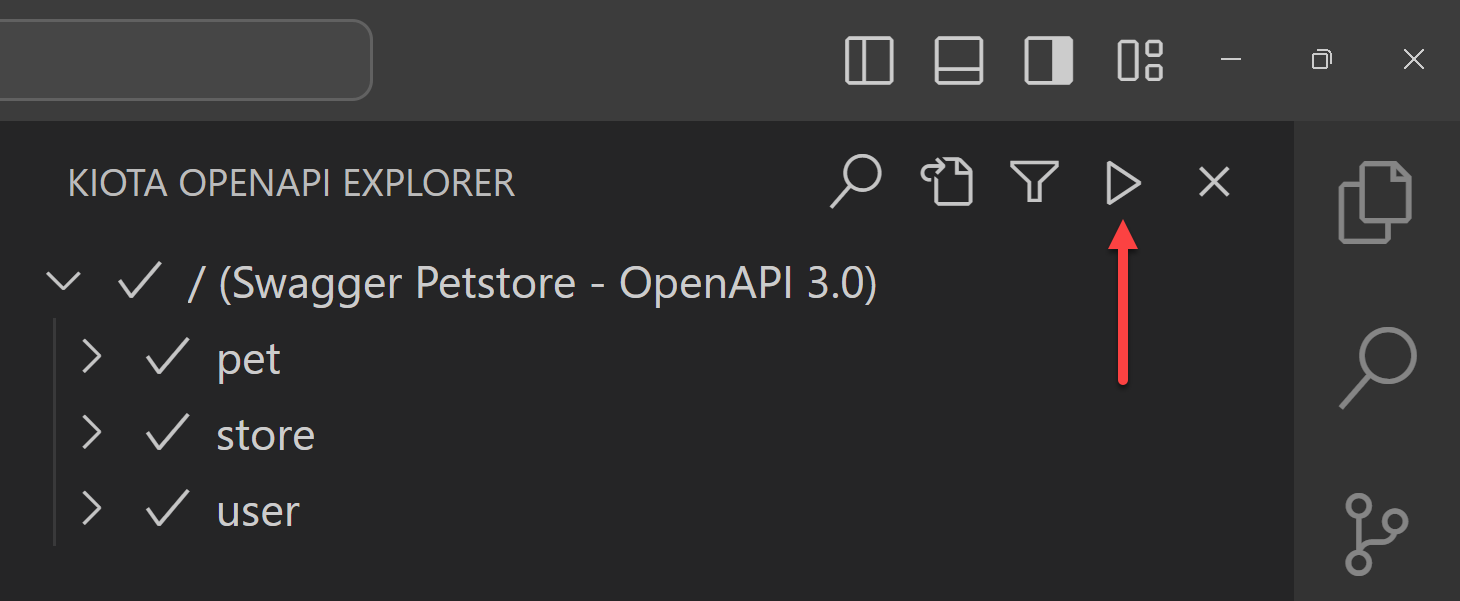
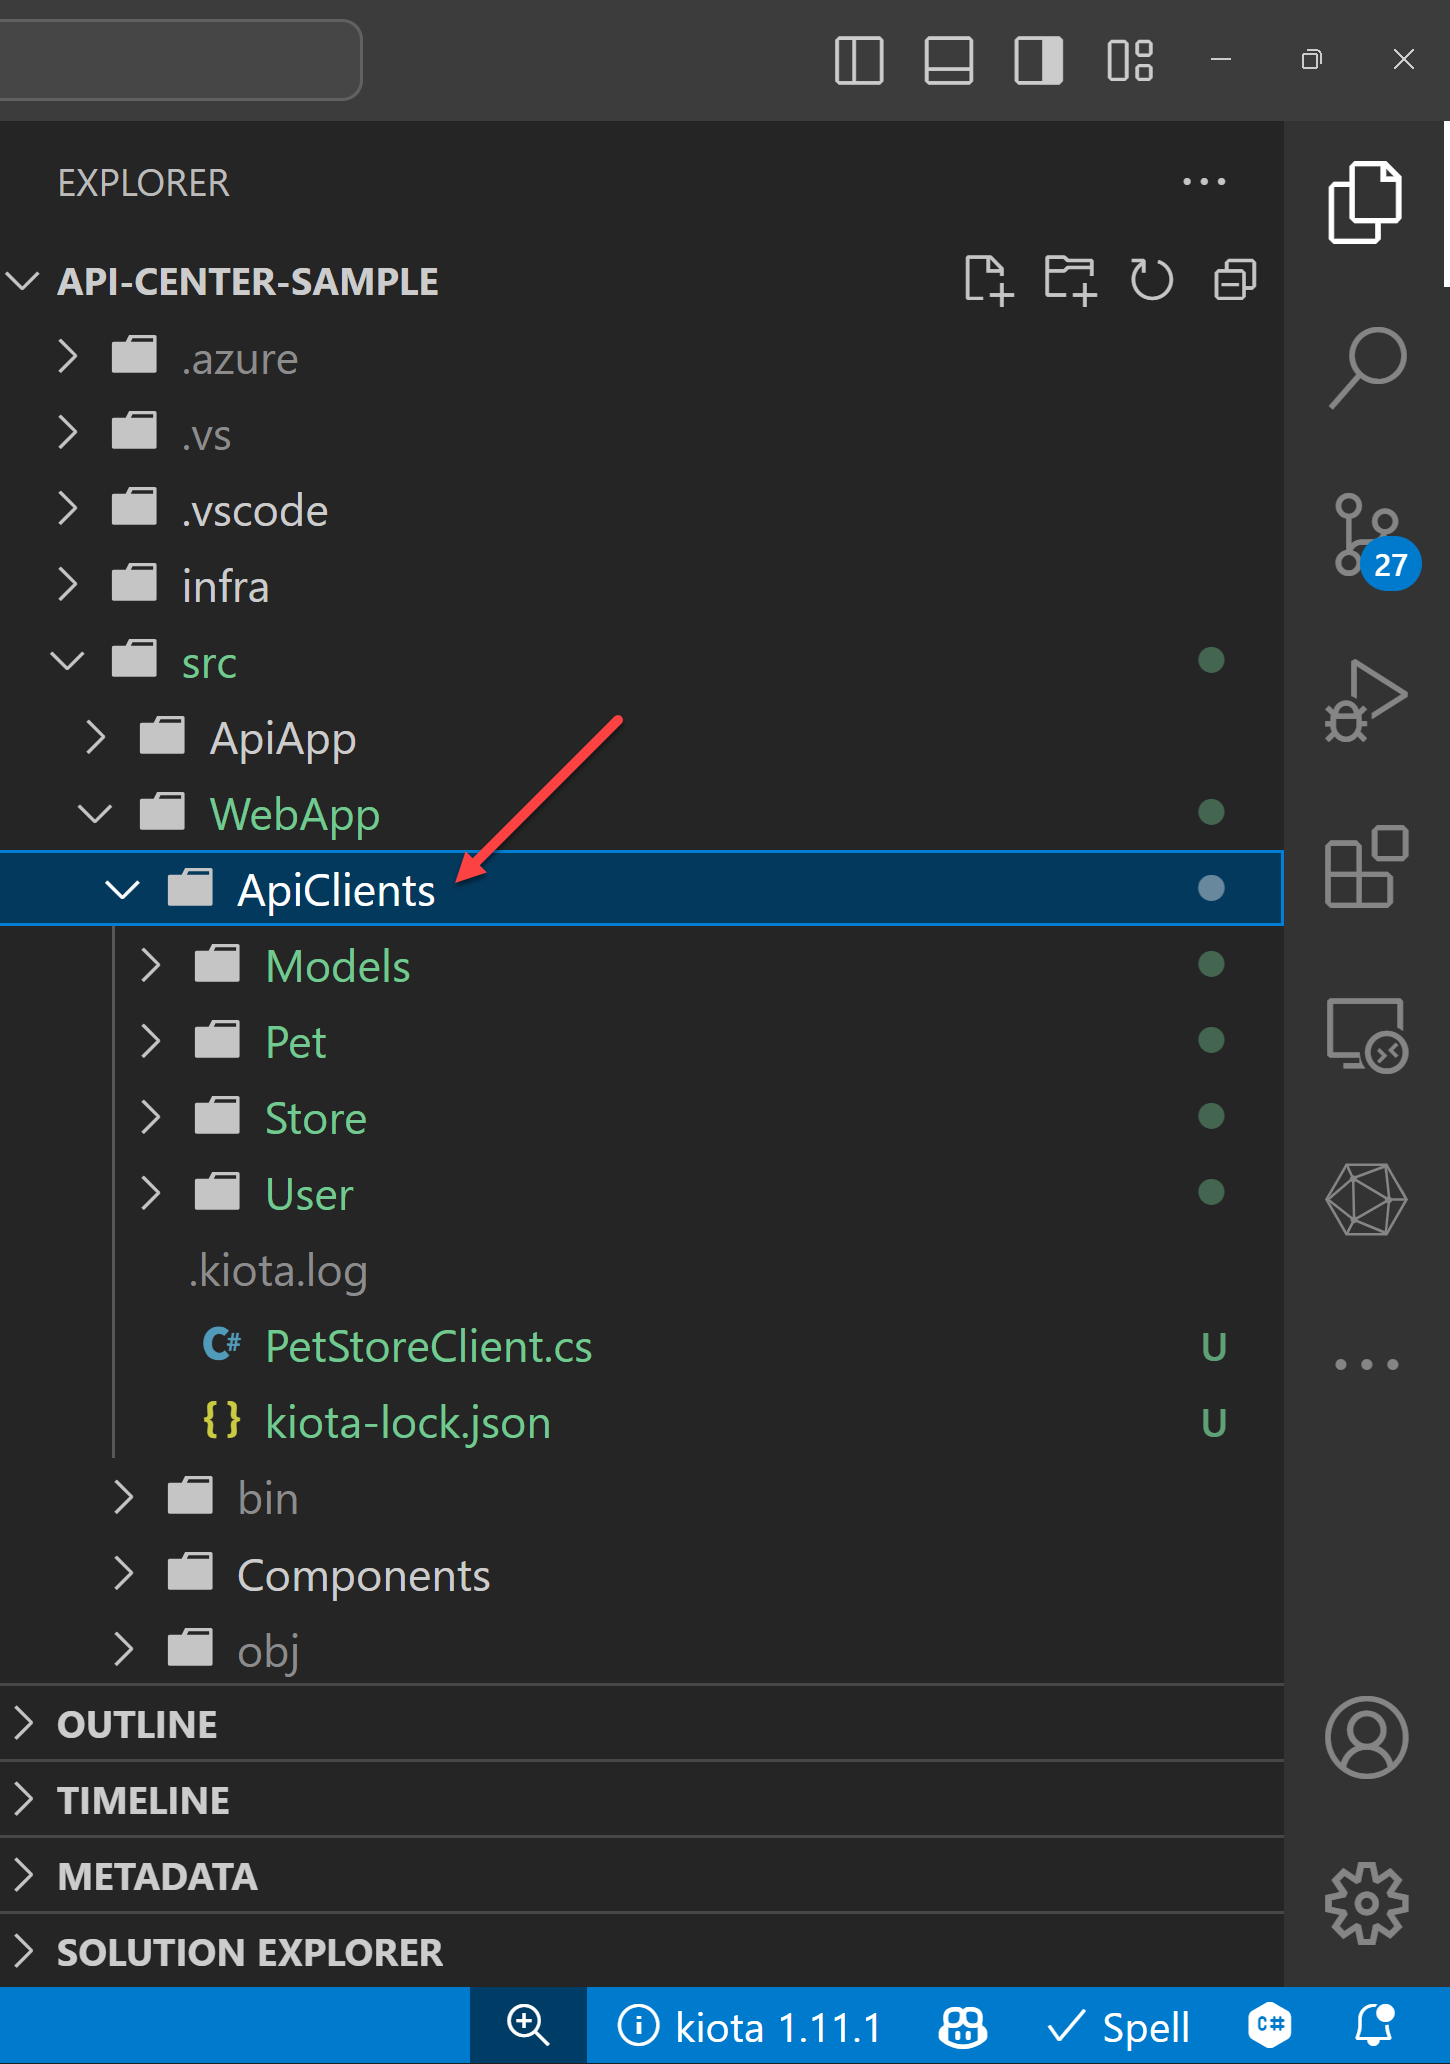
Because I have a Blazor web application, I’m going to generate a C# client SDK for the API. The Kiota extension finds out all the API endpoints from APIC. You can choose them all or just a few of them. Click the :play_button: button, and it generates the client SDK for you.
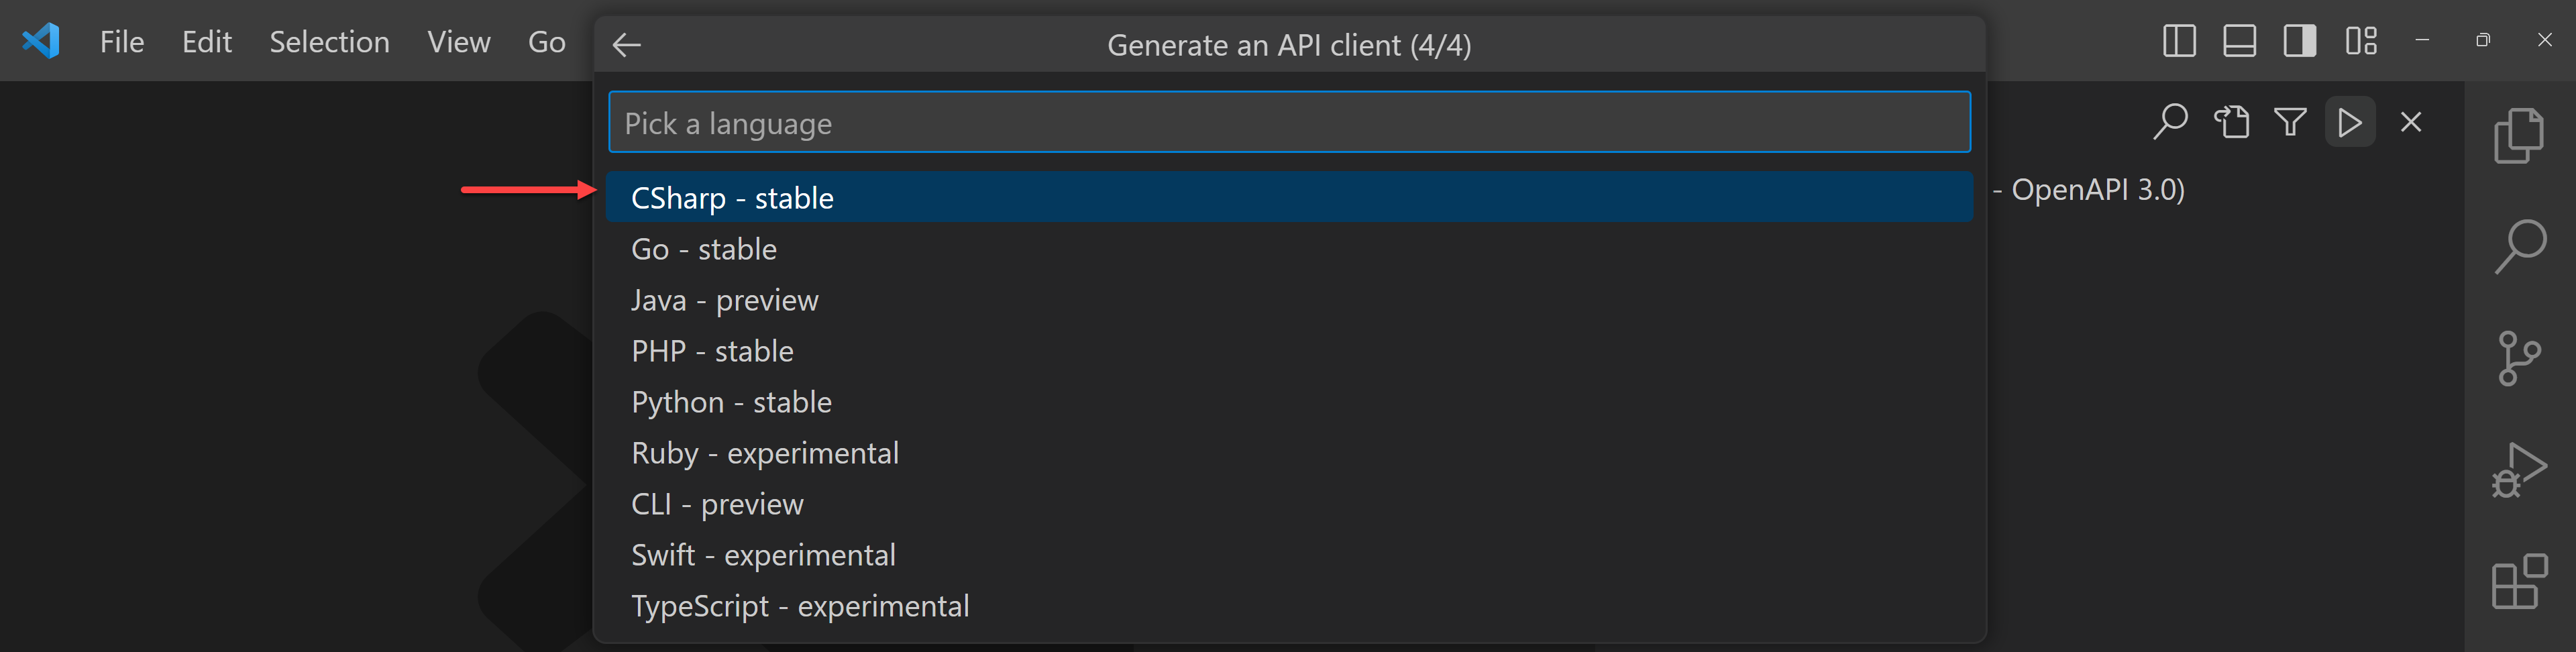
Add the necessary information like class name and namespace of the client SDK, and output folder. Finally it asks in which language to generate the client SDK. There are currently 9 languages available for now. I’m going to choose C#.
The Kiota extension then generates the client SDK into the designated directory.
Consume the generated client SDK within an application
Now, the client SDK has been generated by the Kiota extension from APIC to my Blazor application. Because it uses the Kiota libraries, I need to install the following Kiota NuGet packages to my Blazor web application.
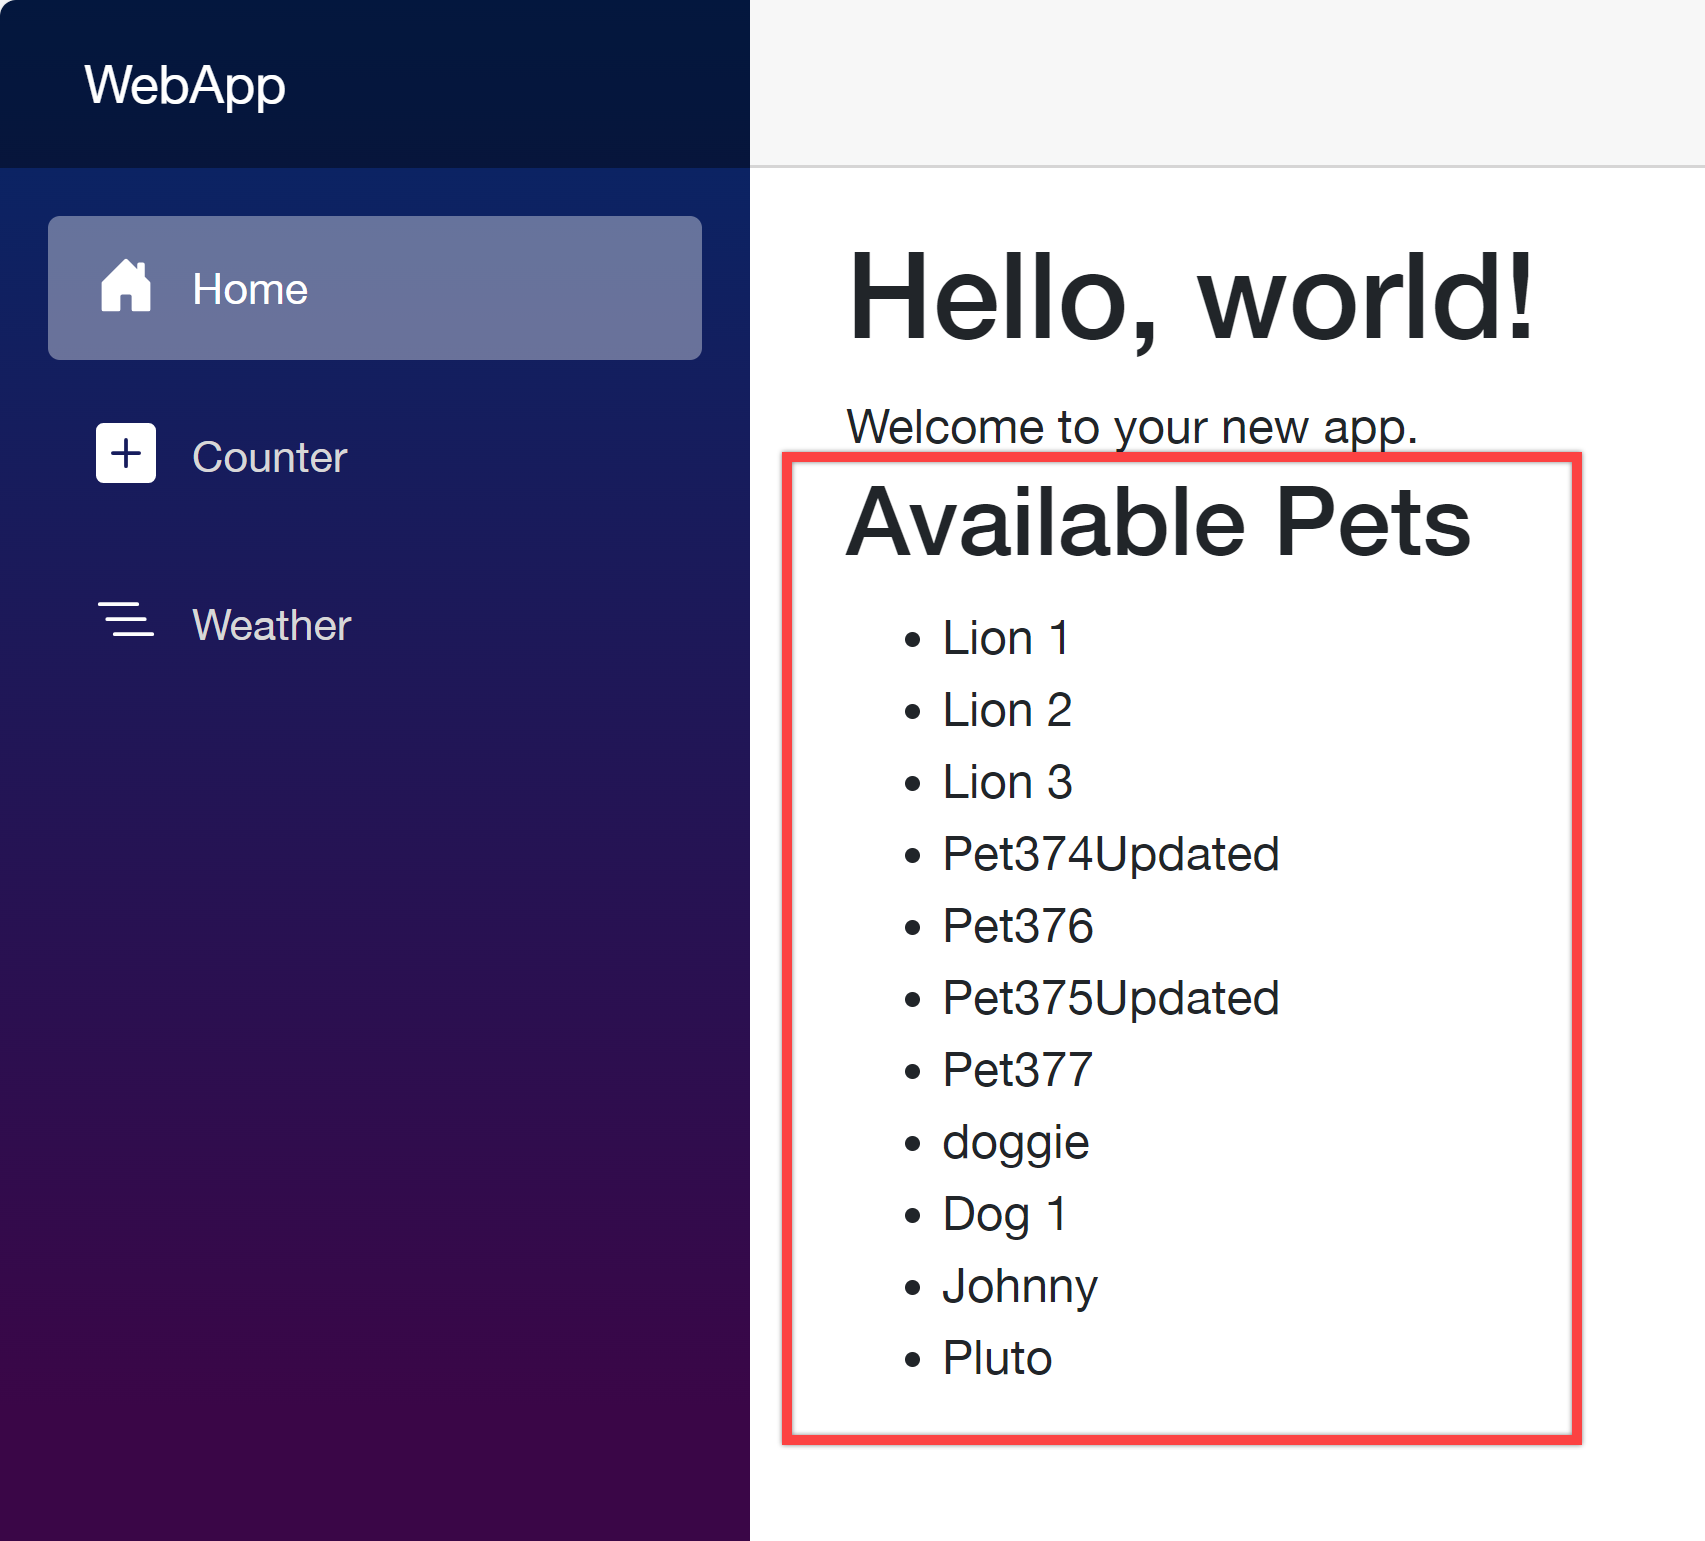
Add dependencies to the Program.cs file and update the Home.razor file to consume the client SDK. Then you will be able to see the result.
Your web application as the API consumer works perfectly with the client SDK generated from APIC.
So far, I’ve walked through how Azure API Center can handle your organisation’s APIs as a central repository, and played around the APIC extension on VS Code. This post has shown you how to provision the APIC instance, register and import APIs in various ways, and how to test those APIs on VS Code and generate the client SDKs directly from VS Code.
As I mentioned in the beginning, taking care of many APIs in one place is crucial as your ogranisation grows up. You might think that you don’t need APIC if your organisation’s API structure is relatively simple. However, even if your organisation is small, APIC will give you better overview of APIs, and how they can interconnected with each other.
More about Azure API Center?
If you want to learn more about APIC, the following links might be helpful.
This article is contributed. See the original author and article here.
Azure Arc is a multi-cloud and on-premises management platform that simplifies governance and management by delivering a consistent way to manage your entire environment together by projecting your existing non-Azure and or on-premises resources into Azure Resource Manager.
Azure Arc has benefited multiple customers by simplifying governance and management by delivering a consistent multi-cloud and on-premises management platform such as patch management using Azure Update Manager, enabling Security using Defender for cloud, Standardized role-based access control (RBAC), Change tracking etc. for resource types hosted outside of Azure such as Sever, Kubernetes, SQL Server etc. Today, we will discuss and enable Change Tracking service for Arc Onboarded devices. To know more about Azure arc benefits and Onboarding process refer to the link here.
Let’s look at what the change tracking service does before we activate it.
The Change Tracking and Inventory services track changes to Files, Registry, Windows Software, Linux Software (Software Inventory), Services and Daemons, also supports recursion, which allows you to specify wildcards to simplify tracking across directories.
Note: Earlier this feature gets enabled using Log Analytics (MMA Agent) and Azure Automation Account. Now this has been simplified with Azure Policy.
Let’s understand how to enable Change tracking and Inventory feature for Arc Onboarded device.
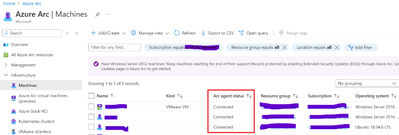
Note: Please make sure that the arc machines are registered, and their status is shown as connected before you turn on the feature, as seen below.
Go to Azure Policy then Definition and filter the category by Change tracking and Inventory. You need to enable all the built-in policies present in Enable change tracking Inventory for Arc enabled virtual machines initiatives for Arc enabled windows and Linux devices respectively.
Assign Configure Windows Arc-enabled machines to install AMA for ChangeTracking and Inventory built-in policy (Scope it to Subscription of Arc Onboarded device). Make Sure you have unchecked the Parameter and verify Effect to DeployIfNotexist and create Remediation task. This will ensure existing resources can be updated via a remediation task after the policy is assigned. Similarly, Configure Linux Arc-enabled machines to install AMA for ChangeTracking and Inventory built-in policy for Arc Onboarded Linux devices. Once configured using Azure Policy, Arc machine will have AMA Agent deployed.
Assign Configure Change Tracking Extension for Windows Arc machines built-in policy (Scope it to Subscription of Arc Onboarded device). Follow the same steps as mentioned in point 1. Similarly, Configure Change Tracking Extension for Linux Arc machines built-in policy for Arc Onboarded Linux devices. Once configured using Azure Policy, Arc machine will have change tracking extension deployed.
Create data collection rule. a. Download CtDcrCreation.json file. Go to Azure portal and in the search, enter Deploy a custom template. In the Custom deployment page > select a template, select Build your own template in the editor. In the Edit template, select Load file to upload the CtDcrCreation.json file or just copy the json and paste the template. And select Save. In the Custom deployment > Basics tab, provide Subscription and Resource group where you want to deploy the Data Collection Rule. The Data Collection Rule Name is optional.
b. In the Custom deployment > Basics tab, provide Subscription and Resource group where you want to deploy the Data Collection Rule. The Data Collection Rule Name is optional. Workspace Resource ID of Log analytic Workspace. (You will get the workspace ID in the overview page of Log analytic workspace) .
c. Select Review+create > Create to initiate the deployment of CtDcrCreation. After the deployment is complete, select CtDcr-Deployment to see the DCR Name. Go to the newly created Data collection Rule (DCR) rule named (Microsoft Ct-DCR). Click on json view and copy the Resource ID.
d. Go to Azure Policy Assign [Preview]: Configure Windows Arc-enabled machines to be associated with a Data Collection Rule for ChangeTracking and Inventory built-in policy (Scope it to Subscription of Arc Onboarded device). Make Sure you have enabled the Parameter and paste the Resource ID captured above and create Remediation task. Similarly, Configure Linux Arc-enabled machines to be associated with a Data Collection Rule for ChangeTracking and Inventory built-in policy for Arc Onboarded Linux devices. Once configured using Azure Policy, Arc machine will have change tracking extension deployed.
After all the policies are configured and deployed. Go to the Arc device, you will be able to view the change tracking and Inventory is enabled.
This article is contributed. See the original author and article here.
Last year, we released a revolutionary set of Copilot capabilities within Dynamics 365 Customer Service. With Copilot, agents can get quick answers, draft emails, and summarize cases and conversations using information that already exists in Dynamics 365, as well as your preferred data sources.
Now there’s Copilot for Service, which lets you connect all your data sources without replacing your existing CRM. Just like Copilot in Dynamics 365 Customer Service, Copilot for Service enables agents to easily manage customer inquiries, track service requests, and provide personalized support. It integrates Microsoft 365 experiences with external systems, such as Salesforce, Zendesk, and ServiceNow.
Why Copilot for Service is the right solution
Today, it is possible to build your own copilots using Copilot Studio, formerly known as Power Virtual Agents. With Copilot Studio, you can create a bot that addresses a specific topic (for example, “get order status”) or you can use plugins to leverage copilots and bots you have already built. Plugins let you connect to external data sources, and you can use them across Copilots to ensure agents have a consistent experience anywhere they ask a service-related question. Agents don’t have to move between systems to find answers, which reduces the time to resolution.
Customers can use Copilot Studio within Copilot for Service to customize and publish plugins for Copilot for Microsoft 365. For example, you can use Copilot Studio to add proprietary knowledge bases for the copilot’s real-time responses or set up authentication to ensure only authorized agents can use Copilot. Building and publishing standalone Copilot experiences for any internal or external channel requires a standalone Copilot Studio license.
Copilot for Service removes the development overhead and will build specific copilot experiences tailored to your organization’s needs. Additionally, if you’re already using Copilot for Microsoft 365, it’s easy to extend it with role-based capabilities for agents through prebuilt connectors to other CRMs.
Try Copilot for Service features
This month, we’re releasing four new features in preview:
Draft an email response in Outlook: Agents can select from the predefined intents for the email to be drafted and provide their own custom intent. Copilot uses the context of the email conversation and case details to produce personalized and contextual emails.
Email summary in Outlook: Copilot provides an email summary capturing all the important information for agents to understand the context of the case they’re working on. Agents can save the generated summary to the connected CRM system.
Case summary in Outlook: Agents can access case summaries as they work on emails from customers. They can also save the case summary to the CRM system.
Meeting recap in Teams: Copilot provides a meeting summary and action items that integrate with the Teams recap, providing all the relevant follow-up items. Agents can also create CRM tasks right from the Teams recap section.
Get started with Copilot for Service
First, create a copilot instance in your environment by navigating to https://servicecopilot.microsoft.com/ and following the prompts. You need to give it a name, a description, and a target system that you want to connect to. For example, you can create a copilot named Microsoft that can access information from Salesforce. The portal will then guide you through creating the connection and deploying the copilot.
The second step is to test your copilot in the demo agent desktop that is automatically generated for you. You can ask your copilot questions related to the target system, such as “What products does Microsoft sell?” or “How do I create a case in Salesforce?”
In summary, Microsoft Copilot for Service is a powerful tool that can help your agents provide better support to your customers. By leveraging the power of AI, it can provide quick and accurate answers to common questions, freeing up your agents to focus on more complex issues. To learn more, be sure to check out the partner workshop and try it out for yourself.


Recent Comments