by Scott Muniz | Jul 26, 2020 | Alerts, Microsoft, Technology, Uncategorized
This article is contributed. See the original author and article here.
Hello folks,
Last month I presented a session during the “Windows Server webinar miniseries – Month of Cloud Essentials”. The session was on how to create highly available apps with Azure VMs. Following the session I was asked about setting up traditional Windows Server Clusters.
During that conversation I stated my belief that if you are building modern apps that can run in an active-active model, a traditional cluster might not be needed.
You can achieve the same results with Azure Availability Set/Zones, Azure Load Balancers and virtual machine. However, if your migrating or deploying an app that requires the traditional Windows cluster, or shared storage. Our story was not the best. Up to now, you had to deploy an additional VM that would “host” the Cluster Shared Volumes.
That changed last week with 2 announcements…
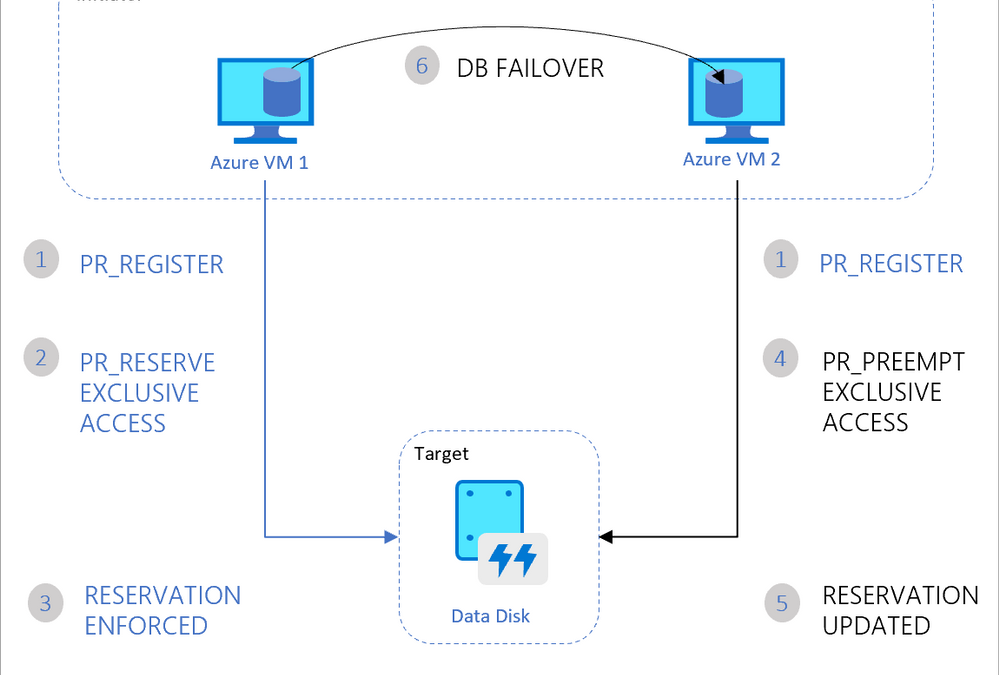
The first announcement was about Announcing the general availability of Azure shared disks and new Azure Disk Storage enhancements. The general availability of shared disks on Azure Disk Storage will now enable enterprises to easily migrate your existing on-premises Windows and Linux-based clustered environments to Azure. This is a new feature for Azure managed disks that allows you to attach a managed disk to multiple virtual machines (VMs) simultaneously. Therefore, allowing you to either deploy new or migrate existing clustered applications to Azure.
VMs in the cluster can read or write to their attached disk based on the reservation chosen by the clustered application using SCSI Persistent Reservations (SCSI PR). The shared disks are exposed as logical unit numbers (LUNs) and look like direct-attached-storage (DAS) to your VM.

The second interesting announcement is Windows Admin Center version 2007 is now generally available!. The new version comes with multiple new improvements but one in particular caught my attention. New Cluster deployment experience and capabilities.
Windows Admin Center now provides a graphical cluster deployment workflow. It allows you to deploy multiple cluster types based on the operating system that runs on their choice of servers.

Together these two announcements are enabling the deployment of traditional Windows or Linux Clusters without the need for an additional VM to host the CSV. Therefore, simplifying your deployments and making them more cost efficient since you save the cost of the additional VM.
Our Story is getting better all the time and Hybrid is built into it.
Cheers!
Pierre Roman
by Scott Muniz | Jul 26, 2020 | Alerts, Microsoft, Technology, Uncategorized
This article is contributed. See the original author and article here.
This is the third post of a series dedicated to the implementation of automated Continuous Optimization with Azure Advisor Cost recommendations. For a contextualization of the solution here described, please read the introductory post for an overview of the solution and also the second post for the details and deployment of the main solution components.
Introduction
If you read the previous posts and deployed the Azure Optimization Engine solution, by now you have a Log Analytics workspace containing Advisor Cost recommendations as well as Virtual Machine properties and performance metrics, collected in a daily basis. We have all the historical data that is needed to augment Advisor recommendations and help us validate and, ultimately, automate VM right-size remediations. As a bonus, we have now a change history of our Virtual Machine assets and Advisor recommendations, which can also be helpful for other purposes.
So, what else is needed? Well, we need first to generate the augmented Advisor recommendations, by adding performance metrics and VM properties to each recommendation, and then store them in a repository that can be easily consumed and manipulated both by visualization tools and by automated remediation tasks. Finally, we visualize these and further recommendations with a simple Power BI report.
Anatomy of a recommendation
There isn’t much to invent here, as the Azure Advisor recommendation schema fits very well our purpose. We just need to add to this schema some other relevant fields:
- Confidence score – each recommendation type will have its own algorithm to compute the confidence score. For example, for VM right-size recommendations, we’ll calculate it based on the VM metrics and whether the target SKU meets the storage and networking requirements.
- Details URL – a link to a web page where we can see the actual justification for the recommendation (e.g., the results of a Log Analytics query chart showing the performance history of a VM).
- Additional information – a JSON-formatted value containing recommendation-specific details (e.g., current and target SKUs, estimated savings, etc.).
- Tags – if the target resource contains tags, we’ll just add them to the recommendation, as this may be helpful for reporting purposes.
Generating augmented Advisor recommendations
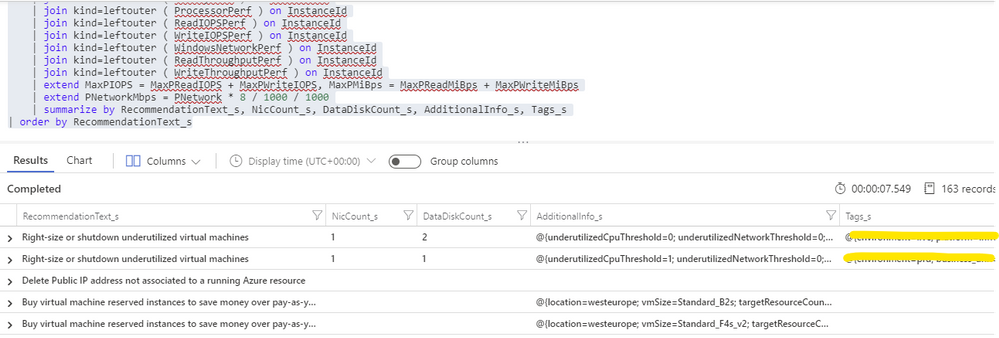
Having in the same Log Analytics repository all the data we need makes things really easy. We just need to build a query that joins Advisor recommendations with VM performance and properties and then automate a periodic export of the results for additional processing (see sample results below). As Advisor right-size recommendations consider only the last seven days of VM performance, we just have to run it once per week.

For each exported recommendation, we’ll then execute a simple confidence score algorithm that decreases the recommendation confidence whenever a performance criterion is not met. We are considering these relatively weighted criteria against the recommended target SKU and observed performance metrics:
- [Very high importance] Does it support the current data disks count?
- [Very high] Does it support the current network interfaces count?
- [High] Does it support the percentile(n) un-cached IOPS observed for all disks in the respective VM?
- [High] Does it support the percentile(n) un-cached disks throughput?
- [Medium] Is the VM below a given percentile(n) processor and memory usage percentage?
- [Medium] Is the VM below a given percentile(n) network bandwidth usage?
The confidence score ranges from 0 (lowest) to 5 (highest). If we don’t have performance metrics for a VM, the confidence score is still decreased though in a lesser proportion. If we are processing a non-right-size recommendation, we still include it in the report, but the confidence score is not computed (remaining at the -1 default value).
Bonus recommendation: orphaned disks
The power of this solution is that having so valuable historical data in our repository and adding other sources to it will allow us to generate our own custom recommendations as well. One recommendation that easily comes out of the data we have been collecting is a report of orphaned disks – for example, disks that belonged to a VM that was meanwhile deleted (see sample query below). But you can easily think of others, even beyond cost optimization.

Azure Optimization Engine reporting
Now that we have an automated process that generates and augments optimization recommendations, the next step is to add visualizations to it. For this purpose, there is nothing better than Power BI. To make things easier, we have meanwhile ingested our recommendations into an Azure SQL Database, where we can better manage and query data. We use it as the data source for our Power BI report, with many perspectives (see sample screenshots below).
The overview page gives us a high-level understanding of the recommendations’ relative distribution. We can also quickly see how many right-size recommended target SKUs are supported by the workload characteristics. In the example below, we have many “unknowns”, since only a few VMs were sending performance metrics to the Log Analytics workspace.

In the exploration page, we can investigate all the available recommendations, using many types of filters and ordering criteria.

After selecting a specific recommendation, we can drill through it and navigate to the Details or History pages.

In the Details page, we can analyze all the data that was used to generate and validate the recommendation. Interestingly, the Azure Advisor API has recently included additional details about the thresholds values that were observed for each performance criterion. This can be used to cross-check with the metrics we are collecting with the Log Analytics agent.

In the History page, we can observe how the confidence score has evolved over time for a specific recommendation. If the confidence score has been stable at high levels for the past weeks, then the recommendation can likely be implemented without risks.

Each recommendation includes a details URL that opens an Azure Portal web page with additional information not available in the report. If we have performance data in Log Analytics for that instance, we can even open a CPU/memory chart with the performance history.

Deploying the solution and next steps
Everything described so far in these posts is available for you to deploy and test, in the Azure Optimization Engine repository. You can find there deployment and usage instructions and, if you have suggestions for improvements or for new types of recommendations, please open a feature request issue or… why not be brave and contribute to the project? ;)
The final post of this series will discuss how we can automate continuous optimization with the help of all the historical data we have been collecting and also how the AOE can be extended with additional recommendations (not limited to cost optimization).
Thank you for having been following! See you next time! ;)
by Scott Muniz | Jul 24, 2020 | Alerts, Microsoft, Technology, Uncategorized
This article is contributed. See the original author and article here.
As discussed in my two previous posts, Azure Sentinel provides a variety of methods for importing threat intelligence directly into the ThreatIntelligenceIndicator Logs table where it can be used to power Analytics, Workbooks, Hunting, and other experiences.
However, Azure Sentinel also allows you to leverage massive repositories of external intelligence data as enrichment sources to enhance the triage and investigation experience of security incidents. Using the built-in automation capabilities of Azure Sentinel you can take any incident created through Azure Sentinel analytics rules, and retrieve additional context about the entities from third party sources, and make this context readily available to your security operations personnel to aid triage and investigation.
Today, we are announcing the availability of the RiskIQ Intelligence Connector for Azure Sentinel which allows you to tap into petabytes of external threat intelligence from RiskIQ’s Internet Intelligence Graph. Incidents can be enriched automatically using Azure Sentinel Playbooks, saving time and resources for your security responders. This blog will walk you through the setup, configuration, and show you how the rich context from the new RiskIQ Intelligence Connector playbooks is surfaced in Azure Sentinel security incidents.
Installation
Each RiskIQ enrichment playbook leverages one or more RiskIQ Security Intelligence Service APIs to provide up to the minute threat and contextual information. To learn more about the service and request a trial key, see the API documentation.
The set of RiskIQ Intelligence Connector playbooks are located in the Azure Sentinel GitHub repository.
In this blog we’ll use the Enrich-SentinelIncident-RiskIQ-IP-Passive-DNS playbook as an example.
- Select the Deploy to Azure button on the playbook page in GitHub

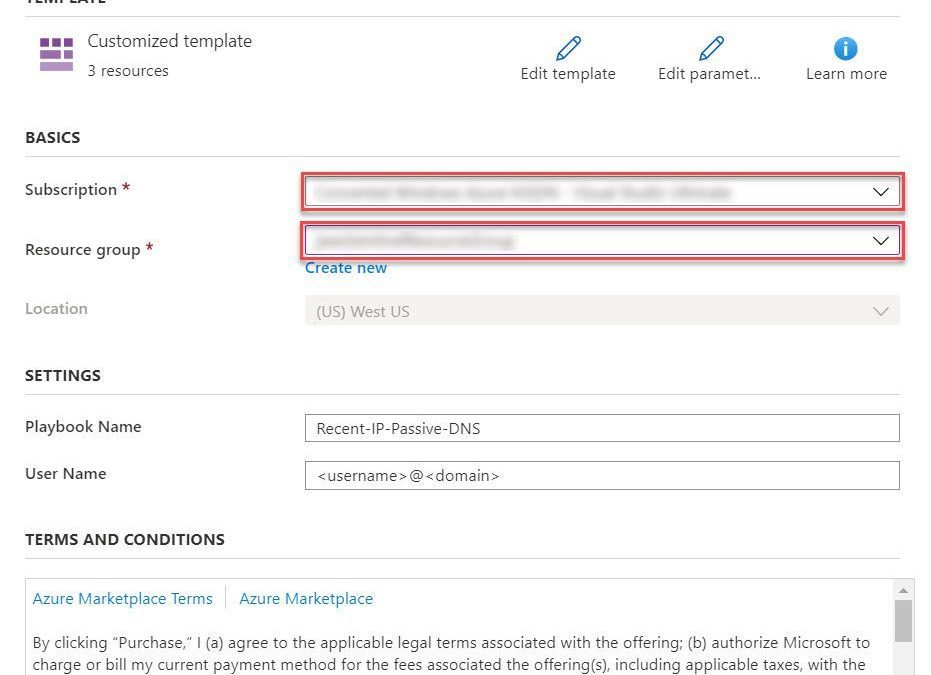
- This will bring you to the Azure portal, Custom Deployment page. Input the Subscription and Resource Group values corresponding to your Azure Sentinel instance, and select the terms and conditions check box

- Select the Purchase button at the bottom of the page
- You will receive an Azure notification when the deployment has completed

Configuration
Once the playbook has been imported into your Azure Sentinel instance your will need to edit the playbook to configure the connections. Certain playbook actions require additional connection information to function, most commonly these are in the form of credentials for actions that require connecting to APIs. In this example, the playbook requires two connections, one for Azure Sentinel to read security alerts and the second for RiskIQ APIs to query for enrichment context for entities found in alerts.
- In the Azure portal, navigate to your Azure Sentinel workspace where you imported the playbook
- Select Playbooks from the Azure Sentinel navigation menu
- Select the Recent-IP-Passive-DNS playbook by selecting the playbook name
- Select Edit from the top menu of the playbook
- There are four steps in this playbook requiring you to configure connections

- Select a Connection from one of the steps requiring configuration and configure a new connection. For the connections to Azure Sentinel the user specified when establishing the connection must have sufficient permissions in the Azure Sentinel workspace to read the security alerts. For the RiskIQ connection, enter your RiskIQ API token and secret obtained from RiskIQ.
- Select Save from the top menu of the playbook to save the playbook
Use the RiskIQ playbook to enrich security incidents
Now that the Recent-IP-Passive-DNS playbook is installed and configured you can use it with the built-in Azure Sentinel automation framework in your analytics rules. Let’s take a look at how to associate this playbook with an analytic rule to enrich security incidents and give your security responders additional context for triage and investigation.
- Navigate to your Azure Sentinel Analytics page and select an existing analytics rule or template item you wish to add the playbook automation. Select Edit for an existing rule or Create rule for a new rule.
- The Recent-IP-Passive-DNS playbook works with analytics rules which map IP address entities so make sure you are working with such a rule. For simple testing of the playbook automation you can use rule logic as shown below to force an alert creation with a specific IP address.
AzureActivity
| take 1
| extend IPCustomEntity = "144.91.119.160"
- Navigate to the Automated response tab and place a check mark in the box for the Recent-IP-Passive-DNS playbook which will enable the playbook to run each time the analytic rule generates security alerts
- Select Save to finish and return to the Analytics page
The Recent-IP-Passive-DNS playbook queries the RiskIQ passive DNS database and retrieves any domains from the last 30 days associated with the IP address found in the security alert. It then adds this enrichment information to the resulting security incident so your security responders can easily access this additional context with triaging the incident. Let’s take a look at this experience for your security responders.
- Navigate to your Azure Sentinel Incidents page
- Locate the incident generated from the analytic rule configured to run the Recent-IP-Passive-DNS playbook automation and select Full details from the information pane
- Select the Comments tab to see the enrichment added by the Recent-IP-Passive-DNS playbook automation. You can also view the information in the RiskIQ portal by following the link provided at the bottom of the comment

Summary
In this post you learned how to obtain, configure, and associate the RiskIQ Intelligence Connector playbooks with analytics rules to enrich security incidents with additional context. Azure Sentinel, when combined with RiskIQ, has the potential to reshape how security teams operate, seamlessly integrating the most comprehensive external visibility with the advanced threat detection, AI, and orchestration found in Azure Sentinel.
by Scott Muniz | Jul 24, 2020 | Alerts, Microsoft, Technology, Uncategorized
This article is contributed. See the original author and article here.
Hi, all! Rod Trent here. I am a Cybersecurity CE/Consultant at Microsoft and work with Azure Sentinel literally every waking hour, so I see and hear a lot of unique and interesting things in relation to this fantastic product. I also blog for our Secure Infrastructure Blog and have quite a few Azure Sentinel articles posted there already.
Did you know that the Log Analytics agent requires an Internet connection no matter if it’s installed on an on-premises system or as an extension on a virtual machine stored in Azure? It may seem a bit quirky, but it’s true. Yes, even though an Azure VM has been spun up in the same cloud that the Log Analytics Workspace resides in, the agent still checks to see if there’s a valid Internet connection – well, actually it checks for a specific port (443) to be accessible, but the return error message is that an Internet connection is required.
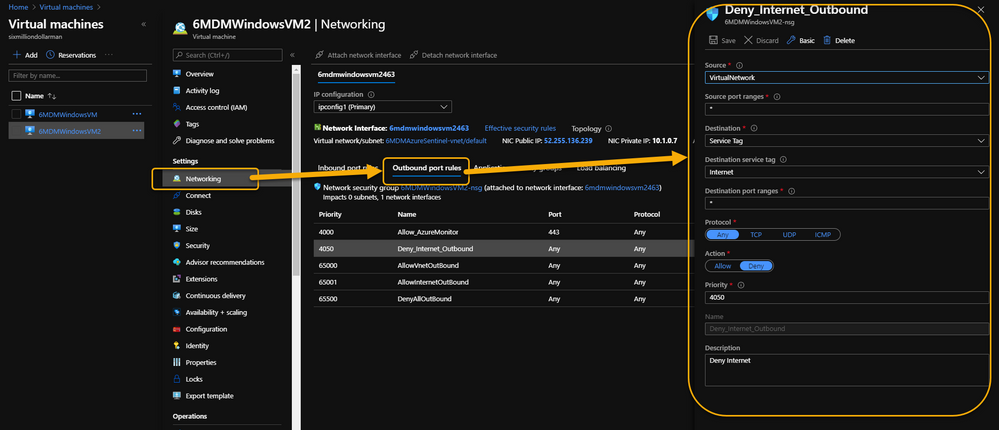
As a security precaution, some customers spin up VMs in Azure and disable all outbound Internet access. This is done through an Outbound rule (VM => Networking => Outbound port rules => Deny Internet) similar to what is shown in the following image:
 VM => Networking => Outbound port rules => Deny Internet
However, the same customer may also want to monitor potential threats against these VMs using Azure Sentinel. Azure Sentinel, of course, requires a Log Analytics workspace which requires the Log Analytics agent extension to be installed which, yeah…you guessed it…requires the outbound Internet connection already discussed.
Even more interesting is that the Log Analytics agent extension will deploy perfectly. And, unless it’s monitored obsessively, all seems just fine. Well, that is, until it’s realized that the newly installed agent isn’t sending its data to Azure Sentinel’s Log Analytics Workspace.
 Log Analytics Agent cannot connect due to a blocked port
If it’s required that the Azure VM remains Internet disconnected, the solution is to create a new Outbound rule for the VM to provide the necessary port to trick the agent into thinking it has the required Internet connection. The new Outbound rule also needs to have a higher priority than the blocker, otherwise the port will never be exposed.
The new Outbound rule should look like the following:
 Enable a new Outbound Rule specifically for AzureMonitor
The details:
Create a new Outbound rule with a higher priority than the Deny Internet rule with the following information:
- Source: VirtualNetwork
- Secure port ranges: *
- Destination: ServiceTag
- Destination service tag: AzureMonitor
- Destination port ranges: 443
- Protocol: Any
- Action: Allow
- Priority: (set it higher than the Deny Internet rule)
- Description: (I always recommend being very verbose when describing something you create – just in case you have a tendency to forget later on)
Summary
This technique ensures that the Virtual Machine doesn’t have Internet access according to policy, and that security can still be managed and monitored through Azure Sentinel. Disabling full Internet access for each Virtual Machine may seem a rare occurrence, but as I noted in my opening statement, I regularly work with scenarios that are sometimes uncommon. And, if I see it once, it’s most likely going to happen again. Sharing makes us all smarter.
A use case example where this makes perfect sense is for Windows Virtual Desktops (WVD). Disabling the Internet completely for a compromised WVD, ensures that the device is effectively quarantined from the other VMs in the WVD pool while still maintaining the ability to kick-off a malware scan through an Azure Sentinel Playbook because the Azure Monitor port is still open.
NOTE: In the future, you can Use Azure Private Link to securely connect networks to Azure Monitor.
For additional knowledge in relation to Azure Sentinel-specific role access components, see the following:
Granting Access to Specific Azure Sentinel Playbooks for Specific Analysts: https://secureinfra.blog/2020/06/19/granting-access-to-specific-azure-sentinel-playbooks-for-specific-analysts/
Controlling access to Azure Sentinel Data: Resource RBAC: https://techcommunity.microsoft.com/t5/azure-sentinel/controlling-access-to-azure-sentinel-data-resource-rbac/ba-p/1301463
Table Level RBAC In Azure Sentinel: https://techcommunity.microsoft.com/t5/azure-sentinel/table-level-rbac-in-azure-sentinel/ba-p/965043
Permissions in Azure Sentinel: https://docs.microsoft.com/en-us/azure/sentinel/roles
* Check out my other blog for more Azure Sentinel content: Rod Trent at the Secure Infrastructure Blog
* Follow me on Twitter: https://twitter.com/rodtrent

by Scott Muniz | Jul 23, 2020 | Alerts, Microsoft, Technology, Uncategorized
This article is contributed. See the original author and article here.
What a busy week for Azure Services! Microsoft Inspire took place this week and new announcements were shared. Announcements include: The next generation of Azure Stack HCI, Numerous Azure Kubernetes Service announcements, Azure IoT Connector to ingest data from Internet of Medical Things (IoMT) devices and Azure Monitor Logs connector.
The new Azure Stack HCI solution
The new Microsoft Azure Stack HCI provides the best-in-class hyper-converged infrastructure stack, which integrates seamlessly into existing on-premises environments using existing processes and tools. It also is delivered as an Azure hybrid service, which natively integrates into your Azure environment, comes with subscription-based billing, and a dedicated support team. It provides many Azure Hybrid services which can be leveraged to make on-premises environments better. More information regarding the Microsoft Inspire announcement can be found here: The next generation of Azure Stack HCI
Numerous Azure Kubernetes Service Announcements
- AKS-managed Azure Active Directory support is now generally available – Azure Kubernetes Service (AKS)-managed Azure Active Directory (Azure AD) support is now generally available. This simplifies AKS integration with Azure AD. Customers are no longer required to create client apps or service apps or require tenant owners to grant elevated permissions. AKS creates appropriate roles/role bindings with group memberships though delegated permissions to facilitate administration.
- Secure Azure Kubernetes Service (AKS) pods with Azure Policy (in preview) – To improve the security of your Azure Kubernetes Service (AKS) cluster, secure your pods with Azure Policy (in preview). Users can choose from a list of built-in options and apply those policies to secure pods.
- Azure Kubernetes Service (AKS) now supports bring-your-own control plane managed identity – Azure Kubernetes Service (AKS) now supports bring-your-own identities for the control plane managed identity. The Kubernetes cloud provider uses this identity to create resources like Azure Load Balancer, public IP addresses, and others on behalf of the user. Managed identities simplify overall management of authorization, as users don’t have to manage service principals on their own.
Azure IoT Connector for FHIR now in preview
IoT Connector enables a new set of scenarios like remote patient monitoring, telehealth, clinical trials, and smart hospitals by bringing PHI data from devices into Azure API for FHIR, which can be used along with other clinical data to enable newer insights and clinical workflows. It can accept JSON-based messages from IoMT devices, use mapping templates to transform device data into a FHIR standard resource, and finally persist the resource into Azure API for FHIR. Use it seamlessly with Azure IoT Central, Azure IoT Hub, and other IoT cloud gateways.
Azure Monitor Logs connector is now generally available
Create automated workflows using hundreds of actions for a variety of services with Azure Logic Apps and Power Automate. The Azure Monitor logs connector is now generally available and can be used to build workflows that retrieve data from the Azure Monitor Logs workspace or Application Insights component.
MS Learn Module of the Week
Implement hybrid identity with Windows Server
In this module, you’ll learn to configure an Azure environment so that Windows IaaS workloads requiring Active Directory are supported. You’ll also learn to integrate on-premises Active Directory Domain Services (AD DS) environment into Azure.
Let us know in the comments below if there are any news items you would like to see covered in next week show. Az Update streams live every Friday. Be sure to catch the next episode and join us in the live chat.
by Scott Muniz | Jul 23, 2020 | Alerts, Microsoft, Technology, Uncategorized
This article is contributed. See the original author and article here.
Monitoring your database is one of the most crucial tasks to ensure a continued healthy and steady workload. Azure Database for PostgreSQL, our managed database service for Postgres, provides a wealth of metrics to monitor your Postgres database on Azure. But what if the very metric that you are after is not yet available?
Worry not because there are ample options to easily create and monitor custom metrics with Azure Database for PostgreSQL. One solution you can use with Postgres on Azure is Datadog’s custom metrics.
If you are not familiar with Datadog, it is one of many solid 3rd party solutions that provides a set of canned metrics for various technologies, including PostgreSQL. Datadog also enables you to poll our databases with the help of custom queries to emit custom metrics data to a central location where you can monitor how well your workload is doing.
If you don’t yet have a Datadog account, no problem, you can use a free trial Datadog account to try out everything I’m going to show you in this post.
What is bloat in Postgres & why should you monitor it?
As a proud owner of a PostgreSQL database, you will inevitably have to experience and manage bloat, which is a product of PostgreSQL’s storage implementation for multi-version concurrency control. Concurrency is achieved by creating different versions of tuples as they receive modifications. As you can imagine, PostgreSQL will keep as many versions of the same tuple as the number of concurrent transactions at any time and make the last committed version visible to the consecutive transactions. Eventually, this creates dead tuples in pages that later need to be reclaimed.
To keep your database humming, it’s important to understand how your table and index bloat values progress over time—and to make sure that garbage collection happens as aggressively as it should. So you need to monitor your bloat in Postgres and act on it as needed.
Before you start, I should clarify that this post is focused on how to monitor bloat on Azure Database for PostgreSQL – Single Server. On Azure, our Postgres managed database service also has a built-in deployment option called Hyperscale (Citus)—based on the Citus open source extension—and this Hyperscale (Citus) option enables you to scale out Postgres horizontally. Because the code snippets and instructions below are a bit different for monitoring a single Postgres server vs. monitoring a Hyperscale (Citus) server group, I plan to publish the how-to instructions for using custom monitoring metrics on a Hyperscale (Citus) cluster in a separate/future blog post. Stay tuned! Now, let’s get started.
First, prepare your monitoring setup for Azure Database for PostgreSQL – Single Server
If you do not already have an Azure Database for PostgreSQL server, you may create one as prescribed in our quickstart documentation.
Create a read-only monitoring user
As a best practice, you should allocate a read-only user to poll your data from database. Depending on what you want to collect, granting pg_monitor role, which is a member of pg_read_all_settings, pg_read_all_stats and pg_stat_scan_tables starting from Postgres 10, could be sufficient.
For this situation, we will also need to GRANT SELECT for the role to all the tables that we want to track for bloat.
CREATE USER metrics_reader WITH LOGIN NOSUPERUSER NOCREATEDB NOCREATEROLE INHERIT NOREPLICATION CONNECTION LIMIT 1 PASSWORD 'xxxxxx';
GRANT pg_monitor TO metrics_reader;
--Rights granted here as blanket for simplicity.
GRANT SELECT ON ALL TABLES IN SCHEMA public to metrics_reader;
Create your bloat monitoring function
To keep Datadog configuration nice and tidy, let’s first have a function to return the bloat metrics we want to track. Create the function below in the Azure Database for PostgreSQL – Single Server database you would like to track.
If you have multiple databases to track, you can consider an aggregation mechanism from different databases into a single monitoring database to achieve the same objective. This how-to post is designed for a single database, for the sake of simplicity.
The bloat tracking script used here is a popular choice and was created by Greg Sabino Mullane. There are other bloat tracking scripts out there in case you want to research a better fitting approach to track your bloat estimates and adjust your get_bloat function.
CREATE OR REPLACE FUNCTION get_bloat ()
                RETURNS TABLE (
                                database_name NAME,
                                schema_name NAME,
                                table_name NAME,
                                table_bloat NUMERIC,
                                wastedbytes NUMERIC,
                                index_name NAME,
                                index_bloat NUMERIC,
                                wastedibytes DOUBLE PRECISION
)
AS $$
BEGIN
                RETURN QUERY SELECT current_database() as databasename, schemaname, tablename,ROUND((CASE WHEN otta=0 THEN 0.0 ELSE sml.relpages::FLOAT/otta END)::NUMERIC,1) AS tbloat,CASE WHEN relpages < otta THEN 0 ELSE bs*(sml.relpages-otta)::BIGINT END AS wastedbytes,iname, ROUND((CASE WHEN iotta=0 OR ipages=0 THEN 0.0 ELSE ipages::FLOAT/iotta END)::NUMERIC,1) AS ibloat,CASE WHEN ipages < iotta THEN 0 ELSE bs*(ipages-iotta) END AS wastedibytes FROM (SELECT schemaname, tablename, cc.reltuples, cc.relpages, bs,CEIL((cc.reltuples*((datahdr+ma-(CASE WHEN datahdr%ma=0 THEN ma ELSE datahdr%ma END))+nullhdr2+4))/(bs-20::FLOAT)) AS otta,COALESCE(c2.relname,'?') AS iname, COALESCE(c2.reltuples,0) AS ituples, COALESCE(c2.relpages,0) AS ipages,COALESCE(CEIL((c2.reltuples*(datahdr-12))/(bs-20::FLOAT)),0) AS iotta FROM (SELECT ma,bs,schemaname,tablename,(datawidth+(hdr+ma-(CASE WHEN hdr%ma=0 THEN ma ELSE hdr%ma END)))::NUMERIC AS datahdr,(maxfracsum*(nullhdr+ma-(CASE WHEN nullhdr%ma=0 THEN ma ELSE nullhdr%ma END))) AS nullhdr2 FROM (SELECT schemaname, tablename, hdr, ma, bs,SUM((1-null_frac)*avg_width) AS datawidth,MAX(null_frac) AS maxfracsum,hdr+(SELECT 1+COUNT(*)/8 FROM pg_stats s2 WHERE null_frac<>0 AND s2.schemaname = s.schemaname AND s2.tablename = s.tablename) AS nullhdr FROM pg_stats s, (SELECT(SELECT current_setting('block_size')::NUMERIC) AS bs,CASE WHEN SUBSTRING(v,12,3) IN ('8.0','8.1','8.2') THEN 27 ELSE 23 END AS hdr,CASE WHEN v ~ 'mingw32' THEN 8 ELSE 4 END AS ma FROM (SELECT version() AS v) AS foo) AS constants GROUP BY 1,2,3,4,5) AS foo) AS rs JOIN pg_class cc ON cc.relname = rs.tablename JOIN pg_namespace nn ON cc.relnamespace = nn.oid AND nn.nspname = rs.schemaname AND nn.nspname <> 'information_schema' LEFT JOIN pg_index i ON indrelid = cc.oid LEFT JOIN pg_class c2 ON c2.oid = i.indexrelid) AS sml WHERE schemaname NOT IN ('pg_catalog') ORDER BY wastedbytes DESC;
END; $$
LANGUAGE 'plpgsql';
Confirm your read-only Postgres user can observe results
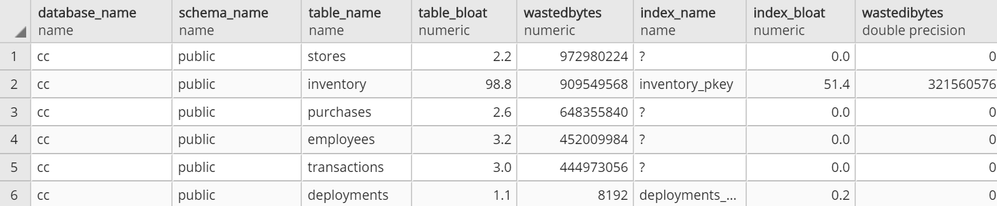
At this point, you should be able to connect to your Azure Database for PostgreSQL server with your read-only user and run SELECT * FROM get_bloat(); to observe results.
 get_bloat function’s sample output
If you don’t get anything in the output, see if the following steps remedy this:
- Check your pg_stat records with
SELECT * FROM pg_stats WHERE schemaname NOT IN ('pg_catalog','information_schema');
- If you don’t see your table and columns in there, make sure to run
ANALYZE <your_table> and try again
- If you still don’t see your table in the result set from #1, your user very likely does not have select privilege on a table that you expect to see in the output
Then, setup your 3rd party monitoring (in this case, with Datadog)
Once you confirm that your read-only user is able to collect the metrics you want to track on your Azure Postgres single server, you are now ready to set up your 3rd party monitoring!
For this you will need two things. First, a Datadog account. Second, a machine that will host your Datadog agent, to do the heavy lifting of connecting to your database to extract the metrics you want and to push the metrics into your Datadog workspace.
For this exercise, I had an Azure Linux virtual machine handy that I could use as the agent host, but you can follow quickstart guides available for Azure Virtual Machines to create a new machine or use an existing one. Datadog provides scripts to set up diverse environments, which you can find after you log in to your Datadog account and go to the Agents section in Datadog’s Postgres Integrations page. Following the instructions, you should get message similar to the following.
 datadog agent setup success state
Next step is to configure datadog agent for Postgres specific collection. If you aren’t already working with an existing postgres.d/conf.yaml, just copy the conf.yaml.example in /etc/datadog-agent/conf.d/postgres.d/ and adjust to your needs.
Once you follow the directions and set up your host, port, user, and password in /etc/datadog-agent/conf.d/postgres.d/conf.yaml, the part that remains is to set up your custom metrics section with below snippet.
custom_queries:
       - metric_prefix: azure.postgres.single_server.custom_metrics
         query: select database_name, schema_name, table_name, table_bloat, wastedbytes, index_name, index_bloat, wastedibytes from get_bloat();
         columns:
           - name: database_name
             type: tag
           - name: schema_name
             type: tag
           - name: table_name
             type: tag
           - name: table_bloat
             type: gauge
           - name: wastedbytes
             type: gauge
           - name: index_name
             type: tag
           - name: index_bloat
             type: gauge
           - name: wastedibytes
             type: gauge
Once this step is done, all you need to do is to restart your datadog-agent sudo systemctl restart datadog-agent for your custom metrics to start flowing in.
Setup your new bloat monitoring dashboard for Azure Database for PostgreSQL – Single Server
If all goes well, you should be able to see your custom metrics in Metrics Explorer shortly!
 azure postgresql custom metrics flowing successfully into datadog workspace
From above you can export these charts to a new or existing dashboard and edit the widgets to your needs to show separate visuals by dimensions as table or index or you can simply overlay them as below. Datadog documentation is quite rich to help you out.
 custom metrics added to a new dashboard
Knowing how your bloat metrics are trending will help you investigate performance problems and help you to identify if bloat is contributing to performance fluctuations. Monitoring bloat in Postgres will also help you evaluate whether your workload (or your Postgres tables) are configured optimally for autovacuum to perform its function.
Using custom metrics makes it easy to monitor bloat in Azure Database for PostgreSQL
You can and absolutely should track bloat. And with custom metrics and Datadog, you can easily track bloat in your workload for an Azure Database for PostgreSQL server. You can track other types of custom Postgres metrics easily in the same fashion.
One more thing to keep in mind: I recommend you always be intentional on what and how to collect, as metric polling can impact your workload.
If you have a much more demanding workload and are using Hyperscale (Citus) to scale out Postgres horizontally, I will soon have a post on how you can monitor bloat with custom metrics in Azure Database for Postgres – Hyperscale (Citus). I look forward to seeing you there!

Recent Comments