This article is contributed. See the original author and article here.
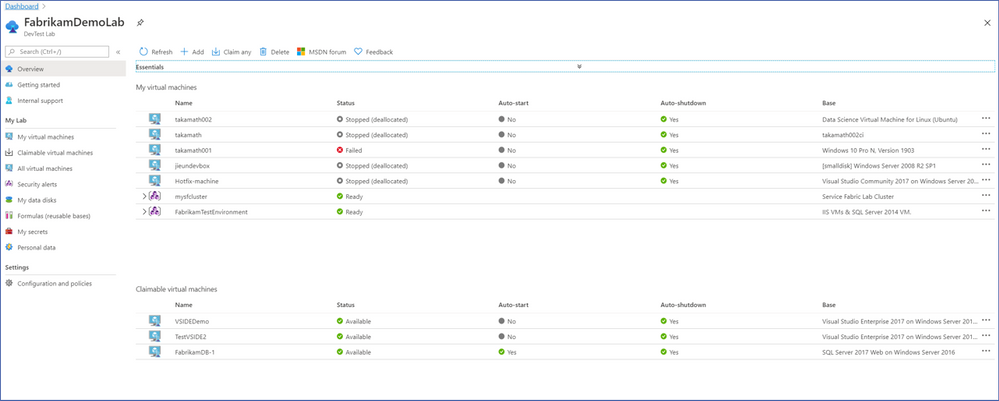
Azure DevTest Labsis now available in the UAE North, Germany West Central and Norway East regions. The support includes full Azure DevTest Labs capabilities. To see the other supported regions for DevTest Labs, see Azure products available by region.
This article is contributed. See the original author and article here.
Introduction
Azure Sentinel Github contains out of the box detections, exploration queries, hunting queries, workbooks, playbooks and much more to help you get ramped up with Azure Sentinel and provide you security content to secure your environment and hunt for threats. In this blog, we will look at various Detections and Hunting Queries published in our public GitHub Repo , analyze and visualize the output to understand current MITRE ATT&CK® coverage, identify gaps etc. The goal is not necessarily to fill every gap but strategically identify opportunities to increase coverage to additional tactics, identify new data sources and develop detections to increase the coverage drastically.
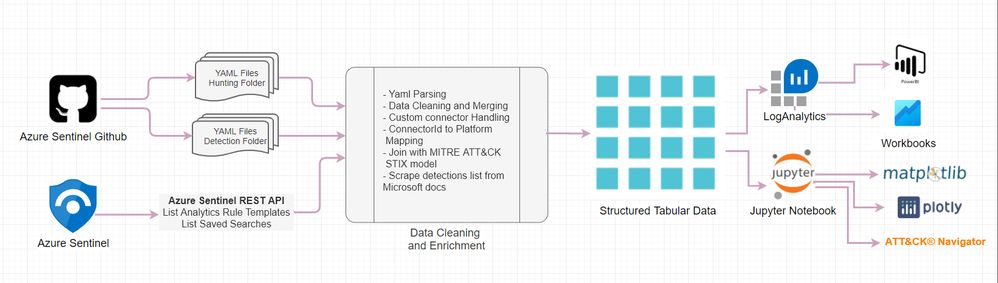
The entire workflow of the process can be visualized as shown in below diagram.
We will start with data acquisition which can be either directly from public community GitHub or you can also point to your private GitHub repository with queries if you have one. Another option is to use Azure Sentinel REST API to query your Azure Sentinel instance for Rule templates and Saved Searches which contains Hunting Queries. Once the data has been acquired, you can load into a dataframe for further cleaning and enrichment with MITRE dataset to finally receive some structured tabular data. The resulting dataset is structured into tabular format which you can also send it back to LogAnalytics into a custom logs table or simply access via externaldata operator from accessible storage.
The datasets can also be visualized via following tools.
With the structured datasets, you can also create ATT&CK navigation layer json files to visualize it as an embedded iFrame within a Jupyter notebook or in independently in a browser.
Data Acquisition
You can retrieve Detections and hunting Queries via below 2 methods:
Download from GitHub.
In the first method, you can directly download template from the public Azure Sentinel GitHub repo. The templates are available within the Analytics pane and must be explicitly enabled and onboarded. Alternatively, you can also point it to your private GitHub repository if available. If you want to read more about Azure Sentinel DevOps process, refer the blog Deploying and Managing Azure Sentinel as Code.
Jupyter notebook will start with Setup section where it will check pre-requisite, install missing packages and set up the environment. Initial cells contains function definitions which will be sequentially executed at later stages. Later you will come at Data Acquisition section.
In this section, you will be prompted for folder location to store the extracted files (Detections and Hunting Queries). By default, it will create a folder named mitre-attack under current folder. You can customize and specify location if you want.
Jupyter notebook will start with Setup section where it will check pre-requisite, install missing packages and set up the environment. Initial cells contains function definitions which will be sequentially executed at alter stages. Later you will come at Data Acquisition section. In this section, you will be prompted for folder location to store the extracted files (Detections and Hunting Queries). By default, it will store in current folder. You can customize and specify location if you want
A python function named get_sentinel_queries_from_github() is created which can be invoked to download the entire repository and only extract selected folder (Detection and Hunting Queries) in previously mentioned location. If you are using your private repo, provide the archived path to your repo in azsentinel_git_url containing Detections and Hunting Queries as child folders.
You can also validate the operation is successful by manually running %ls in both the folders.
Retrieve via Azure Sentinel REST API – Experimental
In this method, you can use Azure Sentinel REST API to query your existing sentinel instance. For more information on using REST API, refer bog Azure Sentinel API 101. This section is currently marked as Experimental, as there are some limitations with output received from API so you won’t be able to get same level of granular details as from above first step. You will have to first authenticate via az login. Refer docs Sign in with Azure CLI if you need more details. Once successfully authenticated, you can generate refresh token and use it with API headers to send REST API query to AlertRuleTemplates and SavedSeaches.
Known API Limitations:
Hunting Query is currently not part of REST API which is GA, but you can use LogAnalytics REST API saved searches and then filter out Hunting Queries.
In both cases, the data retrieved from savedSearches and AlertRuleTemplates, only Tactics is available and not techniques. You may have to pull techniques by joining with Github Dataset if rule template is available.
Below is stripped section of sample output retrieved from REST API – AlertRuleTemplates and hunting queries.
Data Cleaning and Enrichment
Once you acquire the data, you will have to perform various data cleaning steps to be eligible for analysis. All the published rule templates are in YAML format, which is already structured, but the values are often multiple in array or array of dictionary format. You will have to flatten these values to create dataset.
YAML Parsing
In the first step, we will parse all the YAML files and load it into dataframe. The Dataframe is nothing but a Python data structure similar to a spreadsheet in rows and column format. You can read more about dataframe datastructure at Intro to data structures – DataFrame. We have created a Python function named parse_yaml() which will take a folder containing YAML files. We will parse the files from both Detections and Hunting Queries and join both datasets. While doing this operation, we will also create additional columns to extend the YAML schema, such as GithubURL , IngestedDate, Detection Type, Detection Service etc. Finally, when you run this function, with some additional cleanup, it will display status similar to below.
Clean and Preprocess Data
Once you have parsed the yaml files and load it into dataframe, we will further clean and preprocess the data. Example operations in this step can be as detailed below.
Separate existing columns and derive new columns such as ConnectorId, DataTypes.
Separating Null and valid ConnectorId values.
Expanding the columns (ConnectorId, DataTypes, Tactics, relevantTechniques ) which have multiple values assigned as array into separate rows for easier analysis.
Populate new column as Platform which will be based on custom mapping based on ConnectorId values e.g. AWSCloudTrail to AWS etc. Snippet of example mapping is shown as below. This mapping can be changed to customize to your environment.
You can then invoke function clean_and_preprocess_data() to execute this step. This function will return the dataset after cleaning and pre-processing original yaml files. We will also join the fusion dataset to the result dataset to create final dataset.
Below is example output from this step.
Enrich with MITRE Matrix
To find gaps in coverage , our original dataset needs to be joined with master dataset from MITRE ATT&CK matrix . We have created a function get_mitre_matrix_flat() that uses the Python library attackcti underneath with an additional data wrangling steps to return flat table as dataframe.
Below is example output from this function.
Merge preprocessed dataset with mitre datasets
In this step, we will merge our cleaned preprocessed dataset with the Mitre dataset. The resulting dataset will have our detections and hunting queries mapped to existing tactics & techniques, and will have blank lines where there are no matches.
After renaming columns and normalizing the datasets, output will look like the one below.
Remember you can have multiple rows for single detection if it has different values in Platform, ConnectorId, DataTypes. The resulting dataset will have single value in these columns so that it can be effectively analyzed and visualized. You can always aggregate them back into list/array to single row per detection.
Scraping Detection List of Microsoft Threat Protection Portfolio
Microsoft has a variety of threat protection solutions in its portfolio. Depending upon licenses you may have one or multiple of these enabled in your environment. Azure Sentinel natively integrates with these solutions and ingests rules once connected under SecurityAlerts table. Some of these solutions have published documentation on available rules under each on Microsoft docs website. These details can be easily scraped programmatically and create a result dataset. As we find more documentation, we will add other products to this list. Currently below services have rules published.
We have created python function for each of these and sample output are as shown below.
You can later combine all above datasets into single dataframe, and display results as shown below.
This dataframe can be further used in visualization section.
Data Visualization
Now, we have all the data into a structured format, we can visualize it in a number of different ways and tools. The data can be sent back to LogAnalytics into custom table and later be visualized via either PowerBI or native Azure Sentinel Workbooks. Or you can also leverage the power of various Python visualization libraries within a Jupyter notebook. In the below screenshots, we have used matplotlib to visualize it as a heatmap, and used Plotly to visualize it into radar plots, donut charts etc. From the structured dataset, we can also automatically create ATT&CK navigation layer json files. These json files can be visualized as embedded iFrames within a Jupyter notebook or independently in a browser window. Check out below gif walkthrough of visualizations. You can also check the notebook directly for more static and interactive view.
Alerts Table Viewer – Jupyter Widget
Heatmaps using Matplotlib.
ATT&CK Navigator Embedded Iframe view
Radar Plots with Plotly
Donut Plots with Plotly
MITRE ATT&CK Workbook
This is an early version of the workbook available in GitHub which will be updated further for a more mature version and recommended instructions based on the workspace and datasources.
Uploading Results to Azure Sentinel
The data generated by data analysis (Alerts from Microsoft Services and Normalized Azure Sentinel Detections) can be uploaded back to Azure Sentinel. You can use data uploader feature of Msticpy for this. You can read more about it Uploading data to Azure Sentinel/Log Analytics.
Conclusion
Azure Sentinel provides out-of-the box detection and hunting query templates via its public GitHub repo. Currently the repository holds around 362 queries for defenders. Depending on the environment and onboarded data sources, customer can choose these and enable it in their respective Azure Sentinel instance. As all the templates are already mapped to the MITRE ATT&CK Tactics and Techniques, you can analyze and visualize the detection coverage and identify potential gaps. The goal or outcome of this analysis is not necessarily to fill every gap but understand the coverage ,identify blind spots and strategically make decisions to create new detections or onboard new data sources to increase the coverage.
Special thanks to @ianhelle for Sentinel API and @Cyb3rWard0g for ATT&CK Navigation layer section in the notebook.
References
MITRE ATT&CK for Azure Sentinel Resources (Notebook, Supporting Files)
This article is contributed. See the original author and article here.
Our Azure products and services come with comprehensive security features and configuration settings. They are mostly customizable (to a point), so you can define and implement a security posture that reflects the need of your organization. But adopting & maintaining a good security posture goes far beyond turning on the right settings.
Mark Simos, lead Cyber security architect for Microsoft, explored the lessons learned from protecting both Microsoft’s own technology environments and the responsibility we have to our customers, and shares the top 10 (+1!) recommendations for Azure security best practices.
I love that this is broken into people, process, technology and architecture. While statistics prove that capabilities like Multi-Factor Authentication significantly reduce security risk, both people and processes are crucial to protecting from and responding to security threats.
Some of those points look clear and simple on the surface, but may be the hardest to implement in your organization (like assigning accountability for cloud security decisions). Or you may have many of the people and process items already in place for an on-premises environment – these are just as valid for on-prem or hybrid environments too.
Don’t brush this off as too simple and not worth your time. Locking the front door of your house is a simple but effective habit for increasing the security of your home. Complex technology systems can also benefit from organizations having the simplest, most effective people and process elements too.
This article is contributed. See the original author and article here.
IoT with Azure SQL
IoT solutions are generally producing large data volumes, from device to cloud messages in telemetry scenarios to device twins or commands that need to be persisted and retrieved from users and applications. Whether we need to store data in “raw” formats (like JSON messages emitted by different devices), to preserve and process the original information, or we can shred attributes in messages into more schematized and relational table structures, it is not uncommon that these solutions will have to deal with billions of events/messages and terabytes of data to manage, and you may be looking for options to optimize your storage tier for costs, data volume and performance.
Depending on your requirements, you can certainly think about persisting less-frequently accessed, raw data fragments into a less expensive storage layer like Azure Blob Storage and process them through an analytical engine like Spark in Azure Synapse Analytics (in a canonical modern data warehouse or lambda architecture scenario). That works well for data transformations or non-interactive, batch analytics scenarios but, in case you instead need to frequently access and query both raw and structured data, you can definitely leverage some of the capabilities offered by Azure SQL Database as a serving layer to simplify your solution architecture and persist both warm and cold data in the same store.
Raw JSON in the database
Azure SQL supports storing raw JSON messages in the database as NVARCHAR(MAX) data types that can be inserted into tables or provided as an argument in stored procedures using standard Transact-SQL. Any client-side language or library that works with string data in Azure SQL will also work with JSON data. JSON can be stored in any table that supports the NVARCHAR type, such as Memory-optimized or Columnstore-based tables and does not introduce any constraint either in the client-side code or in the database layer.
To optimize storage for large volumes of IoT data, we can leverage clustered columnstore indexes and their intrinsic data compression benefits to dramatically reduce storage needs. On text-based data, it’s not uncommon to get more than 20x compression ratio, depending on your data shape and form.
In a benchmarking exercise on real world IoT solution data, we’ve been able to achieve ~25x reduction in storage usage by storing 3 million, 1.6KB messages (around 5GB total amount) in a ~200MB columnstore-based table.
Optimize data retrieval
Storing large amount of data efficiently may not be enough, if then we’re struggling to extract great insights and analysis from that. One of the major benefits of having battle-tested query processor and storage engine is to have several options to optimize our data access path.
By leveraging JSON functions in Transact-SQL, we can treat data formatted as JSON as any other SQL data type, and extract values from the JSON text to use JSON data in the SELECT list or in a search predicate. As Columnstore-based tables are optimized for scans and aggregations rather than key lookup queries, we can also create computed columns based on JSON functions that will then expose as regular relational columns specific attributes within the original JSON column, simplifying query design and development. We can further optimize data retrieval by creating regular (row-based) non clustered indexes on computed columns to support critical queries and access paths. While these will slightly increase overall storage needs, they will help query processor to filter rows on key lookups and range scans, and can also help on other operations like aggregations and such. Notice that you can add computed columns and related indexes at any time, to find the right tradeoff for your own solution requirements.
Best of both world
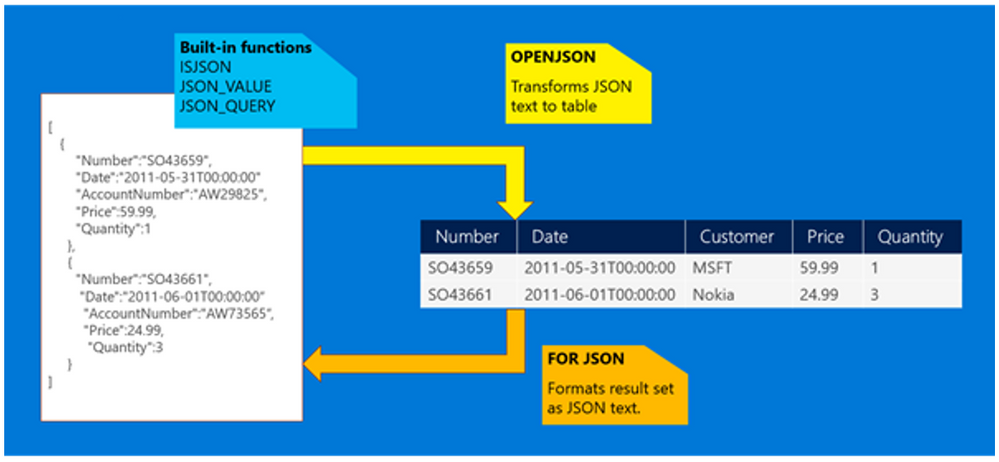
In case your JSON structure is stable and known upfront, the best option would be to design our relational schema to accommodate the most relevant attributes from JSON data, and leverage the OPENJSON function to transform these attributes to row fields when inserting new data.
These will be fully relational columns (with optimized SQL data types) that can be used for all sort of retrieval and analytical purposes, from complex filtering to aggregations, and that will be properly indexes to support various access paths. We can still decide to keep the entire JSON fragment and store it in a VARCHAR(max) field in the same table if further processing may be needed.
This article is contributed. See the original author and article here.
IoT with Azure SQL
IoT workloads can be characterized by high rates of input data, on both steady and burst streams, to be ingested from devices. A common design pattern for relational database systems involves a “landing zone” (or staging area) which is optimized for “absorbing the shock” of this high and spikey input rate, before data will be flowing into their its final destination (usually one or more tables) which instead is optimized for persistence and analysis.
There are few knobs we can use to optimize our data models for these very different purposes, where likely the most evident involves different indexing approaches (a light one to privilege higher ingestion rate versus a more comprehensive to favor query and retrieval), but Azure SQL also provides very specialized capabilities like In-memory OLTP tables and Columnstore Indexes that can be used together to implement shock absorber patters in IoT solutions:
In-memory OLTP
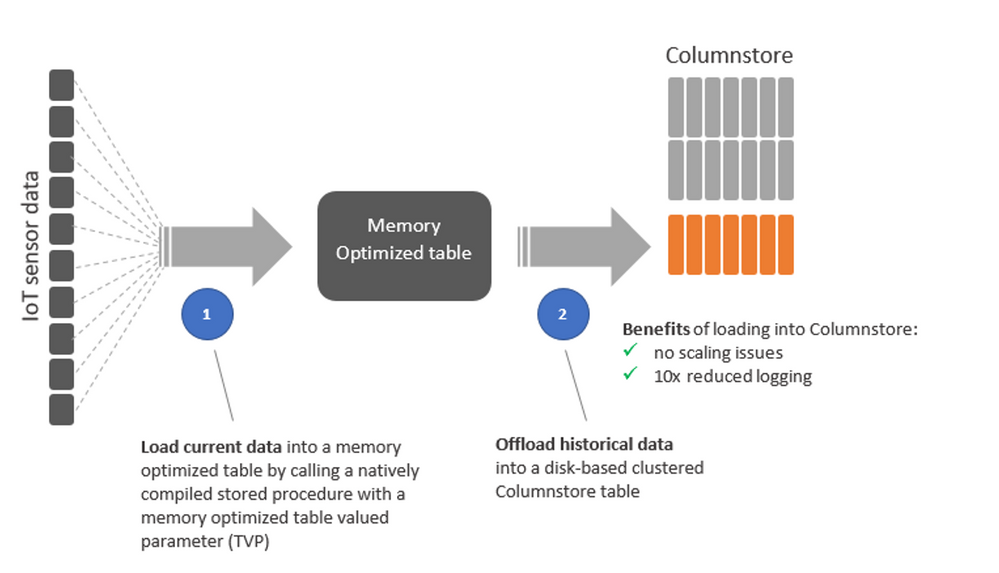
By leveraging In-memory OLTP tables (only available on Premium/Business Critical databases) as a landing zone for incoming streams of events and messages from IoT devices, we can largely eliminate latching and locking contention that can affect regular tables (subject to things like last page insert scenarios). Another benefit of this approach is the ability to reduce the overhead of transaction log operations by minimizing IOs for SCHEMA_ONLY tables (where the risk of losing some events in case of a failure is acceptable) or reducing the impact of log updates for tables with schema and data persistence. By combining these capabilities with natively compiled stored procedures, we can also improve execution performance for all critical data management operations on ingested data. A common solution architecture in this space would likely include an event store (something like Azure IoT Hub or EventHub) where events will flow from devices, and an event processor pulling events from the store and using a memory optimized table valued parameter, batching 100s or 1000s of incoming invents into a single data structure, greatly reducing the number of database roundtrips and improving throughputs to potentially millions of events per second.
Columnstore Indexes
With billions of events potentially ingested per day, max In-memory OLTP tables size (which is proportional to Azure SQL compute size utilized, 52GB on BC_Gen5_40 database as an example) will easily become a limit, so a very common approach is to leverage those for the “hot” portion of the dataset (basically, newly ingested data), while offloading events to disk-based tables, optimized for persistence and analytics, through a bulk loading process to a Columnstore-based table that can, for example, be triggered by time or data volume.
By picking up the right batch size (e.g. between 102,400 and 1,048,576, depending on our events generation rate and logic) we can maximize efficiency by eliminating the need for moving new data rows into Columnstore’s delta rowgroup first, waiting for the Tuple Mover to kick in and compress them, and going instead straight to a compressed rowgroup reducing logging and increasing overall throughput easily by 10x, while also achieving similar level of data compression (which is a significant side effect while you’re dealing with 100s of billion events).
Once offloaded to a Columnstore-based table, events can be efficiently analyzed by running aggregations and time-series analytical workloads without impacting the ingestion process.
Benefits
By adopting this design pattern for your IoT solutions, you can leverage a familiar relational engine environment while scaling to billions of events ingested per day and terabytes of compressed historical data stored. As a reference, you can start by looking at this packaged sample where we achieved a sustained 4.2 million events per second rate on average on a M-series 128 cores database.
This article is contributed. See the original author and article here.
IoT with Azure SQL
IoT solutions usually include several components that spans from device communication and management to event processing and data ingestion and analysis. Deploying all these components independently on compute, network and storage based infrastructures can be a complex and time consuming task, but nothing compared to manage, monitor and operate them at significant scale.
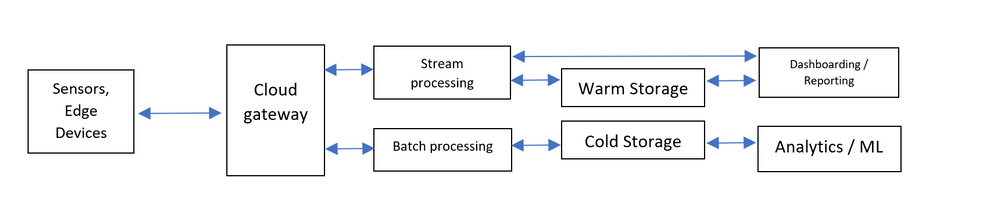
If we look at a canonical IoT architecture, like the above, we can identify and describe roles and responsibilities of each of these components:
Individual and edge devices, from intelligent sensors to industrial PCs aggregating multiple signals, send telemetry messages and receive commands from the cloud.
Cloud gateway is managing bi-directional communications with devices, queueing events and messages, but usually also device provisioning and management.
Event processing is usually performed as real-time streaming for capturing low latency events like alarm and thresholds to be plotted on a dashboard, but can also be through batch processing for large amount of data that can be stored for future analysis.
Warm storage, plays a role in persisting low latency events and messages that need to be ingested efficiently and at a high rate, but also be query-able concurrently by a combination of point lookup and aggregated queries, mostly comparing trends and values over time (hybrid workload, or HTAP).
Cold storage is optimized for large data volumes at reasonable cost, most likely retaining raw original messages that can be further processed and curated by Big Data and analytical engine to extract insights.
Thankfully, Azure platform offers a full portfolio of PaaS services that plug in to each other seamlessly and are covering all the needs of a modern and scalable IoT solution, as the following architectural diagram represents:
From device connectivity and management, IoT Hub provides secure and reliable communication for your Internet of Things (IoT) applications, connecting virtually any device and offering comprehensive per-device authentication options, built-in device management, predictable performance and availability.
IoT Hub, built on Azure Event Hub as event store, can manage from few 100s to million of events per second, that can be consumed through several APIs and services.
Azure Stream Analytics, as an example, is a real-time analytics service designed for mission-critical workloads to build end-to-end serverless streaming pipelines with just a few clicks. With Stream Analytics, your IoT solution can analyze and react in real time to specific event patterns or thresholds generated by your device fleet, and be used to populate dashboard and reports capturing low-latency phenomenon in the system. Stream processing results can also be persisted directly in Azure SQL’s disk-based or In-memory Optimized tables for low latency and high throughput, to be subsequently queried and analyzed. Azure Stream Analytics uses a SQL dialect, extensible with custom code, to cover the most advanced scenarios, and can scale up and down to cover the most challenging workloads.
To process the remaining vast amount of all the events generated by devices that needs to be captured, stored and analyzed, you can used another PaaS service like Azure Functions, an event-driven serverless compute platform that natively connects with IoT Hub event store and can consume batches of incoming messages and process them following your customizable logic written in one of the many programming languages supported. Azure Functions can be bound to the incoming message flow that will trigger processing on one end, and can use Azure SQL client libraries on the other end to define data shape and form before persisting what’s needed in relational or non-relational format in the database.
Azure SQL proven to be able to ingest million of events per second in this scenario, combining In-memory technologies to speed up data insertion with Columnar index structures that can help optimizing storage utilization (through up to 100x compression) and support for large aggregation and time-series analysis.
You have multiple options to scale an Azure SQL Database instance, depending on your workload and requirements, Both single databases and managed instances can be scaled up (for compute or storage, independently) or scaled out, through read scale-out replicas or database sharding.
Some of the features you may find relevant while designing IoT solutions with Azure SQL Database are:
A single instance can scale up to 128 vCores (with M-Series hardware configuration) or 100 TB (with Hyperscale service tier). This means ingesting million of messages/sec and storing trillions of them in a single database instance, simplifying your data management operations.
Multiple secondary replicas can be added to scale out read workloads and support 10Ks of concurrent queries on ingested data.
Where additional scalability is required, Azure SQL Database provides Elastic Database tools to partition messages (e.g. using device or message ID sharding keys) across multiple database instances, providing linear scale for compute and storage.
When ingesting messages from 100Ks devices, Azure SQL Database provides the ability to batch multiple requests into a single database interaction, increasing overall scalability and maximizing resource utilization.
In-Memory technologies in Azure SQL Database let you achieve significant performance improvements with various workloads, including transactional, analytical and hybrid (HTAP). In-memory OLTP optimized tables help increasing number of transactions per second and reduce latency for scenarios like large data ingestion from IoT devices. Clustered ColumnStore indexes help reduce storage footprint through compression (up to 10 times) and improve performance for reporting and analytics queries on ingested messages.
Azure SQL Database scales well on both relational and non-relational data structures. Multi-model databases enable you to store and work with data represented in multiple data formats such as relational data, graphs, JSON/XML documents, key-value pairs, etc and still benefit from all capabilities described before, like In-memory technologies. See more on multi-model support.
In many IoT scenarios, historical analysis of ingested data is an important part of database workload. Temporal Tables are a feature of Azure SQL Database that allows to track and analyze full history of your data points, without the need for custom coding. By keeping data closely related to time context, stored data points can be interpreted as valid only within the specific period. This property of Temporal Tables allows for efficient time-based analysis and getting insights from data evolution.
Other services within the Azure platform can be plugged-in with minimum effort while building end-to-end IoT solutions, a great example can be Azure Logic Apps. Logic Apps can help automating critical workflows without writing a single line of code, by providing an immense set of out-of-the-box connectors to other services (like Azure SQL) and the ability to graphically design complex process that can be used in areas like data integration, management or orchestration. Things like triggering dataset refresh in PowerBI when certain events are happening at the database level become very simple and intuitive to implement thanks to Logic Apps.
Last but not least, Azure Machine Learning can be used to create and train complex ML model using datasets processed from IoT data and events, and hosted on Azure SQL or Azure Blob Storage for data scientists to use.
Who’s using this?
RXR Realty is the third-largest real estate owner in New York City, with over 25 million square feet of space across the tri-state area, including some of the most iconic addresses in Manhattan. When the COVID-19 pandemic hit, the company needed a way to integrate new safety measures for tenants after its buildings reopened for business. Working with key partners McKinsey & Co., Infosys, Rigado, and Microsoft, RXR used Microsoft Azure to create and deploy an intelligent, secure, hyperscalable solution—in just a few months.
The solution is named RxWell™—a comprehensive, public-health–based, data-driven program that merges physical and digital assets to help keep employees informed and supported during the “new abnormal” and beyond. Powered by the Internet of Things (IoT) and the intelligent edge, and firmly rooted in responsible artificial intelligence (AI) principles, RxWell combines real-time computer vision, sensors, AI, mobile apps and dashboards, and in-person service offerings. And Azure is making it all possible.
RXR Realty is using Azure SQL Database as warm storage where events flow through Azure Stream Analytics and Azure Function to power multiple dashboards and reporting applications on mobile and embedded devices on-site.
Schneider Electric, and his partner ThoughtWire, created an end-to-end solution for facilities and clinical operations management in healthcare settings. The solution uses Internet of Things (IoT) technology and Microsoft Azure cloud services to help hospitals and clinics reduce costs, minimize their carbon footprint, promote better patient experiences and outcomes, and increase staff satisfaction. The ThoughtWire application suite uses Azure Virtual Machines infrastructure as a service (IaaS) capabilities to run virtual and containerized workloads that support the ThoughtWire digital twin platform and Smart Hospital Suite in Azure. It also uses Azure SQL Database, which provides the right security controls for solution benefits like encrypting data at rest.
HB Reavis uses the power of Microsoft Azure IoT Hub, Azure SQL Database, and Stream Analytics. It captures complex IoT metrics essential for monitoring and analyzing diverse aspects of efficient workspace, such as office utilization, environmental insights (CO2, temperature, humidity), and general team dynamics and interactions. Once this data is collected, the platform converts it into actionable insights and visualizes the results on interactive Microsoft Power BI dashboards.
VERSE Technology is building an edge-to-cloud solution based on Microsoft Azure for one of the world’s largest baking companies, Grupo Bimbo. In the past year it has converted 15 factories, with many more scheduled soon. Now, with all this data being processed, analyzed, and visualized in real time, Bimbo can get an unprecedented, accurate picture of the company’s production process and begin transforming its business.
VERSE has designed a connected cloud solution for Bimbo based on Azure. Azure IoT Hub connects all the data streamed to the platform from different edge devices and sensors. Azure SQL Database is the highly scalable solution for storing RPMs, temperature, gas consumption, and more. This first phase encompasses more than 1,000 devices at the edge, with a range of communication protocols––RF, cellular, and Wi-Fi according to the needs of the location. The company plans to expand to more than 10,000 devices soon.
In this series, we’ll go dig deeper into how to build scalable and efficient IoT solutions leveraging Azure SQL, here are other articles on this subject:
.PNG")


Recent Comments