by Contributed | Oct 7, 2020 | Azure, Technology
This article is contributed. See the original author and article here.
Final Update: Wednesday, 07 October 2020 20:09 UTC
We’ve confirmed that all systems are back to normal with no customer impact as of 10/7, 19:00 UTC. Our logs show the incident started on 10/7, at approximately 18:30 UTC and that during the 30 minutes that it took to resolve the issue most Application Insights and Log Analytics customers experienced outages with various services.
Root Cause: The failure was due to a back-end networking issue that caused problems with a large number of Azure services.
Incident Timeline: 0 Hours & 30 minutes – 10/7, 18:30 UTC through 10/7, 19:00 UTC
We understand that customers rely on Application Insights and Log Analytics as critical services and apologize for any impact this incident caused.
-Jack Cantwell
by Contributed | Oct 7, 2020 | Azure, Technology
This article is contributed. See the original author and article here.
This year’s PASS Summit has gone virtual and is taking place November 10-13. PASS Summit is the largest gathering of data professionals focused on the Microsoft platform, and this year, it will be more accessible than ever, giving attendees the opportunity to learn from data professionals around the world right from their very own home.
Not only will the Azure SQL/ SQL Server teams be delivering 25+ sessions, but there will also be opportunities to connect directly with the product groups through:
- Microsoft Azure Data Clinic: Attendees will be able to access the virtual clinic booth to schedule 1:1 time with Microsoft engineers to get their questions answered.
- Focus Groups: The week following PASS Summit (November 16 -20), attendees will be able to meet with the product teams to provide feedback on topics related to the technical roadmap for Microsoft data platforms, trends/drivers facing your organizations or industry, and priorities to move your business forward. To sign up for one of our focus groups, click here.
As a bonus – the first 1,500 registrants for PASS Summit will receive Bob Ward, Principal Architect on the Azure Data team, new eBook, Azure SQL Revealed: A Guide to the Cloud for SQL Server Professionals.
More details about the events are being updated directly on the PASS Summit website but in the meantime, you can start planning which Azure Data sessions you would like to attend with my quick reference list below:
Speakers
|
Title
|
PRE-CONFERENCE SESSION |
Bob Ward, Anna Hoffman
|
The Azure SQL Workshop
|
CONFERENCE SESSIONS
|
Ajay Jagannathan, Anna Hoffman |
Azure SQL: What to use when and what’s new |
Anna Hoffman, Alain Dormehl, Emily Lisa |
Azure SQL Built-in High Availability |
Bob Ward |
Inside Waits, Latches, and Spinlocks Returns |
Bob Ward, Denzil Ribeiro |
Inside Azure SQL Database Hyperscale |
Borko Novakovic, Srdan Bozovic |
Modernize your SQL applications with the recently enhanced version of Azure SQL Managed Instance |
Buck Woody |
Machine Learning with SQL Server – From the Edge to the Cloud |
Buck Woody |
SQL Server Big Data Clusters Architecture |
Davide Mauri, Silvano Coriani |
Azure SQL is the best choice for building back-end REST API: discuss! |
Kevin Farlee |
HA/DR in SQL Server, Putting the puzzle pieces together and planning for the future |
Michelle Wallig |
The future of ML services on hybrid |
Morgan Oslake |
Maximize performance for less cost using Azure SQL Database serverless |
Mukesh Kumar, Raj Pochiraju |
Database modernization best practices and lessons learned through customer engagements |
Pam Lahoud, David Pless |
Best Practices for deployment of SQL Server on Azure Virtual Machines |
Pedro Lopes, Joe Sack |
Azure SQL: Path to an Intelligent Database |
Pedro Lopes, Pam Lahoud |
Practical Guidance to Make Your Tier-1 SQL Server Roar |
Raj Pochiraju, Amit Banerjee |
Lift and shift your SQL Servers to Azure SQL Virtual Machines |
Raj Pochiraju, Mukesh Kumar |
App Modernization and Migration from End to end, using data migration tools and Azure SQL |
Ron Matchoro, Rohit Nayak, Mirek Sztajno, Jakub Szymaszek |
What’s New in Security & Networking for Azure SQL |
Sanjay Mishra, Abdul Sathar Sait |
Elevation to the cloud – How our customers are using Azure SQL |
Tejas Shah, Amit Khandelwal |
Deployment, High Availability and Performance guidance for SQL Server on Linux in Azure IaaS ecosystem |
Umachandar Jayachandran |
Taking your data hybrid with Azure Arc enabled data services |
Vasiya Krishnan |
Extend SQL applications to the edge with Azure SQL Edge |
Vicky Harp, Ken Van Hyning |
What’s New in the SQL Server Tools? |
Vin Yu, Amit Khandelwal |
SQL Server Containers in Action |
We’re looking forward to seeing you online! Tweet us at @AzureSQL for sessions you are most excited about.
by Contributed | Oct 7, 2020 | Azure, Technology
This article is contributed. See the original author and article here.
When monitoring the health of your applications written for Azure Sphere, you need to be able to diagnose bugs and errors. During application development, you can use a debugger, print statements, and similar tools to help find problems. However, when devices are deployed in the field, it becomes more challenging to debug an application, and a different approach is needed. For example, an application might unknowingly crash or exit, leaving you unable to detect the reason for the occurrence. Tools like the CLI command can help you gain a better understanding as to why your application crashed or reported an error.
We recently released additional documentation to help you interpret error reports, along with a new sample tutorial demonstrating how to analyze app crashes. Read on to find out about the new tools and additional ways to help make debugging easier in the future.
Automatically generated error reports
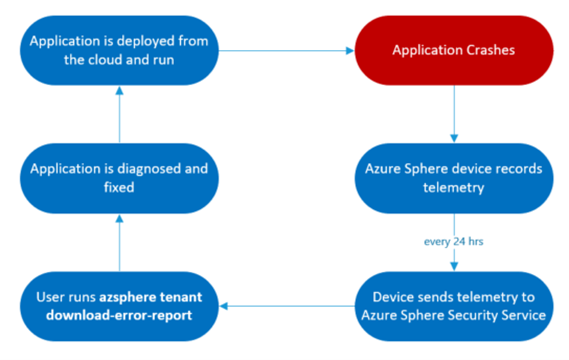
Whenever an issue occurs on your device, such as an app crash or an app exit, the device logs an error reporting event. These events are uploaded to the Azure Sphere Security Service (AS3) daily, and you can get a csv file containing the error reporting data by running azsphere tenant download-error-report. The csv file contains information on errors reported by devices in the current tenant from the last 14 days. The reports provide system-level error data that a traditional application would not be able to collect on its own. A sample error reporting entry in the csv is:
AppCrash (exit_status=11; signal_status=11; signal_code=3; component_id=685f13af-25a5-40b2-8dd8-8cbc253ecbd8;
image_id=7053e7b3-d2bb-431f-8d3a-173f52db9675)
This example shows an error event as it appears in the log. Here, an AppCrash occurred; the additional information includes the exit status, signal status, signal code, component id, and image id. These details are helpful when it comes to diagnosing an error in an application. See Collect and interpret error data in the Azure Sphere documentation to understand how to use this information to debug. Additional interpretation details have recently been added.
In addition to the CLI command azsphere tenant download-error-report, you can also use the Public API to acquire the same error reporting information. The API returns a JSON object, containing the same error reporting information as the csv, that you can parse according to your needs.

The typical lifecycle for using error reporting data to remotely detect a problem with your application in the field and deploy a fix OTA.
New tools for diagnosing applications
Azure Sphere recently released an Error Reporting Tutorial. This tutorial demonstrates how you can interpret expected app crashes and app. The tutorial lets you simulate application crashes and exits for an Azure Sphere and test the Azure Sphere error reporting functionality as well as experiment with sample error reporting data. Within 24 hours after you run the tutorial, you can download a csv that contains error reporting events, and you can then follow the instructions in Collect and interpret error data to learn how to use the csv to diagnose application failures.
Going forward
Exit codes
To further improve error diagnosis, try implementing exit codes in your application code. Exit codes are important as they are reported directly from the application and help you determine where something went wrong in your app. Location-specific exit codes identify exactly where the exit happened. The exit codes will appear in the error reports and can be compared with your code to better understand where the application exited and why. By following the steps and example in the exit codes documentation, you can easily implement exit codes and as a result be more equipped to debug and fix issues in the future. The highlighted portion of the sample error reporting entry below shows how exit codes appear in error reports:
AppExit (exit_code=0; component_id=685f13af-25a5-40b2-8dd8-8cbc253ecbd8;
image_id=0a7cc3a2-f7c2-4478-8b02-723c1c6a85cd)

Exit code definitions from the Error Reporting tutorial.
Watchdog timers
Another useful tool is the watchdog timer. If an application becomes unresponsive, the system timer will act as a watchdog and restart the application. When the watchdog is set and expires, it raises a SIGALRM signal that the application is purposely unable to handle. As a result, the application terminates (or crashes) and restarts. The highlighted portion of the sample error reporting entry below shows how a watchdog timer alarm appears in an error report. Signal status 14 corresponds to a SIGALRM, indicating that the application crashed because a watchdog expired:
AppCrash (exit_status=11; signal_status=14; signal_code=3; component_id=685f13af-25a5-40b2-8dd8-8cbc253ecbd8;
image_id=7053e7b3-d2bb-431f-8d3a-173f52db9675)
Next steps
We have updated and published documentation to assist you in diagnosing your Azure Sphere applications:
- For more information on the CLI command azsphere tenant download-error-report to acquire your error report in csv form see our Reference page (and Public API if you prefer to acquire a json object).
- See Collect and interpret error data to understand how to use the information provided in the report to diagnose your application.
- Try out the Error Reporting Tutorial for a demonstration on how you can interpret app crashes and app exits.
See the exit codes and watchdog timer documentation for ways to further assist yourself in the future when writing applications.
About Azure Sphere
Azure Sphere is a secured, high-level application platform with built-in communication and security features for internet-connected devices. It comprises a secured, connected, crossover microcontroller unit (MCU), a custom high-level Linux-based operating system (OS), and a cloud-based security service that provides continuous, renewable security.
by Contributed | Oct 7, 2020 | Azure, Technology
This article is contributed. See the original author and article here.
Overview
Planning a network security Proof of Concept (POC) in your Azure environment is an effective way to understand the risk and potential exposure of a conceptual network design and how the services and tools available in Azure may be used for improvement. This is the first part of a series of steps to check in validating your conceptual design scenarios.
At the end of this article, you will be able to put a process map on your POC, know the type of resources required and have an idea of the implementation strategy to use. Keep it simple.
Azure network security involves mandatory and continuous improvement processes for workload protection. The effort to improve the network security posture of every client is a combination of both the Azure team and the customer-shared responsibility in the cloud. For more information, see the Azure network security controls documentation.
Azure resources also have a 30-day trial access that may be used to validate security with a POC. This is useful to note when making budgetary commitments.
Scope
In this article, we discuss the steps you should consider when performing a security POC (Network, Container, Apps) to meet regulatory and compliance standards.
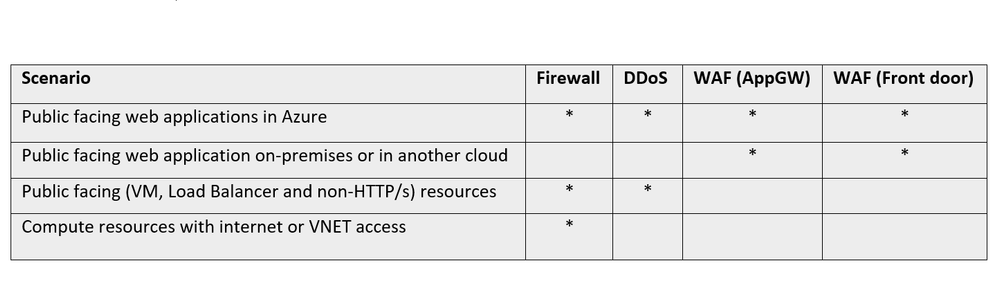
When testing any tool, it will be necessary to determine what capabilities are expected, to achieve a good result. To get started, here are some scenarios that could benefit from layers of network security.

The different standards that guide the resources used by your service offerings such as NIST SP 800-53 R4, SWIFT CSP CSCF-v2020 and CIS, and how they align with compliance, should also be considered as you go along in the exercise.
Take advantage of Azure Security Benchmark to establish guardrails for your security configurations.
Understand your network
As the network administrator/manager, having an adequate understanding of the layout of your network provides insight into the security requirements. The requirements for the different scenarios may be considered by keeping the focus on the objective of your test:
Architecture: Cloud native or hybrid solutions. More information on Cloud design patterns
Resources: Network and Application layer resources. Decide on the focus of your test.
Infrastructure: Storage, Computing etc. See more on Azure infrastructure
Accessibility: Multi-factor auth, JIT, Role Permissions, RDP/SSH, Azure Bastion etc.
Connectivity services: Virtual WAN, ExpressRoute, VPN Gateway, Virtual network NAT Gateway, Azure DNS etc. More information on Connectivity services
Permissions
Access to resources should be role-based when managing user identities. Conditional access should be granted to resources based on device, identity, assurance, network location, and grant temporary access for other connections. In addition, use JIT and MFA and follow the principle of least privilege assignment.

Implementation strategy
It is pertinent to understand which direction your proof of concept should take, such as: how long is the scheduled plan? Is there a dev environment or cluster dedicated to this? What priorities are attached to the application or network infrastructure? A few important guidelines should include:
– Build a security containment strategy: Align network segmentation with overall strategy and centralize network management and security. Develop and update the security incident response plan as the network changes.
– Define success index: This is a practical way to measure the work to be done and set the right expectation from the outcome of the process. Are you testing for feasibility, access control or confirming mitigation? How would you define a successful POC?
– Write down the contributors or administrators for each workload/resource for follow-up and task designation. It is pertinent to know who is assigned to a network contributor role or to a custom role and who has the appropriate actions listed for the permissions.
– Establish a timeline for the requirements that may be discovered during the POC.
Proof of Concept scenarios
Once the guidelines and framework from above have been established, the next step is to map out the scenario. There are different examples of scenarios that may be considered. If unsure, you can look through this article on Azure network security best practices to see areas that need improvement and then work on a POC to address the problem.
Other common examples that an administrator/manager may consider for a POC include:
Network segmentation
The logical partition of the network is achieved using subnets, subnets peering and virtual networks to define resource accessibility by roles, users, functions, resource types, user-defined routing, location etc. Examples include:
– Restrict access within a Virtual network by using Network Security Groups and Firewall
– Access on-prem resources, cloud and filter internet traffic by creating User-Defined Routes in Azure Firewall
Web Application security
Requests served by HTTP and HTTPs require different components for the appropriate response type. You may be looking to test for layer 7 attack validation and mitigation or doing a post deployment check.
The application may require user-managed or system-managed certificates, protocol support (IPv6 and HTTP/2 traffic), bot management. An administrator may be looking to validate security prone issues. Example of POCs for web application security include:
– Web-App vulnerability protection from SQL injection
– Geo-based access control and rate limiting
Ingress and Egress traffic management
This includes a series of tests around how traffic is managed from one node to the other within and outside the network. Examples of POCs might include remote connectivity, intra-VLAN routing, forced tunneling, geolocation management, content distribution etc. Examples of this POC include:
– DNAT access by RDP protocol to Windows client
– Bastion connectivity to a virtual network
– Path-Based Routing for resources in a backend pool.
– Secured Virtual Hub to connect virtual WAN resources.
DDOS attack simulation
Insights into how resources with public facing interfaces handle DDOS attacks and deny access to legitimate users is a common POC. Validation of your threshold values, how your Azure networking environment responds to volumetric or protocol attacks, and the report generation are common instances you may want to review. Examples of this POC include:
– Simulate DDoS attack through a Microsoft approved partner.
– Rate limiting access for a specific IP address.
Monitor the process

Monitoring the proof of concept behavior as you perform the process is essential for aggregating feedback.
Log Analytics is the primary tool in the Azure portal for writing log queries and interactively analyzing their results.
NSG flow Logs provide information about the flow of IP addresses in NSGs. It is vital and highly recommended for more understanding of your network traffic.
Also, confirm that diagnostic logging is enabled for your resource through the Azure portal. This could take a few minutes to show the results during a test.
Diagnostic logs provide insight into Azure operations that were performed within the data plane of an Azure resource. Follow this link for more on diagnostics logging.
Network Performance Monitor is a cloud-based hybrid network monitoring solution that could be used to monitor network performance between various points in your network infrastructure and connectivity to application endpoints. Follow this guideline to set up performance monitoring, Service Connectivity monitoring and Express-route monitoring.
For a complete guide on monitoring your network, follow this 5 minute start video guide.
Conclusion
There are many reasons why you may want to do a POC. This series is focused on creating a direction for a network security POC for layer3-4 and layer 7. Once you are clear on what you are testing for (e.g. WAF performance, DDOS mitigation/response or custom rules), proceed to the implementation strategy.
In summary, align your network segmentation model with the enterprise segmentation model for your organization. Delegation models that are well aligned improve automation and make for quick fault isolation. A recommended approach for production enterprise is to allow resources to initiate and respond to cloud requests through cloud network security devices.
As a rule, always adopt a Zero Trust approach.
(In the next part of this series, we build an environment to do a POC, using some of the examples in the Proof of Concept scenarios mentioned in this blogpost. You will be able to follow the steps in the article to do some POC examples)
by Contributed | Oct 7, 2020 | Azure, Technology
This article is contributed. See the original author and article here.
Abstract
This is common mistake and observation. Most of the time customers ignore Load testing for their web based applications keeping too much trust on cloud scale infrastructure and services. It is good to trust on cloud scale model however not every application problem can be solved by just scaling underlying cloud infrastructure to support growing volume.
Cloud scalability should be entrusted with proper testing framework for your application and this is where “load testing” performs an important role. Load testing is really important to understand “how your application is performing under the expected load, unexpected load, sudden spiked load”.
While working with few of the big organizations in recent times I have observed “Load testing” has been made too much of a complex thing to achieve. In reality it is simple if you do it in part and test individual components of the system. Most critical part of the today’s software systems is API layer.
In this post we will see how an Open Source Tool “Vegeta” combined with power of Azure Container Instance can help you to test your individual APIs or web app.
Let’s attack!
What is Vegeta?
Vegeta is a versatile HTTP load testing tool built out of a need to drill HTTP services with a constant request rate. It can be used both as a command line utility and a library.
Source: https://github.com/tsenart/vegeta
It is written in Go language!
Vegeta seems to be quite popular and very active in OSS community. Github stars speak for itself! This tool have got stunning 15.5K github stars as of writing. That is impressive!
The usage manual is on Github and official docker image is also present here – Vegeta Docker Official Image
Why Azure Container Instance for load testing?
Most of the load testing tools I have seen uses VM based solution, or Kubernetes based solution in today’s world. Ideally load test may not be required to run 24x7x365. It is momentary to test the system and you will always want your infra to shutdown/ removed after testing is done. This is where Azure container instance fits perfectly. Below are few more benefits I see –
- When you use VM, some part of compute [cores] and memory [RAM] is still used with VM functioning [OS operations] and you don’t get full capacity of underlying VM for load testing. With container instance if you assign 1 core 2GB memory then complete capacity is used only for load testing.
- While you can automate VM shutdown/ start etc. if it is missed then cost is still incurred. Container instance is charged per second and as soon as it is terminated there is no charge. This makes very cost effective solution for incremental load testing.
Single URL testing with Vegeta and Azure Container Instance
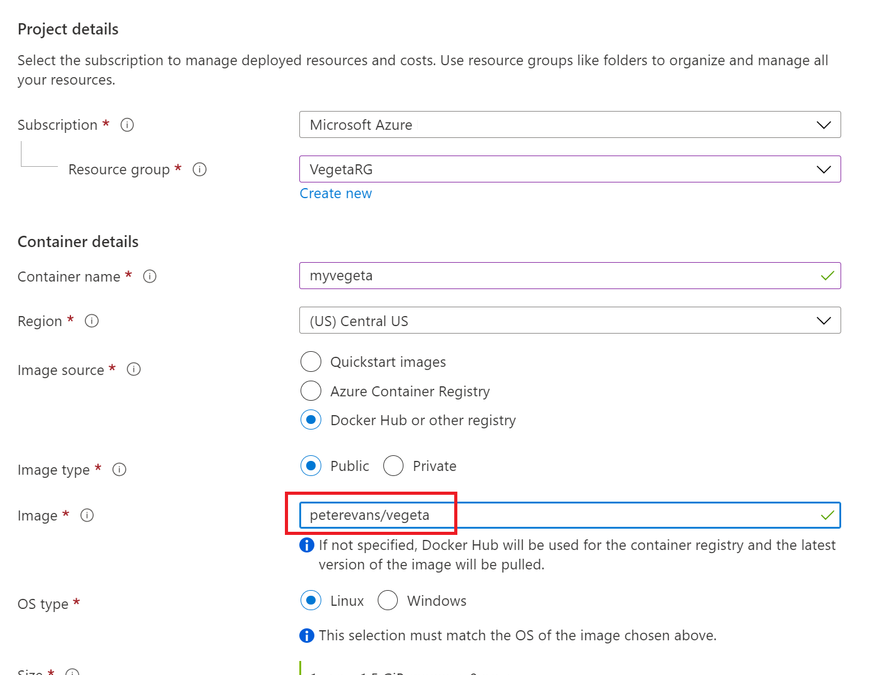
Go to Azure portal and provision the Azure container Instance. Make sure you specify the docker URL of Vegeta as sown below –
 Create Vegeta – specify vegeta docker image
Keep the default setting on networking tab and move to Advanced tab. On the advanced tab we have an option to specify first commands to execute in container. The main purpose of this option is to provide defaults to an executing container.
This is more of docker feature than container instance.
This is where we will provide below command to start the Vegeta Attack to URL of our choice.
"sh", "-c", "echo 'GET https://www.sanganakauthority.com/' | vegeta attack -duration=10s -rate=10 | tee results.bin | vegeta report"
In above command we are hitting my personal blog for continuous 10 seconds, with 10 requests per second. storing the result in results.bin file.
Go ahead and create the container instance. Refer to screenshot below for command view –
 Specify Vegeta command in advanced tab
The container is created and terminated after 10 seconds of execution. If we click on Log as directly see the output of results.bin file as shown below –
 Vegeta output on shell
Important aspect to record from this load test result is min latency as 43.351 ms and max latency recorded was 573.565.ms. The total success rate is 100%. Means all the requests that were sent for testing all of them were successful. Similarly status code is 200. This is where you can see how many request were successful and ho many of them were non 200. Also if any error is generated then error text is shown at the bottom. In our case there is no error received.
Need less to say, you are charged only for duration of 10 seconds along with CPU and memory consumed. Pretty cool!
Vegeta attack output in JSON on container instance
The above output we received in shell. Most of the time you may want to receive the output in JSON to consume into some other reporting systems. You can output the Vegeta attack in JSON as follows –
"sh", "-c", "echo 'GET https://www.sanganakauthority.com/' | vegeta attack -duration=10s -rate=10 | tee results.bin | vegeta report -type=json"
 Vegeta json output
Vegeta Attack, and authentication header on container instance
Vegeta attack can also be used to load test APIs which require an authentication token. Refer to below command that can be used with Azure container instance to load test APIS with authentication header –
"sh", "-c", "echo 'GET https://myapi.com' | vegeta attack -header "authorization: Bearer <your-token-here>" -duration=10s -rate=10 | tee results.bin | vegeta report"
Use case
You have an api hosted behind Azure API management. You want to perform load test for your Azure API Management link which required subscription key in the header. This is where we can use Authentication header based Vegeta attack as below –
"sh", "-c", "echo 'GET https://myapi.com' | vegeta attack -header " Ocp-Apim-Subscription-Key: <your-Azure API-Management-subscription-key-here>" -duration=10s -rate=10 | tee results.bin | vegeta report"
Similarly this can be used for load testing with Azure API Management configured with “Validate JWT” policy.
Conclusion
Vegeta attack with Azure Container instance is the most flexible way of load testing in my opinion. Above post just demonstrate the same. Hope you find this useful.
by Contributed | Oct 7, 2020 | Azure, Technology, Uncategorized
This article is contributed. See the original author and article here.
Together with the Azure Stack Hub team, we are starting a journey to explore the ways our customers and partners use, deploy, manage, and build solutions on the Azure Stack Hub platform. Together with the Tiberiu Radu (Azure Stack Hub PM @rctibi), we created a new Azure Stack Hub Partner solution video series to show how our customers and partners use Azure Stack Hub in their Hybrid Cloud environment. In this series, as we will meet customers that are deploying Azure Stack Hub for their own internal departments, partners that run managed services on behalf of their customers, and a wide range of in-between as we look at how our various partners are using Azure Stack Hub to bring the power of the cloud on-premises.
Umbrellar is a cloud-based company focused on empowering its customers and resellers in making the most of the Azure and Azure Stack Hub clouds and create value to their end-customers in a multi-tenanted environment. Join the Umbrellar team as we explore how they create value to their customers using Azure and Azure Stack Hub
Links mentioned through the video:
I hope this video was helpful and you enjoyed watching it. If you have any questions, feel free to leave a comment below. If you want to learn more about the Microsoft Azure Stack portfolio, check out my blog post.

Recent Comments