Boost your sales business with smart organization charts

Boost your sales business with smart organization charts

This article is contributed. See the original author and article here.

Organization charts enable sellers to better understand their customers’ organizational structures and identify key decision-makers. This information helps sellers develop and execute targeted sales strategies, improve their sales effectiveness, and build stronger relationships with their customers. Additionally, having an org chart in a CRM system helps improve collaboration among sales teams and improves overall communication and coordination with the customer’s organization.

With our new organization charts, you can build your entire org chart with ease and precision!

Creating organization charts made easy

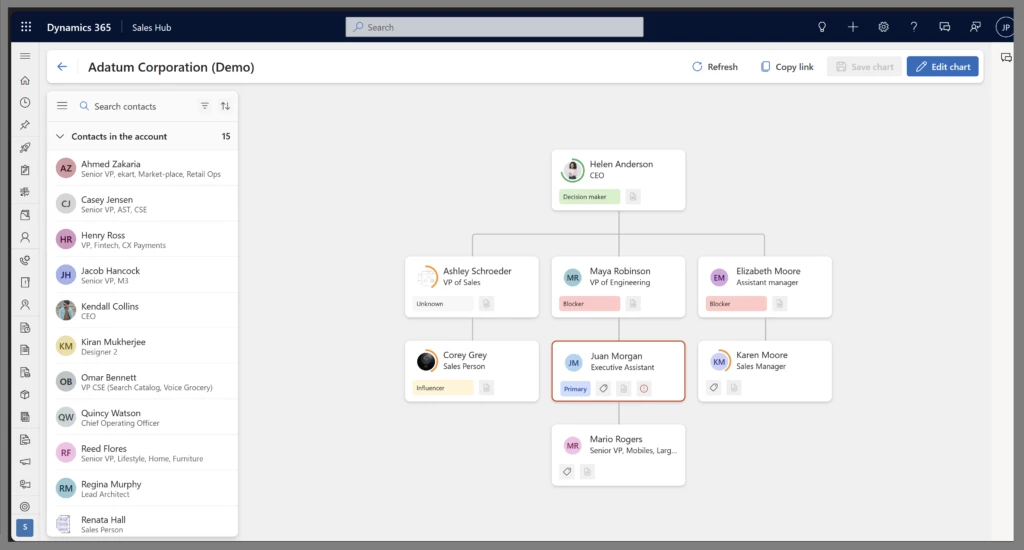
The new feature in Dynamics 365 Sales makes building an organizational chart easier and more efficient, as users can create entire org charts with simple drag-and-drop actions. The list of all contacts of a given account is automatically gathered for you and displayed in the side pane. Through a simple drag-and-drop action, the entire org chart can be built in just a few minutes!

With the new organization chart, users can leverage tags to indicate key players and decision-makers in the org. This helps sellers quickly identify the right people to engage with during the sales process, reducing the time it takes to close deals and improving the overall customer experience. Users can create assistant cards to include executive assistants in the chart as well.

Organization chart

Monitor Contact Health

The new feature allows users to monitor the health and risks of customer relationships using relationship health embedded in organization charts. This capability helps sellers to identify potential risks to customer relationships, such as inactive accounts or unresolved issues, and take proactive measures to address them. It improves the overall health of customer relationships and reduces the risk of losing valuable customers. You can learn more about relationship intelligence by reading the Overview of Relationship intelligence | Microsoft Learn

Users can capture notes directly from organization charts on-the-go, enabling them to capture critical information about customers quickly. This feature helps sellers remember important details about their customers and allows them to keep track of their customer interactions. Users can access the org chart directly from the Contacts form, making it easier to navigate and manage customer information.
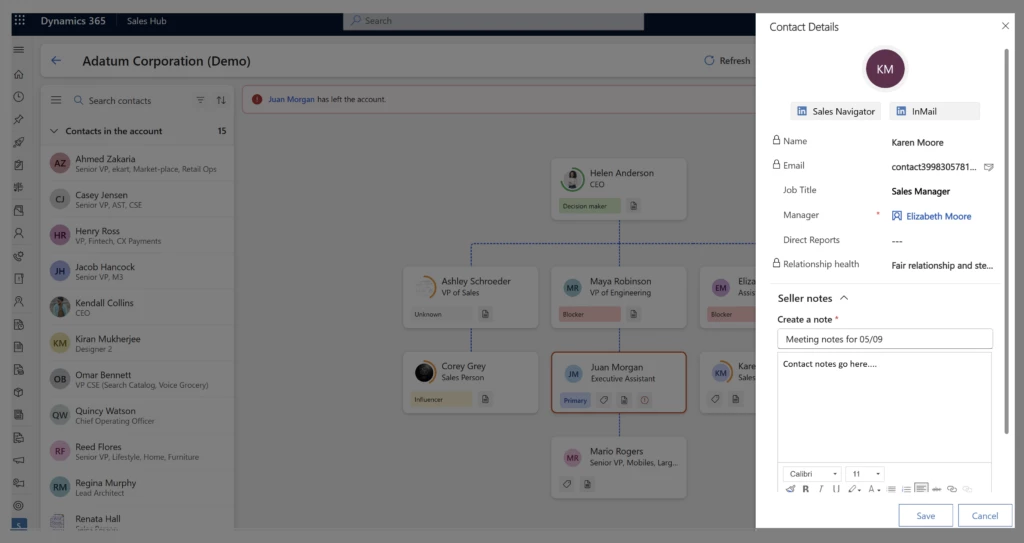
Contact health

Do more with LinkedIn

LinkedIn Sales Navigator is a powerful tool that enables sales professionals to build and maintain relationships with their clients and contacts. With a Microsoft Relationship Sales license, users can receive notifications when one of their contacts leaves an account. This feature is particularly useful for sales teams, as they rely on accurate and up-to-date information to achieve their goals. Additionally, with a Sales Navigator license, users can continue to send InMail and access the LinkedIn profile of their contacts. Therefore, organization charts offer even more, when you combine them with LinkedIn Sales Navigator as users get notifications that help maintain data accuracy.
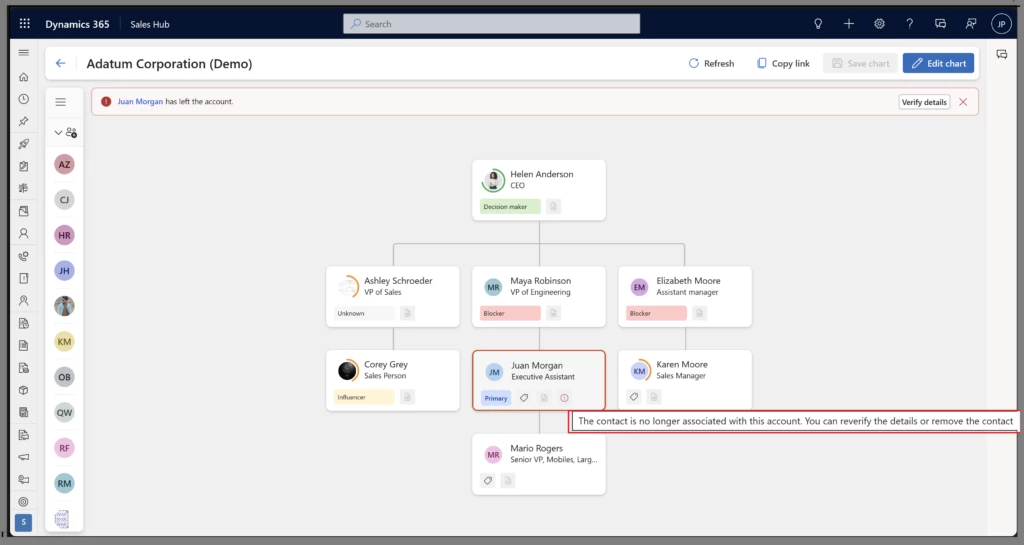
Organization chart with LinkedIn update

To summarize, the smart organization charts offer the following capabilities:

  • Build the entire org chart via simple drag-and-drop action.
  • Leverage tags to indicate key players and decision-makers.
  • Create Assistant cards to include executive assistants in the organization chart.
  • Capture notes directly from org charts on-the-go.
  • Access your organization chart directly from the Contacts form as well.
  • Monitor the health and risks of the customer relationships using relationship health embedded in organization charts.
  • Get notified when contacts leave the organization with LinkedIn Sales Navigator License.

Next Steps

Increasing your sales team’s collaboration could be as simple as having an organization chart where you can visualize all your stakeholders and Dynamics 365 Sales makes it easy.

To get started with the new org charts:

Not a Dynamics 365 Sales customer yet? Take a guided tour and sign up for a free trial at Dynamics 365 Sales overview.

The post Boost your sales business with smart organization charts appeared first on Microsoft Dynamics 365 Blog.

Brought to you by Dr. Ware, Microsoft Office 365 Silver Partner, Charleston SC.

Introducing the Microsoft 365 Copilot Early Access Program and new capabilities in Copilot 

Introducing the Microsoft 365 Copilot Early Access Program and new capabilities in Copilot 

This article is contributed. See the original author and article here.

In March, we introduced Microsoft 365 Copilot—your copilot for work. Today, we’re announcing that we’re bringing Microsoft 365 Copilot to more customers with an expanded preview and new capabilities.

The post Introducing the Microsoft 365 Copilot Early Access Program and new capabilities in Copilot  appeared first on Microsoft 365 Blog.

Brought to you by Dr. Ware, Microsoft Office 365 Silver Partner, Charleston SC.

Get quick access to your most-used knowledge articles

Get quick access to your most-used knowledge articles

This article is contributed. See the original author and article here.

Are you tired of constantly searching for the same knowledge articles in Dynamics 365 Customer Service? Say goodbye to wasting precious time and hello to the new favorite feature! 

We are excited to announce a new knowledge management feature in Dynamics 365 Customer Service that allows you to mark knowledge articles as favorites. 

With this new feature, you can easily save up to 50 knowledge articles that you frequently use as favorites. This allows you to access them quickly while you’re working on a case, without having to search for them every time. 

To use this feature, your administrator will need to enable it and provide privileges to specific roles. Once enabled, you can easily mark an article as a favorite by selecting the heart icon next to it in the search results. 

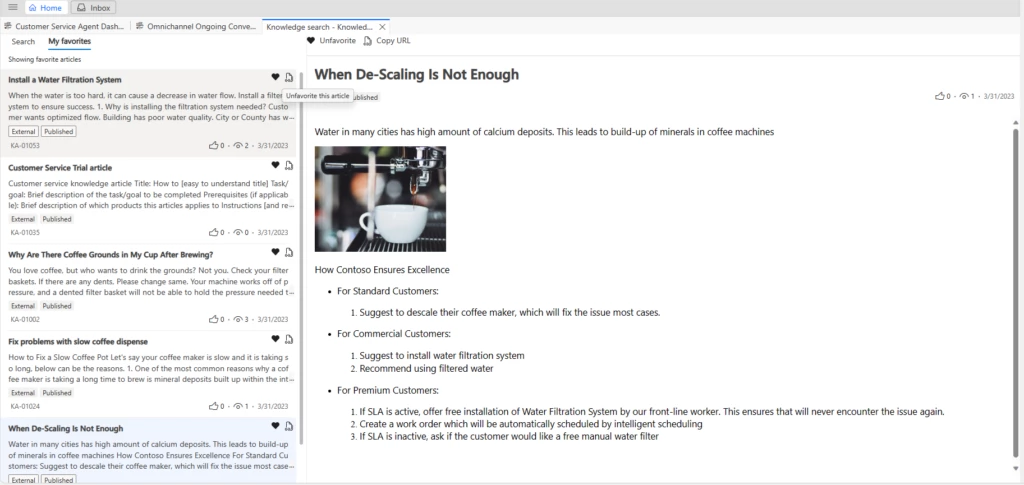
Knowledge article on the agent home page with list of favorite knowledge articles in the left pane

Using your favorite knowledge articles

When administrators enable favorites, agents can 

  • Select an article from the list of search results. 
  • Click on the favorite (heart) icon to add the article to your favorites. 
  • Remove an article from the favorites list by clearing the favorite (heart) icon. 

All of your saved articles will appear in the My favorites tab. You can access this tab from various places within the app, including the app side pane, standalone search control, form-embedded control, and the reference pane. 

The best part? The article you last marked as a favorite will appear first in your list of favorites. When you delete an article, it will no longer appear on your favorites list. Additionally, your favorite articles are saved in the language in which you viewed them when you marked them as a favorite. If you view a translated version of a favorite article, it won’t appear as a favorite. Also, when a favorite article has multiple versions, the new version appears as a favorite and replaces the earlier version. 

If you’re using the Customer Service workspace or Omnichannel for Customer Service, selecting a favorite article will open it in an app tab. 

We hope this feature makes it easier to access the knowledge articles you use most in Dynamics 365 Customer Service.

Learn more

Watch a quick video introduction.

To learn more about enabling and using favorites, read the documentation:

The post Get quick access to your most-used knowledge articles appeared first on Microsoft Dynamics 365 Blog.

Brought to you by Dr. Ware, Microsoft Office 365 Silver Partner, Charleston SC.
Migrating your Human Resources environment! 

Migrating your Human Resources environment! 

This article is contributed. See the original author and article here.

Have you tried migrating your Dynamics 365 Human Resources (D365 HR) environment yet? We announced in early December the general availability (GA) release of the automated tooling, for the lift and shift migration of your standalone Human Resources environment.  

Albert Einstein said, “The measure of intelligence is the ability to change” and that is how we feel about the merged and improved Human Resources on the Dynamics 365 Finance and Operations infrastructure.  

As part of the infrastructure merge, all capabilities of the Human Resources application have been made available in Dynamics 365 Finance and Operations (Finance and Operations) environments. Customers can migrate their Human Resources environments using the migration tooling that is available in Microsoft Dynamics Lifecycle Services (LCS). They can also optionally merge their data with their existing  Finance and Operations environment. 

Benefits of migrating to the merged infrastructure 

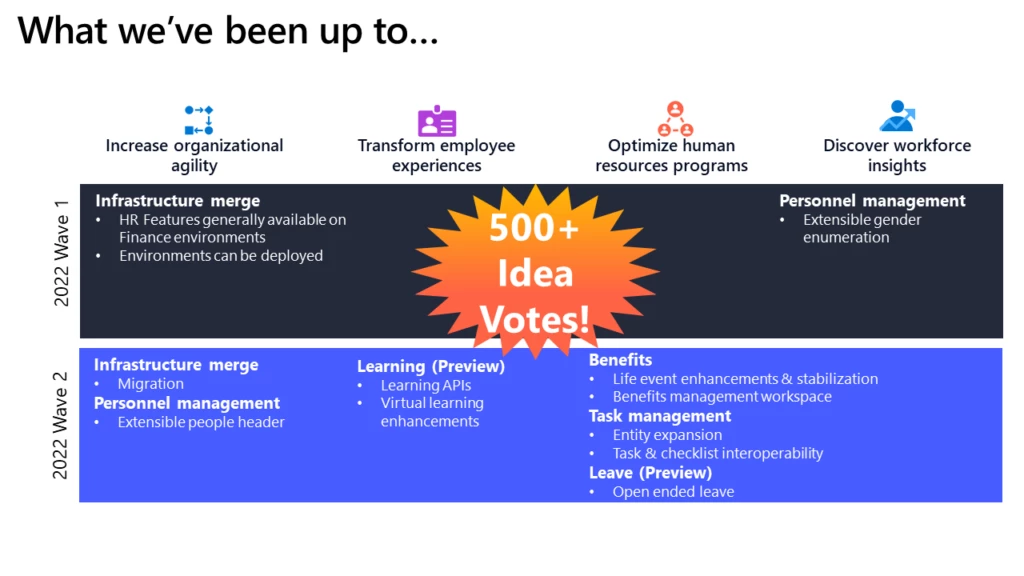
Did you know that we were able to close approximately twenty-five ideas with over 500+ votes as a result of leveraging the existing platform functionality on the Finance infrastructure? Moving to new infrastructure can help you with the following:  

  • You get one set of human resources capabilities within Dynamics 365 including: 
    • All the previous capabilities and enhancements on the standalone Human Resources application are now in the merged Human Resources.  
    • All the new functionalities that have been added since August 2022, which includes enhancements in Personnel management, Leave and Absence management, Benefits managements, Learning management, Dual-write enhancements, Resource management integration, Process automation, etc.   

Picture describing the list of features the product team has been up to including 500+ idea votes

  • All planned roadmap functionality will only be available in the merged Human Resources environments on the Finance infrastructure.

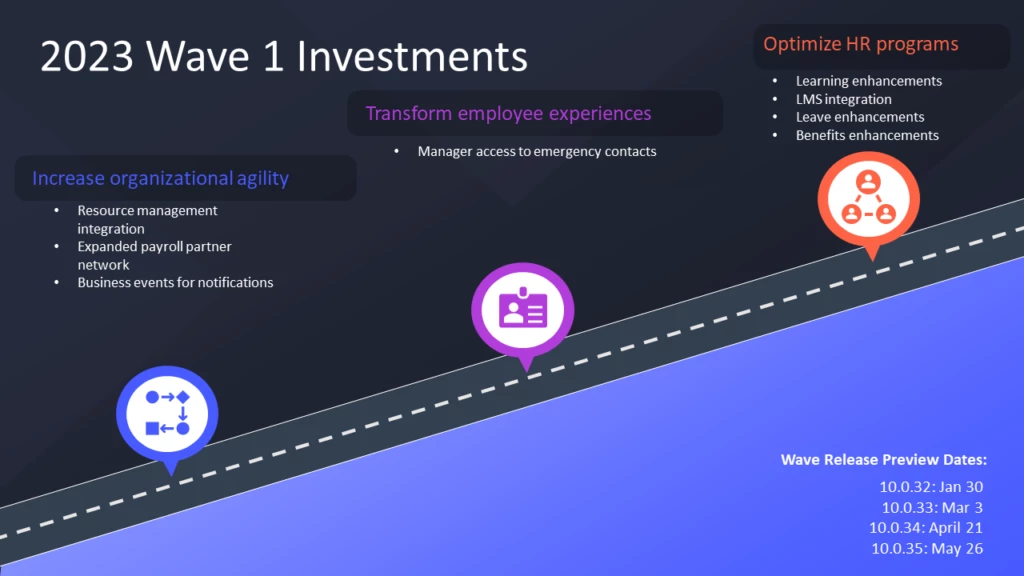
Image detailing wave 1 investments including organization agility, employee experiences, and optimizing of HR programs

  • The extensibility options and the experience is improved through Dynamics and the Finance and Operations platform ecosystem including:
    • Enhanced Power Platform capabilities 
    • Consistent platform maintenance including: deployment, updates, Application Lifecycle Management, Lifecycle Services, Geographic availability, etc.  

Customer Experience 

We have had many customers complete their sandbox and production migrations successfully on the Finance and Operations platform.  Additionally, we have had a number of customers merge (consolidate) their Human Resources production environment with an existing Finance and Operations environment.  

One of our customers, TecAlliance, migrated their global implementation of their standalone Human Resources environments (used in 22 countries), using the automated migration tooling, in a very short span.  Here’s what they had to say about their experience:

“We were able to migrate to the Finance and Operations infrastructure seamlessly; after intensive testing, we encountered only one bug and were able to get it resolved very quickly. From the initial implementation of Dynamics 365 Human Resources to the migration of Human Resources on to the new infrastructure, it took less than 12 months thanks to the amazing support from Microsoft.” 

-TecAlliance

Call to Action 

Migrate your standalone Human Resources environment to the Finance and Operations infrastructure using the automated tooling available in LCS.   

If you have complexities around integrations and/or working to merge or consolidate with another Finance and Operations application, we recommend working with your Dynamics partner to determine the right approach.  We also recommend working with your designated Solution Architect if you are part of the FastTrack or the ACE program.  

Learn more:  

  • To learn more about the infrastructure merge here  
  • For detailed information on new capabilities in Human Resources, see Release plans: 2022 Release Wave 2, 2023 Release Wave 1 
  • Join the Human Resource Customers and Partners Yammer group for collaboration, feedback and to stay informed on product related announcements.  

The post Migrating your Human Resources environment!  appeared first on Microsoft Dynamics 365 Blog.

Brought to you by Dr. Ware, Microsoft Office 365 Silver Partner, Charleston SC.
Improve Sales process efficiency using sequence insights

Improve Sales process efficiency using sequence insights

This article is contributed. See the original author and article here.

Sequences in Dynamics 365 Sales is a valuable sales engagement tool for businesses looking to drive efficiency via standardized sales processes. When sellers engage with sequences, it’s important to understand if they are supporting the process effectively. This is where sequence insights come into play.

Sequence insights provide data on the performance of sequences and their steps. Businesses can use sequence insights to review and analyze the effectiveness of their current sequences by identifying bottlenecks, and take corrective measures. Also, they can update the wait times and steps to ensure that the overall process is efficient and working as intended.

Additionally, sequence insights can help businesses identify best practices that are working well across the sales team. By analyzing data on successful sales sequences, businesses can identify common patterns and strategies that are driving success.

Reporting and insights are available at two levels:

  • Sequence level analytics that provide aggregate data for the entire sequence.
  • Step level analytics that provide data for the selected step.

Let’s take a quick tour to see how you can use them to optimize and improve sequences.

Gain insights with sequence reporting

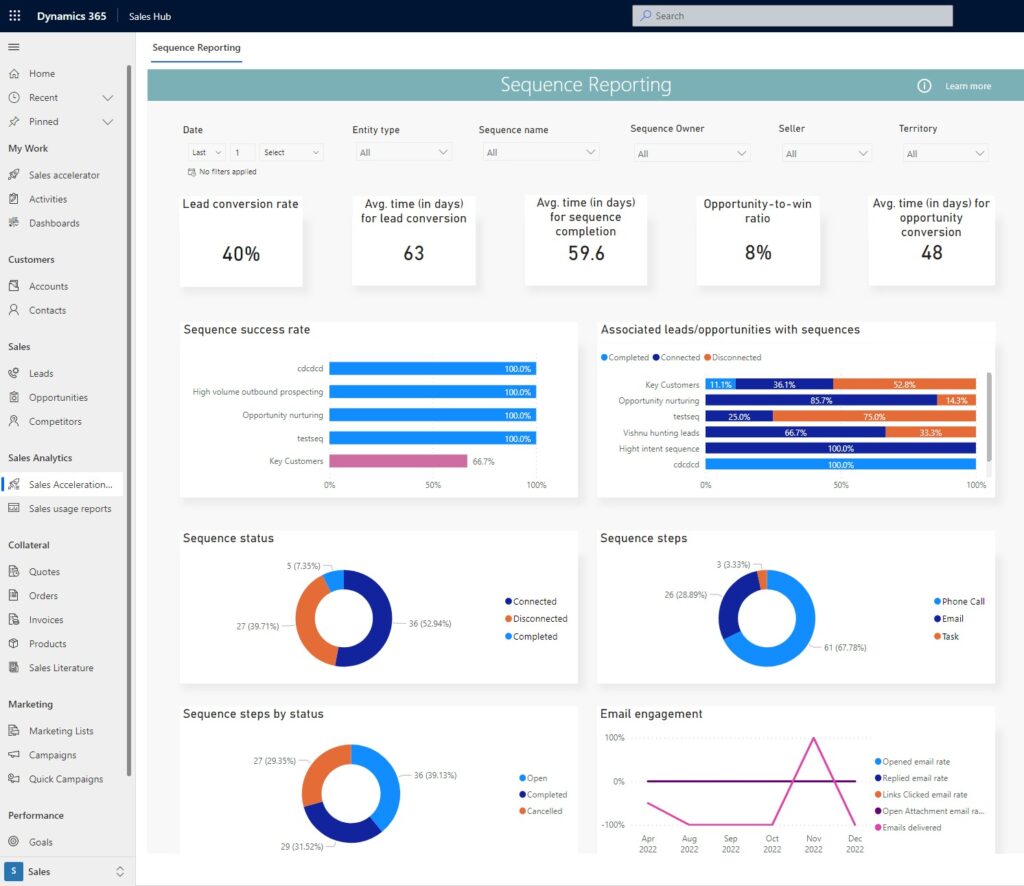
First up is the “Sales Acceleration Report” (available to sales managers/operations role only). Here, a dashboard is available to review how sequences are performing all-up:

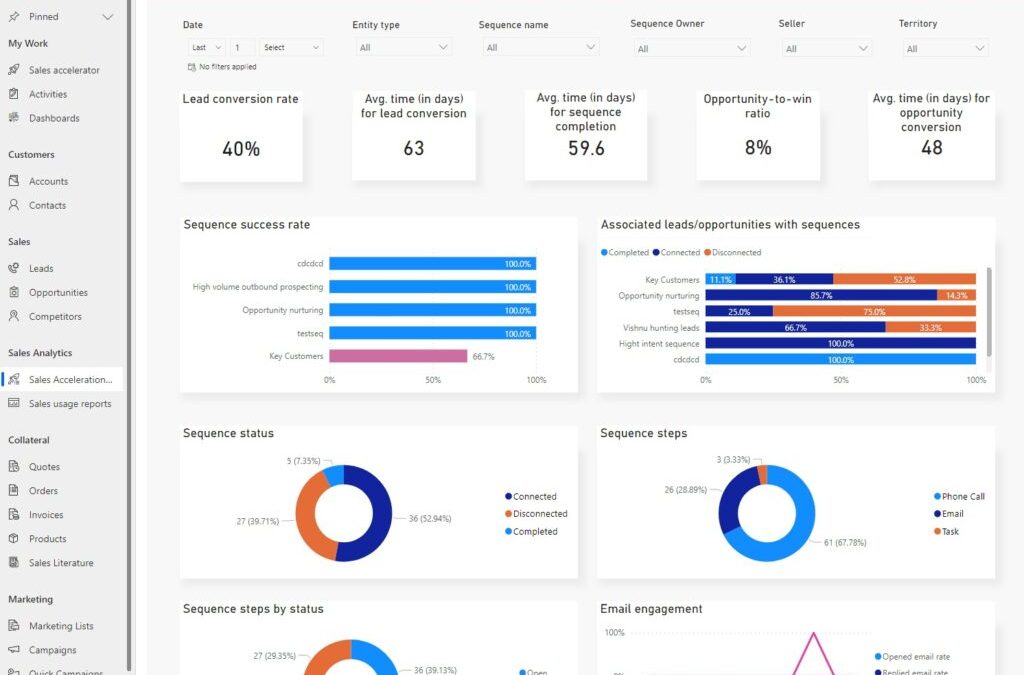
Sequence reporting dashboard

You can review all sequences together for a team-wide view or set filters to select specific sequences for performance evaluation. Not only do you get common success measures such as conversion rate and opportunity to win ratio, but you also get success rates of each sequence, along with distribution of “status” for different customer segments.

This report and the view are optimized for business level analysis and when needed, drill down to a few selected sequences.  

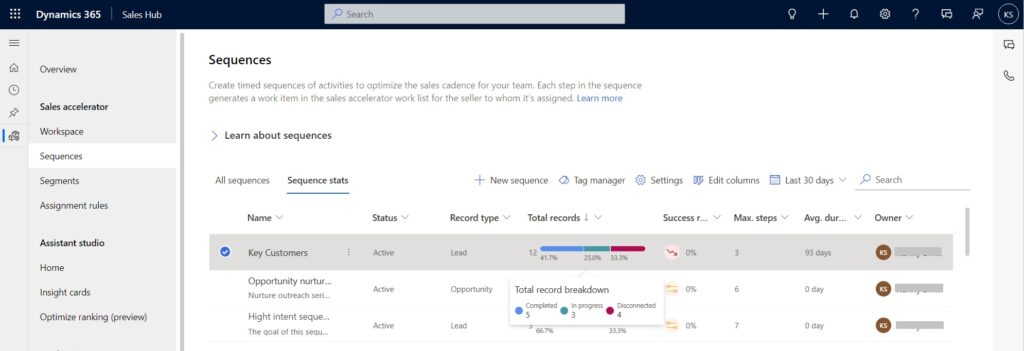
You can also get an all-up summary report at the sequences page that provides a list view of all sequences. There you will find the “Sequence stats” tab that shows progress of each active sequence in terms of % completion for connected records, success rates, and average duration. This is a great view for operational excellence to keep an eye on sequences whose execution or success rate is out of the ordinary.

Sequence stats

Improve efficiency with sequence insights

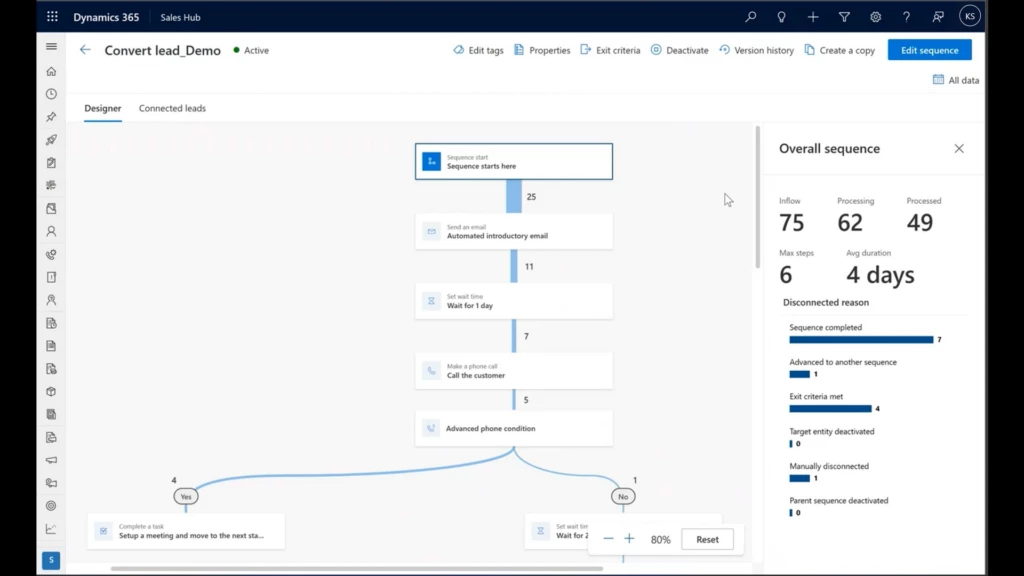
You can get even more insights at a sequence and step level. For this, open the desired active sequence. You will see sequence insights and analytics right away the sequence itself is shown as a Sankey graph where each line shows how many records (leads, opportunities, etc.) were processed through the part of the sequence.

This is a quick and easy way to check overall performance of the sequence and spot points in the sequences where a larger than expected number of records is getting stuck or leaving the sequence.

Sequence analytics

Select the starting step of the sequence to get additional insights for it. Things to look for in this view:

  1. Is there a particular stage in the sequence where the amount of incoming volume significantly surpasses the number of qualified records that move on to the next stage? This is a common occurrence if a step is designed to filter out unqualified prospects. However, it’s not necessarily expected in other steps. By examining the report, you can identify these drop-off points and conduct a deeper analysis. This will help you determine why most customers are not progressing past this stage, and whether the drop-off rate is in line with expectations.
  2. Is the average number of days for completing this sequence within the expected range? If not, you can use step level insights to diagnose where most of the time is spent, and to identify what improvements are needed.
  3. Review disconnection reasons for any abnormality (e.g., are sellers disconnecting sequences at a high rate?).

Deep dive for more analytics

Analytics is not limited to overall sequence only you can select any step in the sequence and get detailed insights to understand how sellers are executing that step. Here is an example for the sending email step:

Step analytics

Email insights (and insights for other communication steps) are focused on measuring engagement did the prospect receive the message, open it, and interact with its content?

All step level insights include details of their execution status. For example, how many records have completed this step, how many are in progress, or how many skipped, along with numbers and reasons for disconnection (e.g., manually disconnected, record inactivated, etc.). Finally, the “time taken” information is presented as a histogram this view is great as it quickly lets you figure out averages as well as outlier buckets.

Things to look for in a step analytics:

  1. Are the average time taken for completing the sequence and the completion rate within the expected ranges?
  2. Are there any steps that are outliers for disconnections or “in-progress”?
  3. If steps are about communicating with customers (e.g., email, phone call), are prospects engaging as expected?

Record level information

If you need to see progress for any specific record, navigate to the “Connected ” tab (e.g., “Connected leads” if the sequence is for leads). You will see a list of all connected records and their progress in terms of steps completed, current step, days elapsed and which salesperson owns this record. This view enables you to quickly spot any outliers (e.g., records that are taking longer than others or a salesperson seems blocked on a step and requires assistance).

Record level information

Final thoughts

Sequences can be an efficient and straightforward sales engagement tool for businesses that seek to provide guidance to their sales representatives. By incorporating automation (e.g., automated emails), sequences can reduce manual effort, making the sales process more streamlined and effective. Furthermore, with our new sequence insights, sales managers and operations teams can better understand how sequences are working for their sellers, including the identification of bottlenecks within the process. This data can be used to benchmark overall sequence execution velocity and success rates, allowing for more informed decision-making and ultimately improving the sales process.

Next steps

Don’t have Dynamics 365 Sales yet? Try it out now: Sales Overview Dynamics Sales Solutions | Microsoft Dynamics 365

Learn more about sequences and how to create them:
Sequences in sales accelerator | Microsoft Learn

Explore our getting started templates to quickly create sequences and try them for yourself:
Sequence templates | Microsoft Learn

Learn more about sequence analytics:
View and understand sales acceleration reporting | Microsoft Learn
Understand the sequence stats page | Microsoft Learn

The post Improve Sales process efficiency using sequence insights appeared first on Microsoft Dynamics 365 Blog.

Brought to you by Dr. Ware, Microsoft Office 365 Silver Partner, Charleston SC.
Microsoft Dynamics 365 Copilot at Gartner Supply Chain Symposium Xpo™ 2023

Microsoft Dynamics 365 Copilot at Gartner Supply Chain Symposium Xpo™ 2023

This article is contributed. See the original author and article here.

Achieving supply chain excellence today requires orchestrating complex global operations with agility, adapting to rapid and continuous change, and navigating economic headwinds and ongoing disruptions. Yet only 22 percent of companies have a proactive supply chain network, meaning disruptions or shifts in supply or demand can quickly escalate into significant issues.1 To truly deliver a proactive, resilient supply chain, Chief Supply Chain Officers (CSCOs) need a clear digital transformation strategy that builds on top of existing investments in data to uncover new insights. At the same time, CSCOs must enable the adoption of new productivity tools, such as generative AI, to help organizations rethink the status quo.  

At Microsoft, we recently introduced Microsoft Dynamics 365 Copilot to bring next-generation AI to every line of business. It can help CSCOs solidify the strategic importance of supply chain functions and its value as strategic business partners. That’s why on May 8 through 10 in Orlando, Florida, at the Gartner Supply Chain Symposium Xpo™ 2023, we’re presenting a deep dive into the practical ways organizations can unlock supply chain productivity with a copilot approach to AI.  

Supply chain employees reviewing inventory.

Practical ways to copilot with AI and unlock productivity

May 9, 2023 at 11:30 AM EST in Northern Hemisphere C, Booth 443

Attendees can also join us at our booth (#443), where we will highlight how supply chain leaders can utilize Microsoft Dynamics 365 to: 

  • Embrace AI-enabled risk mitigation to deliver better business outcomes while improving customer and employee experiences. 
  • Generate intelligent insights and rapidly act on recommendations with Microsoft Supply Chain Center. 
  • Gain agility and deliver world-class fulfillment experiences like accurate available-to-promise (ATP) and direct store delivery (DSD) for direct-to-consumer (DTC) orders. 

Generate intelligent insights

At the Gartner Supply Chain Symposium, attendees will see how the Microsoft Supply Chain Center empowers supply chain professionals to use AI copilots to generate actionable insights to increase productivity, shorten lead times, and improve overall supply chain performance.  

The Microsoft Supply Chain Platform harmonizes data across legacy and new enterprise resource planning (ERP) and supply chain systems to provide real-time data visibility; facilitate actionable insights; predict supply shortages, potential stockouts, or shipment delays; and improve collaboration across teams and suppliers. The end-to-end visibility possible using Copilot in the Microsoft Supply Chain Center allows leaders to proactively manage supply chain events. 

Customers like iFit have leveraged the intelligent insights from Supply Chain Center to reimagine their distribution network, staging products in locations based on customer demand instead of relying on history. In doing so, iFit increased its efficiency from 30 percent to 75 percent in its forward stocking. Before Supply Chain Center, iFit took two weeks to fulfill customer demand far more than the desired two days. 

This embed requires accepting cookies from the embed’s site to view the embed. Activate the link to accept cookies and view the embedded content.

This site uses cookies for analytics, personalized content and ads. By continuing to browse this site, you agree to this use.

Embrace AI-enabled risk mitigation

For most supply chains, particularly those crossing international borders and using multiple transportation modes, disruptions that risk diminishing the customer experience occur regularly. Such disruptions place immense pressure on operation teams to assess the situation, coordinate with various stakeholders, and maintain production momentum. Even simple delays, such as bad weather requiring load rerouting, can cause disruptions with ripple effects of up to two weeks and effecting multiple tiers. Production planners may lack integrated systems, resulting in limited visibility of inbound shipment issues until they experience a delay. At that point, planners contact suppliers and may discover factors, such as weather, causing a two-week production delay. 

The planner now has no choice but to push delivery of sales orders out two weeks, giving the sales team and customers little time to pivot and find solutions. The planner may also spend half a day or more manually evaluating purchase orders to understand the impact on operations. Not to mention any time required to adjust production schedules to accommodate the supplier’s updated delivery windows. 

Using Dynamics 365 Copilot to integrate supply chain data and provide critical insights, the planner in the scenario above would receive a real-time alert about weather issues at the supplier’s location. The system would also generate an email listing all purchase orders affected by the production delay, reducing the planner’s workload from hours to minutes. 

Copilot can also send the planner a list of suggestions that could minimize the impact of the disruptions. Now the planner has time to evaluate alternatives to meet delivery requirements and reschedule production jobs. The result is proactive management of the event, increased agility within the supply chain, shorter recovery times, and, most importantly, mitigating the customer impact in a way that preserves customer relationships and bolsters customer satisfaction. 

The above is one practical application of Copilot, but there is considerably more to share. In our recent blog, Applying next-generation AI to the Microsoft Supply Chain Platform, you can take a deeper dive into how Dynamics 365 Copilot is transforming laborious processes, improving efficiency and responsiveness, and enabling enterprise supply chains to optimize operational agility, reduce cost, and improve customer experiences.

Gain agility and deliver world-class fulfillment experiences

Northern Tool + Equipment, a manufacturing and omnichannel retailer with more than 130 stores across the United States, serves a customer base that heavily relies on their tools for their livelihood. Accurate delivery times and product reliability are of the utmost importance. However, Northern Tool + Equipment faced significant challenges due to a fragmented supply chain technology infrastructure, resulting in four to seven days lead times for their extensive product catalog of 100,000 items. This, combined with the complexities of shipping large items like generators and air compressors, made optimizing shipping routes for cost and sustainability difficult. 

To overcome these challenges, Northern Tool + Equipment implemented Microsoft Supply Chain Center, an end-to-end supply chain solution that connects disparate systems and harmonizes data across the supply chain. This solution provides a comprehensive understanding of supply and demand, generating insights using AI to uncover patterns and projections based on historical and real-time inventory and order volumes. 

Direct-to-consumer (DTC) brands like Northern Tool + Equipment face unique challenges in delivering world-class fulfillment experiences to their customers. With an emphasis on speed, accuracy, and reliability, these brands require agile supply chain solutions that can adapt to continuous change and increasing technology clock speed. Microsoft Supply Chain Center enables DTC brands like Northern Tool + Equipment to gain agility and deliver outstanding customer experiences by offering real-time, highly accurate, available-to-promise (ATP) dates for direct store delivery (DSD) and more. 

Learn more about Northern Tool + Equipment’s success in our recent case study.  

This embed requires accepting cookies from the embed’s site to view the embed. Activate the link to accept cookies and view the embedded content.

This site uses cookies for analytics, personalized content and ads. By continuing to browse this site, you agree to this use.

See you at Gartner Supply Chain Symposium Xpo™ 2023 

As global supply chains continue reimagining what is possible by applying emerging technologies like AI and Copilot, Microsoft remains dedicated to enabling CSCOs with the solutions and timely insights they need to excel. We hope you can join us at the Gartner Supply Chain Symposium Xpo™ 2023, where you can attend our session using the registration link and engage with our supply chain professionals at our booth. In the meantime, we invite you to check out our guided tour of Dynamics 365 Intelligent Order Management or reach out to learn more today.  

Practical ways to copilot with AI and unlock productivity 

Location: Northern Hemisphere C, Booth 443 

Date and time: May 9, 2023, 11:30 AM EST  

Register: Gartner Supply Chain Symposium Xpo™ 2023 


End notes

1Zippia, 2022. 18 Stunning supply chain statistics [2023]: facts, figures, and trends.

The post Microsoft Dynamics 365 Copilot at Gartner Supply Chain Symposium Xpo™ 2023 appeared first on Microsoft Dynamics 365 Blog.

Brought to you by Dr. Ware, Microsoft Office 365 Silver Partner, Charleston SC.