This article is contributed. See the original author and article here.
We released System Center Operations Manager Management Pack for Azure SQL Managed Instance recently. It provides comprehensive monitoring capabilities for SQL Managed Instance. If you have a hybrid data environment, you can use a single monitoring solution, SCOM, to monitor all your data assets as we already have management packs for SQL Server and Azure SQL DB.
Discovery
After you install the management pack (MP), there are two templates to get you started: Manual and Automatic Discovery. As the names suggest, you can either discover your instances by adding them manually or automatically discover instances in a given subscription. Both options have wizards that walk you through this setup. We will not explore them in this post as the instructions in the MP guide are very detailed. I just want to point out that you can use either Azure Active Directory (AAD) or SQL Authentication to connect to the instances. You can use a connection with sysadmin rights or there is an option to use the least amount of privileges to monitor the product just like SQL Server MP. This is also explained in detail in the MP guide.
Monitoring
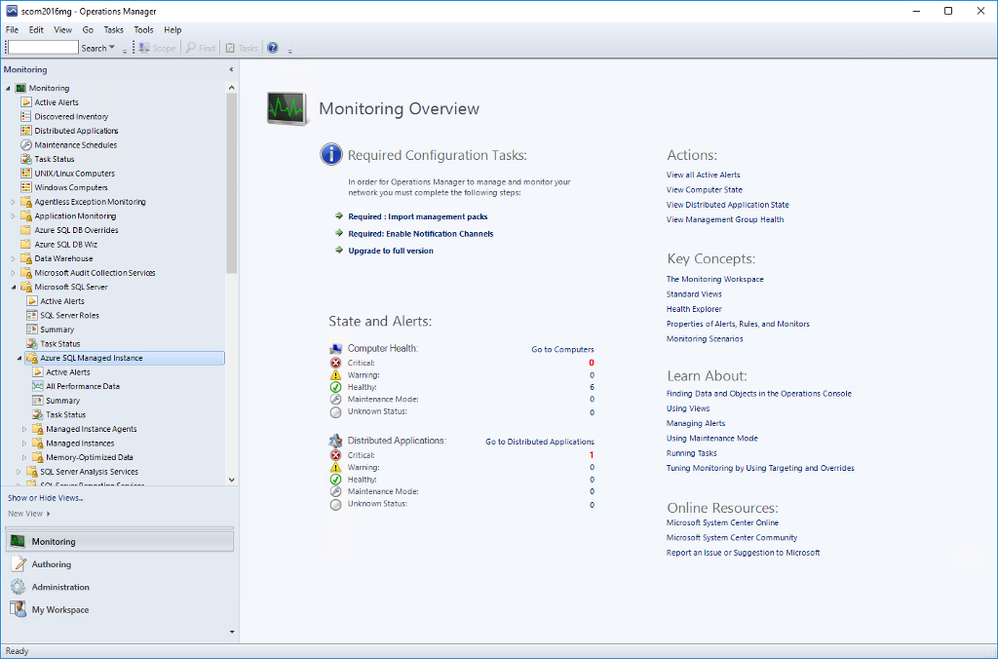
Once you complete all the steps in the wizard, you will be able to see the instances in the SCOM dashboard under Monitoring. Under Microsoft SQL Server folder, you’ll see a subfolder for Microsoft Azure SQL Managed Instance.
Navigate to Microsoft Azure SQL Managed Instance -> Managed Instances -> Database Engines
You can see the instances listed with some details. You can select which columns to display here by right-clicking and selecting Personalize View from the list. If you are using geo-replication, you will see that Geo-Replication Replica Role is listed in Detailed View. It can be Primary or Secondary (or blank if this instance is not participating in geo-replication).
As usual, you can drill down by double-clicking on the instance rows. This will take you to the list of individual monitors and their status. Most of these are the monitors you are familiar with from SQL Server MP.
There is a brand new monitor called Instance Free Storage Space Left. It uses percentages and is set to warn if it goes below 20% but, of course, it is customizable just like all the other monitors. It also shows the actual data in MB.
Navigate to Microsoft Azure SQL Managed Instance -> Managed Instances -> Databases
If you double-click on a geo-replicated database, you will see the new monitor, Geo-Replication Status, under Availability. All the information is on the right hand side. As you can see it can be in one of three states:
- CATCH_UP: This is the healthy state.
- SEEDING: Seeding is happening but until it competes, you can’t connect to the secondary database.
- PENDING: Not in an active continuous-copy relationship. Usually indicates bandwidth related issues.
Also on the Databases view, right-click on a geo-replicated database and select Open->Performance View. You will find the new counter Geo-Replication Lag (sec) along with other counters. This rule collects performance metric for the primary database only and shows the time difference between transactions committed on primary database and persisted on secondary database.
Other Views
You can also explore Managed Instance Agents and Memory-Optimized Data folders for monitors specific to those areas. We will not explore those in this post.
Summary Dashboard under Microsoft Azure SQL Managed Instance provides the usual status-at-a-glance view of everything. Just like other SQL MPs, you can drill down to get to specific monitors/rules and customize it by adding or removing tiles to fit your needs.
Active Alerts view under Microsoft Azure SQL Managed Instance lets you view all your active alerts in a single place just like other SQL MPs.
Summary
Azure SQL Managed Instance Management Pack is very similar to other SQL MPs but also introduces product specific monitors and rules.
Brought to you by Dr. Ware, Microsoft Office 365 Silver Partner, Charleston SC.


Recent Comments