This article is contributed. See the original author and article here.
Both tools below – ProcDump and DebugDiag – work similarly: they can attach themselves as debuggers to a process, then, when the machine is on high-CPU, collect one or more memory dump(s) from that specific process.
Note that the tools won’t “know” what process is consuming the CPU unless we dig deeper in the performance counters. If using ProcDump, it easier if we are sure ahead of time what’s the culprit – the process that is “eating” much CPU.
Both tools need administrative rights to be run.
DebugDiag is the preferred tool, since it automates some steps, adds more explicit context, and includes automated memory dump analysis capabilities too.
Using the command-line ProcDump
ProcDump does not require installation. But one needs to be specific about the PID to which it is attaching. That PID needs to be determined prior to starting ProcDump. Debug Diag is able to determine the PID itself, if the Application Pool is specified.
- Download the tool and copy it on a disk folder, for example D:Temp-Dumps
https://docs.microsoft.com/en-us/sysinternals/downloads/procdump
- Open an administrative console, from where to run commands.
Navigate to where the ProcDump tool was placed (D:Temp-Dumps).
- Find the process ID, the PID, of the IIS w3wp.exe worker process executing your application.
From the administrative console, you can use AppCmd IIS tool to list processes for application pools:
C:WindowsSystem32InetSrvappcmd.exe list wp
- In the administrative console, start the following command to collect dumps (but don’t hit enter yet).
D:Temp-Dumps> procdump.exe -accepteula -ma -c 85 -n 3 -s 7 [PID]
You may want to redirect the console output of ProcDump to a file, to persist the recording of the encountered exceptions:
D:Temp-Dumps> procdump.exe -accepteula -ma -c 85 -n 3 -s 7 [PID] > Monitoring-log.txt
Replace [PID] with the actual Process ID integer number identified at the step 2.
Please make sure that there is enough disk space on the drive where dumps are collected. Each process dump will take space in the disk approximately the same size the process uses in memory (column Commit Size in Task Manager). For example, if the w3wp.exe process memory usage is ~1 GB, then the size of a dump file will be around 1 GB.
- Start reproducing the problem: issue requests that would render the process to consume CPU; or leave the command running until the high-CPU occurs.
- Please wait until all the dumps are written and then compress the files before uploading the dumps to the workspace.
Using the UI tool DebugDiag, Debug Diagnostics Collection
DebugDiag requires installation, but it is able to determine itself the whatever process instance – PID – happens to execute for an application pool at some point in time; even when that process may occasionally crash or be recycled, hence restarted with different PID.
#1.
Download Debug Diagnostic and install it on IIS machine:
https://www.microsoft.com/en-us/download/details.aspx?id=49924 v2.2 (if 32-bit system)
https://www.microsoft.com/en-us/download/details.aspx?id=102635 v2.3.1 (only supports 64-bit OS)
#2.
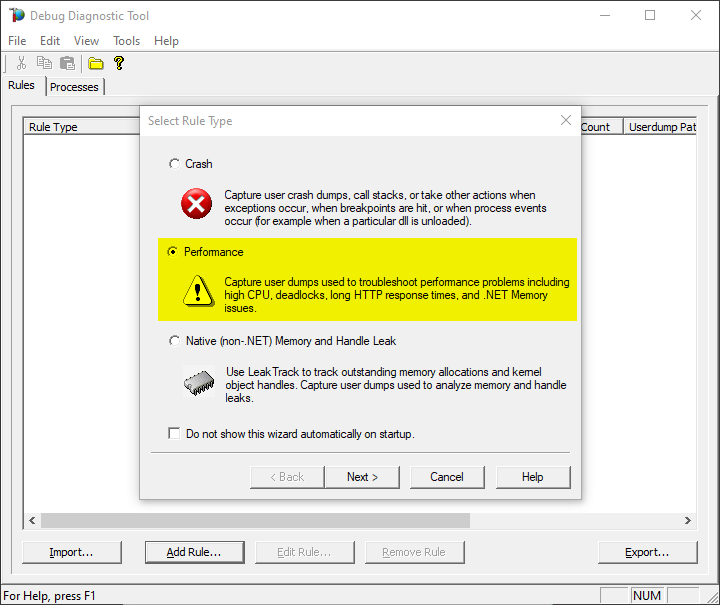
Create a new rule selecting Performance and then clicking on “Next” next button.
You also can create the rule by right-click and selecting “Add rule”, or clicking the “Add rule” button at the bottom.
#3.
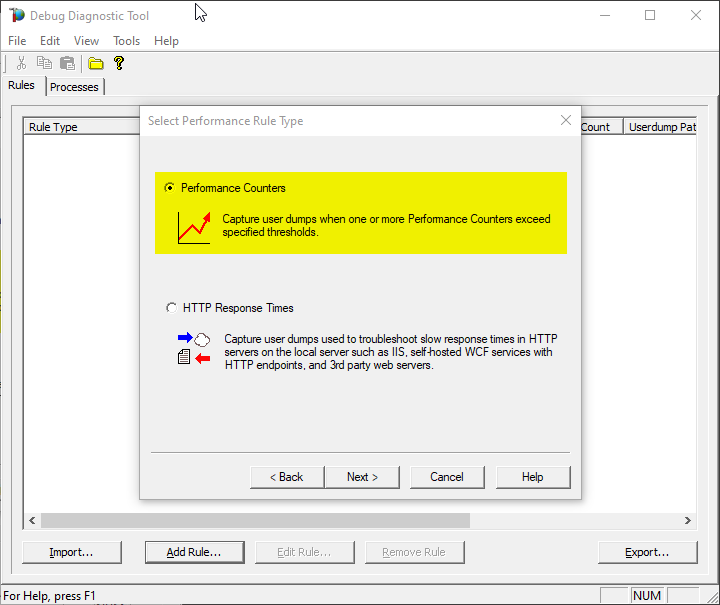
Select the second option “Performance Counters” and then “Next”.
#4.
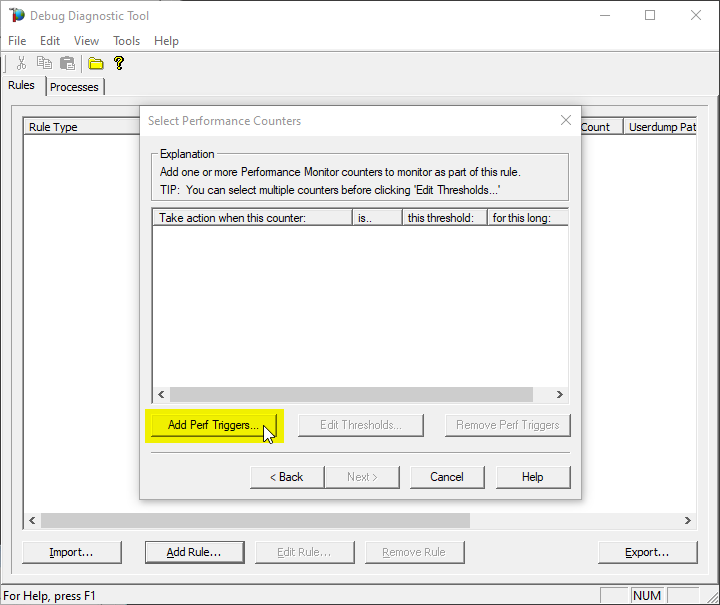
Click on Add Perf Triggers…
#5.
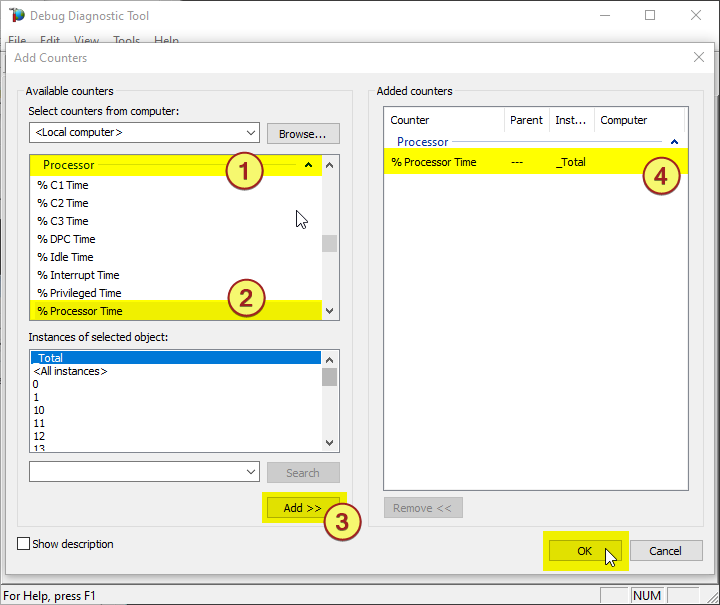
The select %Processor Time from the Processor category and select the _Total instance
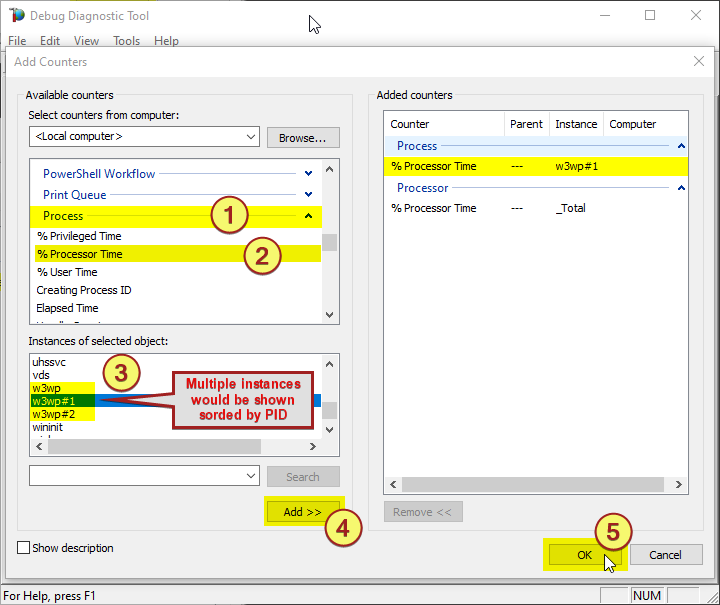
Note:
You might need to determine the w3wp.exe#N instance by looking into the Task Manager, sorting by w3wp.exe PID.
Or use one of the following commands in an administrative command-line console, to find out the PIDs:
> C:WindowsSystem32InetSrvappcmd.exe list wp
> TaskList.exe | find “w3wp.exe” /i
> TaskList.exe /FI “IMAGENAME eq w3wp.exe”
#6.
Select the action click on Edit Thresholds
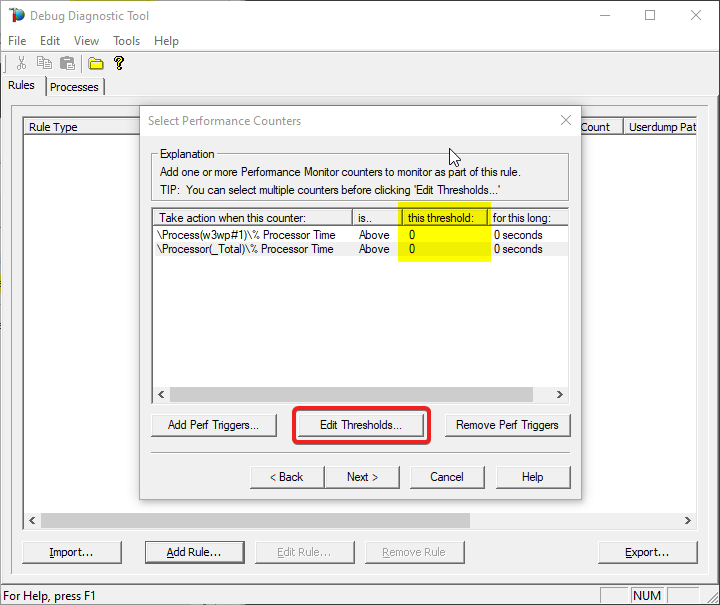
#7.
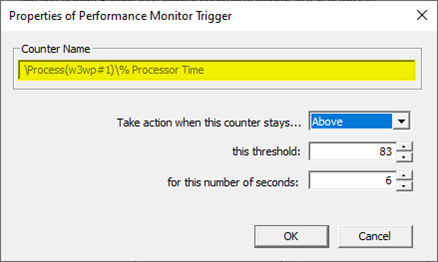
Select Above, set 80 as this threshold and 5 in for this number of seconds
You might need to adjust the threshold value to what you’re seeing on your system. You should know better how you define “High-CPU” (maybe, in your case, High-CPU means anything above 60%; your experience or expectations matter here).

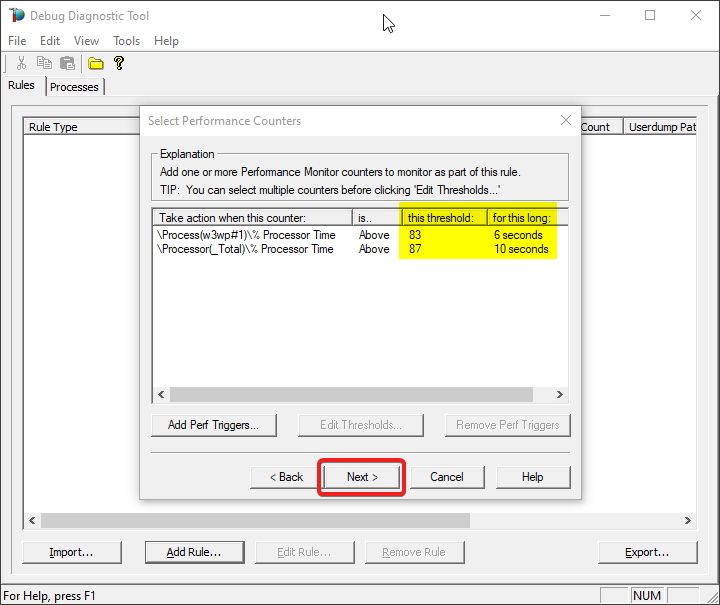
#8.
Click on Next
#9.
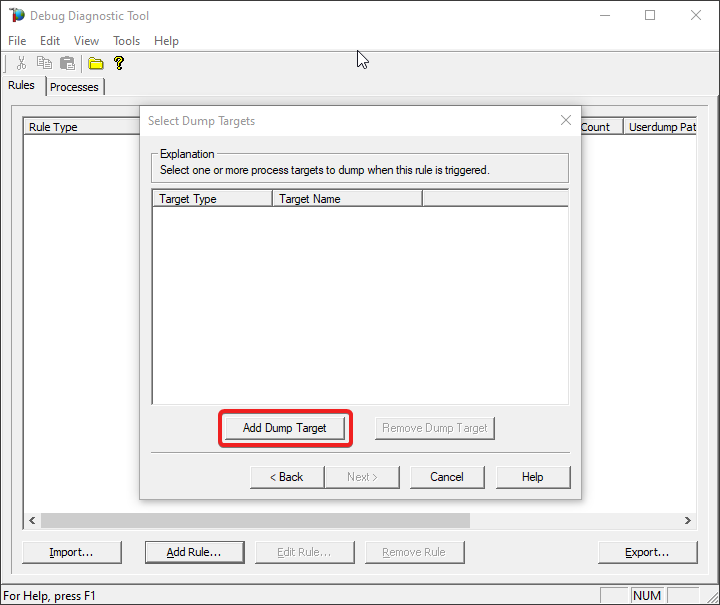
Click on Add Dump Target
#10.
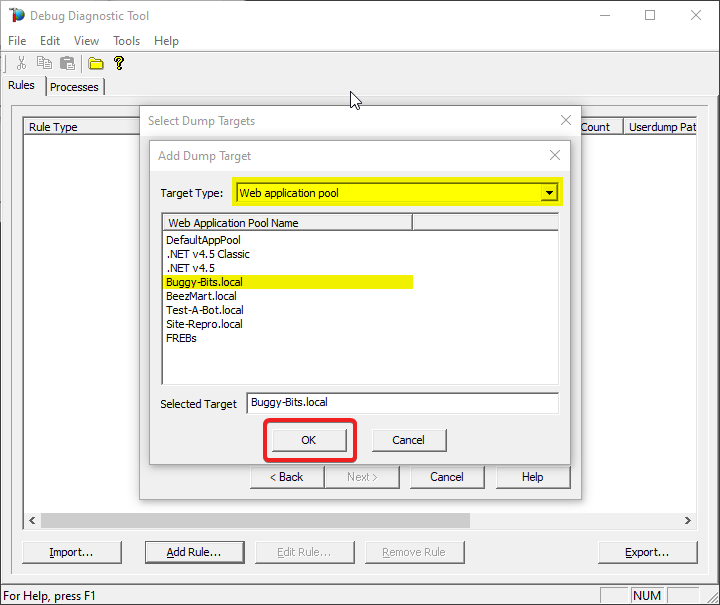
Select Web application pool as Target type and select the application pool
#11.
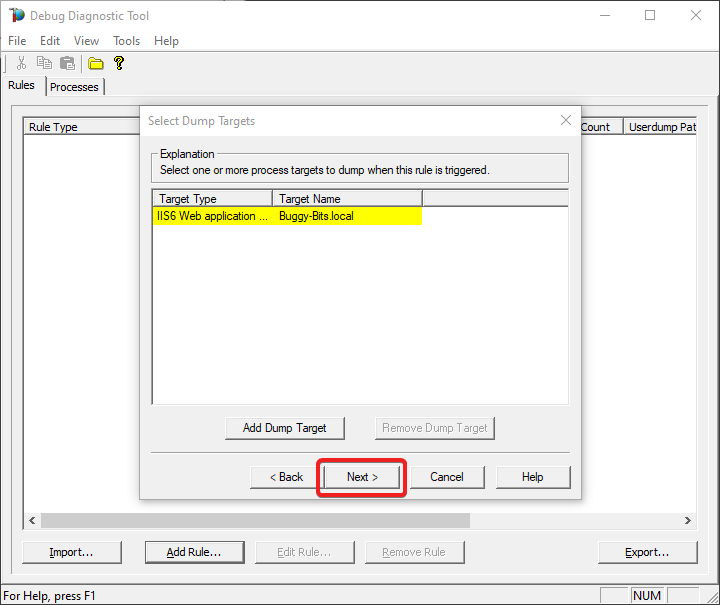
Click on Next
#12.
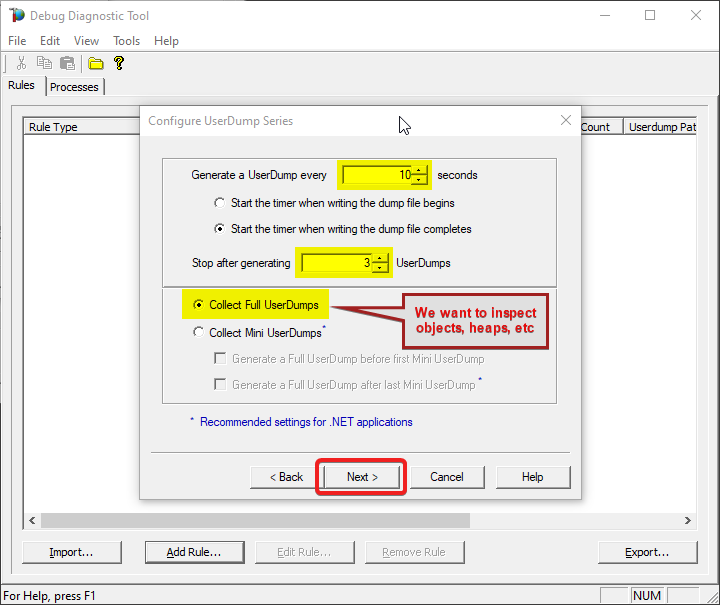
Set 10 seconds at Generate a UserDump every…
Set 3 at Stop after Generating…
Select Collect Full UserDumps.
#13.
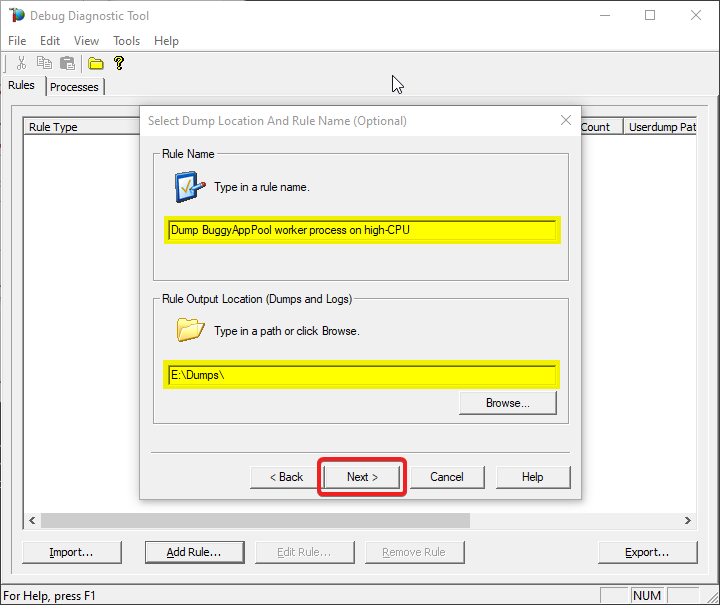
Type down a descriptive name, i.e. “My App eats a lot of CPU” and select the dump files path.
Keep in mind you’re collecting 4 dumps. Please make sure that there is enough disk space on the drive where dumps are collected. Each process dump will take space in the disk approximately the same size the process uses in memory (column Commit Size in Task Manager). For example, if the w3wp.exe process memory usage is ~2 GB, then the size of each dump file will be around 2 GB.
Do not choose a disk in network/UNC; choose a local disk.
#14.
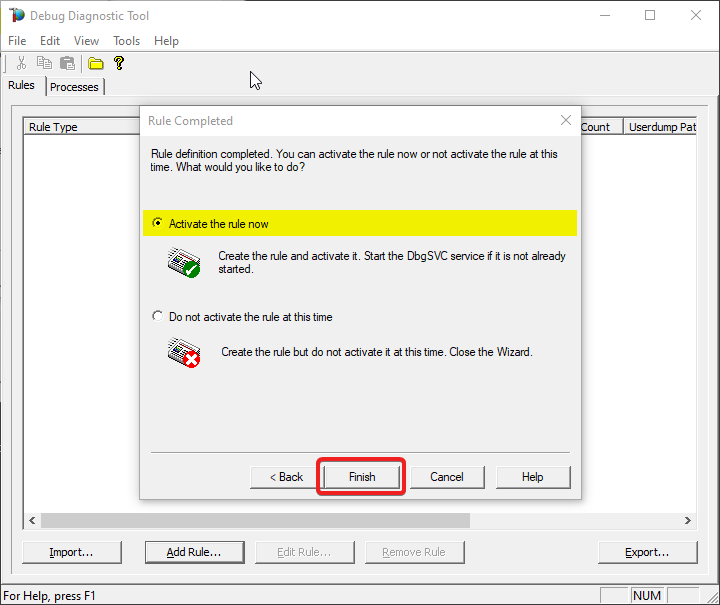
Select “Activate rule now” option and click on “Finish”
#15.
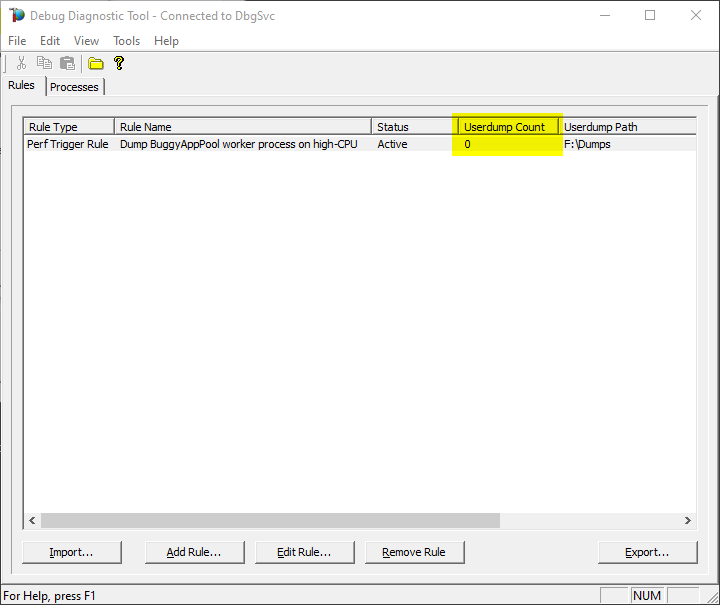
Watch the rule in DebugDiag; it should tell you how many dumps are collected (present in the selected dumps folder).
#16.
Once the memory dumps are collected and fully written on disk…
Archive each dump file in its own ZIP and prepare to hand over to the support engineer; upload in a secure file transfer space.
Remember my article about how exceptions are handled and how to collect memory dumps to study them. We can double check if a crash occurred or not: read about w3wp.exe crashes.
Aside: Just in case you are wondering what I use to capture screenshots for illustrating my articles, check out this little ShareX application in Windows Store.
Brought to you by Dr. Ware, Microsoft Office 365 Silver Partner, Charleston SC.


Recent Comments