This article is contributed. See the original author and article here.
Introduction:
In this blog, we will look at how we configure near real-time monitoring of SQL Server on Linux and containers with the Telegraf-InfluxDB and Grafana stack. This is built on similar lines to Azure SQLDB and Managed Instance solutions already published by my colleague Denzil Ribeiro. You can refer to the above blogs to know more about Telegraf, InfluxDB and Grafana.
A quick rundown of all the tasks we’ll be carrying out to complete the setup:
- We will first install the Telegraf, InfluxDB, and Grafana containers on the monitoring host machine. You may be wondering why containers are used? because they are simple to set up and also provide isolation.
- Then, we will prepare the target SQL Server instances that we will monitor by creating the login on all of the target SQL Server instances (SQL Server on Linux/containers/Windows) that telegraf will use to connect to SQL Server instances for data collection.
- As this is a demo, I am running all three containers on a single host machine, but depending on the instances you monitor and data that is collected, you may decide to run the containers on different nodes.
- The data retention policies of InfluxDB will then be configured. The retention policy ensures that Influxdb does not grow out of bounds.
- Finally, we will configure and set up Grafana to create our dashboard with graphs and charts.
Let’s Build:
For this demonstration, the host on which I deploy the containers is an Azure VM running Ubuntu 20.04. I’m collecting data from the four SQL Server instances listed below:
- A SQL Server instance running on RHEL.
- Two SQL Server container instances, one deployed using the Ubuntu image and the other using the RHEL image.
- A SQL Server running on Windows.
Let’s start deploying containers:
- Install docker on the Ubuntu 20.04 host, which is our monitoring VM. To install Docker on Ubuntu 20.04 VM, refer to this article.
- Run the command below to create a docker network. This is the common network on which all three containers (Telegraf, InfluxDB, and Grafana) will be deployed.
docker network create --driver bridge influxdb-telegraf-net #You can change the name of the network from “influxdb-telegraf-net” to whatever you want.you can list the network using the command
docker network ls
We will now create the SQL Server login that telegraf will use to connect to the target SQL Server instances. This login must be created on all target SQL Server instances that you intend to monitor. You can change the login name from telegraf to any other name of your choice, but the same also needs to be changed in the telegraf.conf file as well.
USE master;
CREATE LOGIN telegraf WITH PASSWORD = N'StrongPassword1!', CHECK_POLICY = ON;
GO
GRANT VIEW SERVER STATE TO telegraf;
GO
GRANT VIEW ANY DEFINITION TO telegraf;
GO
Run the following command to deploy the telegraf container
docker run -d --name=telegraf -v /home/amvin/monitor/sqltelegraf/telegraf.conf:/etc/telegraf/telegraf.conf --net=influxdb-telegraf-net telegraf # where:/home/amvin/monitor/sqltelegraf/telegraf.conf is a telegraf configuration file placed on my host machine, please update the path as per your environment. # please ensure that you change the IP addresses and port numbers to your target SQL Server instances in the telegraf.conf file that you create in your environment.Note: You can download the sample telegraf.conf from here. Please remember to change the IP address to your target SQL Server instance IP addresses.
- Run the following command to deploy the InfluxDB container
docker run --detach --net=influxdb-telegraf-net -v /home/amvin/monitor/data/influx:/var/lib/influxdb:rw --hostname influxdb --restart=always -p 8086:8086 --name influxdb influxdb:1.8 # where: /home/amvin/monitor/data/influx is a folder on the host that I am mounting inside the container, you can create this folder in any location. # please ensure you set the right permissions so files can be written inside this folder by the container. - Deploy the Grafana container using the following command
docker run --detach -p 3001:3000 --net=influxdb-telegraf-net --restart=always -v /home/amvin/monitor/data/grafana:/var/lib/grafana -e "GF_INSTALL_PLUGINS=grafana-azure-monitor-datasource,grafana-piechart-panel,savantly-heatmap-panel" --name grafana grafana/Grafana

# where: home/amvin/monitor/data/grafana is a folder on the host that I am mounting inside the container, you can create this folder in any location.
# please ensure you set the right permissions so files can be written inside this folder.
With the containers now deployed, use “docker ps -a” to list them, and you should see something like this:

Note: Please ensure that you open the ports on the host to which Grafana and InfluxDB containers are mapped to, in this case they are 3000 and 8086 respectively.
Let’s now setup retention policy on InfluxDB to ensure that there is limited growth of the database. I am setting this for 30 days, you can configure it as per your requirement.
sudo docker exec -it influxdb bash
#then run beow commands inside the container
influx
use telegraf;
show retention policies;
create retention policy retain30days on telegraf duration 30d replication 1 default;
quit
Setting up Grafana:
We are now ready to create the dashboard, before that we need to setup Grafana and to do that follow the below steps:
- Browse to your Grafana instance – http://[GRAFANA_IP_ADDRESS_OR_SERVERNAME]:3000
- First time you login into Grafana, login and password are set to: admin. Also take a look at the Getting Started Grafana documentation.
- Add a data source for InfluxDB. Detailed instructions are at in the grafana data source docs
- Type: InfluxDB
- Name: InfluxDB (this is also the default)
- URL: http://[INFLUXDB_HOSTNAME_OR_IP_ADDRESS]:8086. (The default of http://localhost:8086 works if Grafana and InfluxDB are on the same machine; make sure to explicitly enter this URL in the field. )
- Database: telegraf
- Click “Save & Test”. You should see the message “Data source is working”.
- Download Grafana dashboard JSON definitions from the repo from here and then import them into Grafana.
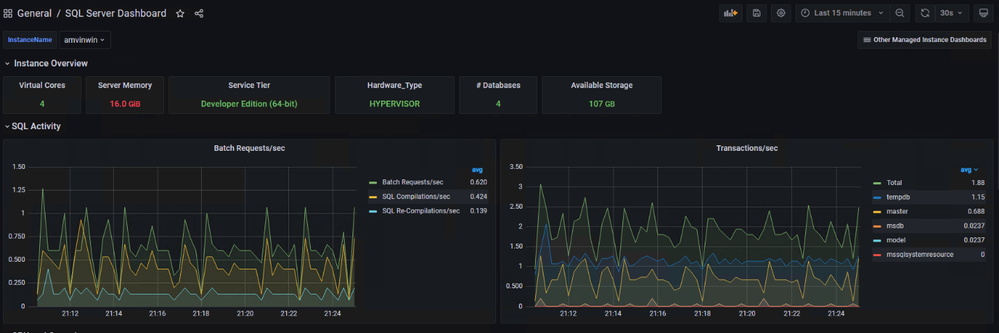
You are ready and this is how the dashboard should look, feel free to modify the graphs as per your requirement.


Brought to you by Dr. Ware, Microsoft Office 365 Silver Partner, Charleston SC.


Recent Comments