This article is contributed. See the original author and article here.
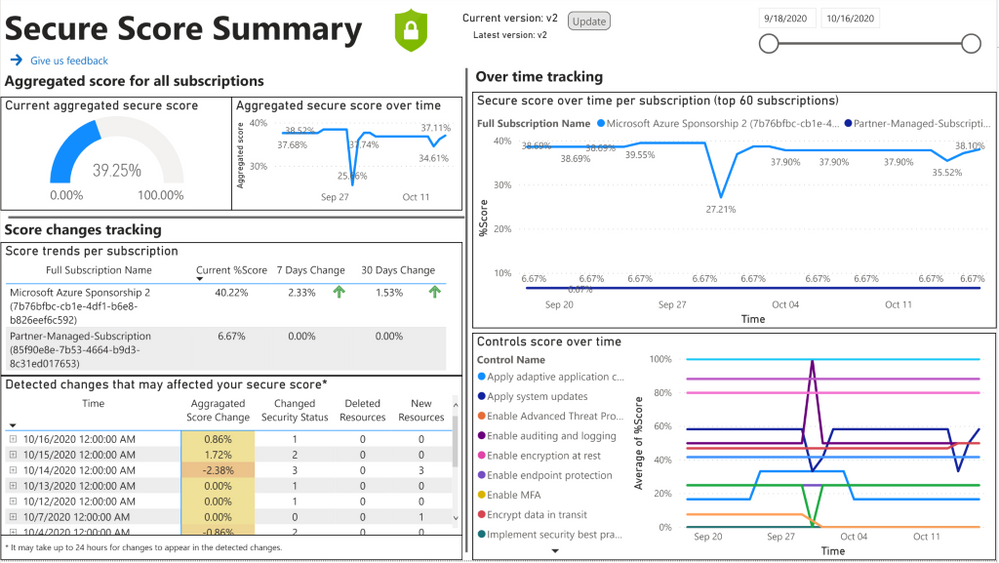
As organizations start to use Azure Security Center Secure Score to measure their journey to a better cloud security posture, it becomes important to understand how this secure score is progressing over time. With our new Power BI dashboard, you will be able to track your secure score progress over time and your resources’ health.
The dashboard contains out-of-the-box reports that will help you analyze your security status by providing the necessary information to investigate changes in your score over time.
By using the dashboard you can infer actionable insights regarding your security status. For example, discover which resources should be addressed due to recent changes and which areas require more attention. The dashboard consists of two reports:
- Secure Score Summary provides summarized data regarding your score progress.
- Resources Summary provides summarized data regarding your resources’ health.
In the Secure Score Summary report, you can use the “Secure score over time per subscription” chart to see changes in the score. In case you observed a dramatic change in your score, you can find in the “detected changes that may affect your secure score” table which changes might have caused the score to drop. This table presents deleted resources, newly deployed resources, or resources that their security status changed for one of the recommendations. A sample of this Power BI dashboard is shown below:

Let’s use a sample scenario where the secure score dropped by 10%. Looking at the detected changes table, you found a VM that its security status changed on the same day. If the VM changed to unhealthy for one of the recommendations, it can explain the drop. Your next step will be to investigate what was the change and which recommendation you need to remediate to make this resource healthy again. To do that you can use the “Resources that changed their security status” table, which presents more details about the changed resources. Another option is to use “Unhealthy resources over time per recommendation” that presents the number of unhealthy resources for each recommendation every day. Looking at this chart you can observe recommendations that their number of unhealthy resources increased on the same date the score was dropped. Pressing on the recommendation line will filter the “Resources that changed their security status” table according to the date and recommendation you choose. Once you find the resource and the recommendation that caused the score to drop, you can contact the resource owner for remediation.
In addition to the over time tracking, you can leverage the Resources Summary report to understand your current security status. Using the “Controls status sorted by potential impact” chart you can see the percentage of unhealthy resources per control, and in case you want to drill down to a specific recommendation you have the “Recommendations current state” table.
Fig 2: Resources Summary report
More details about the dashboard and installation guidelines can be found here.
Send feedback
Have you tried the dashboard? Help us getting better by filling this form. Your feedback is highly appreciated.
Reviewers
Yuri Diogenes – Principal Program Manager, CxE
Miri Landau – Senior Program Manager, Azure Security Center
Moshe Israel – Senior Data Scientist, Azure Security Center
Shahar Weiss – Senior Software Engineer, Azure Security Center
Brought to you by Dr. Ware, Microsoft Office 365 Silver Partner, Charleston SC.


Recent Comments