by Contributed | Sep 23, 2020 | Azure, Technology, Uncategorized
This article is contributed. See the original author and article here.
Azure SQL Managed Instance is a fully-managed, secure, and always up-to-date SQL instance in the cloud. It provides state-of-the-art capabilities and industry-leading SLAs, allowing you to easily migrate and modernize your mission-critical applications in Azure.
Azure SQL Managed Instance is constantly being improved based on the customer feedback. There are many important updates to Managed Instances that will be launched as part of Ignite 2020 virtual conference (more details to follow in the upcoming blog posts), but in this post we’ll go deeper into the recent improvements in the areas of performance and cost efficiency.
Significantly improved transaction log write throughput
We have significantly improved the transaction log write throughput (often referred to as “log rate”) for the Azure SQL Managed Instances, greatly improving the overall performance for usage scenarios such as data ingestion and index maintenance.
The following table and the diagram summarize the improvements:
|
|
Previous log rate limit
|
New log rate limit
|
|
General Purpose
|
3 MB/s per vCore
Up to 22 MB/s per instance
|
3 MB/s per vCore
Up to 120 MB/s per instance
Per-database cap of 22-65 MB/s
|
|
Business Critical
|
4 MB/s per vCore
Up to 48 MB/s per instance
|
4 MB/s per vCore
Up to 96 MB/s per instance
|
General Purpose instances now have more than 5x larger per-instance log rate cap compared to the previous setting (120 MB/s versus 22 MB/s). However, the per-instance log rate cap cannot be achieved by a single database. The per-database log rate cap depends on the log file size (as explained in this blog post), and can go from 22 MB/s to 65 MB/s, as per the summary in the following table:
|
Log file size
(SQL MI General Purpose)
|
Log rate limit
|
|
<= 128 GB
|
22 MB/s
|
|
<= 512 GB
|
30 MB/s
|
|
<= 1 TB
|
50 MB/s
|
|
<= 2 TB
|
65 MB/s
|
The significantly improved log rate makes the General Purpose service tier an ideal candidate for hosting smaller (<8 TB in size) data marts and warehouses, due to greatly improved data loading speed.
When it comes to Business critical instances, the log rate cap is flat out doubled from 48 MB/s to 96 MB/s, with no per-database cap limitations (i.e. a single database on a Business Critical instance can use up the whole 96 MB/s log rate quota).
Improved data and log IOPS for Business Critical instances
Business Critical instances now have significantly improved IOPS rates for data and log operations. Previous limit of 2500 IOPS per vCore is now increased to 4000 IOPS per vCore, providing a fantastic 60% increase.
Improved IOPS rate will make the Business Critical tier an even better fit for the high-volume transactional processing workloads (OLTP scenarios).
Improved performance predictability for General Purpose instances
In one of our previous blogs we’ve shared the details on how the storage subsystem of General Purpose Managed Instances is designed. Essentially, we’re using remote storage (Azure Storage Premium Disks) to store the database and log files. While this design is both simple and scalable, it presents an interesting set of challenges since every disk I/O in Azure SQL Managed Instance becomes a network I/O against another Azure service.
We’ve taken great care to optimize the integration with Azure Storage to maximize the throughput, reduce the latency and improve the performance predictability. Our I/O scheduling, throttling and governance algorithms have been tweaked to ensure the smoothest possible experience for our customers.
Improved tempdb performance
Previously, the tempdb I/O operations were governed as part of the instance log rate cap (which used to be configured to 22 MB/s for General Purpose and 48 MB/s for Business Critical). With this set of improvements, tempdb I/O operations are no longer governed as part of the instance log rate cap, allowing for a significantly higher tempdb I/O rates.
The improved tempdb performance will greatly improve the speed of tempdb-bound operations, such as running queries with large sorts/spills, or data loading through tempdb.
Testing Results
When all the above improvements are combined, the end-result is a significant improvement to the performance of your SQL Managed Instance. The exact performance gain will vary based on your chosen service tier and your database workloads, but the improvements we’ve seen based on our testing are very encouraging:
- TPC-C – up to 2x-3x transaction throughput
- TPC-H – up to 23% lower test execution time
- Scans – up to 2x throughput
- Data Ingestion – 2x-3x data ingestion rate
More bang for your buck
These improvements are a fantastic value for our customers since there are no associated pricing changes. Basically, we’ve upgraded the “horsepower” of the SQL MI engine for no extra charge, providing an even better value for your investment.
Also, these changes were automatically enabled for all existing and future Azure SQL Managed Instances during the first half of September – we expect our customers will be pleasantly surprised when they discover this.
Conclusion
These performance improvements make Azure SQL Managed Instance an excellent choice for your performance-hungry database workloads.
And if you’re still new to Azure SQL Managed Instance, now is a great time to get started and take Azure SQL Managed Instance for a spin!
References
- For more details on Azure SQL Managed Instance resource limits, check out the public documentation
- For details on other improvements to Azure SQL Managed Instance launched at Ignite 2020, please see this blog
by Contributed | Sep 22, 2020 | Azure, Technology, Uncategorized
This article is contributed. See the original author and article here.
Azure Monitor provides a rich set of enterprise ready capabilities to ensure you have complete observability of your hybrid environment, helping you keep it always available, reliable and performant. We announced a whole set of new capabilities at Microsoft Ignite 2020, helping you get richer insights for your Azure and hybrid resources, apply benefits of Log Analytics workspaces & dedicated clusters to Application Insights, and create/manage alerts more effectively.
You can refer to our on-demand Ignite Session to learn more about what’s new in Azure Monitor, and see demos of many of these new capabilities.
Insights for Azure & Hybrid Resources
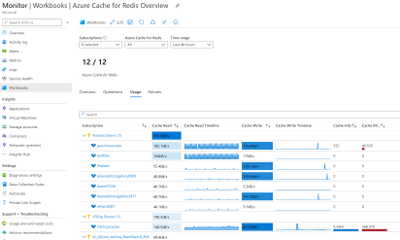
- General Availability of Azure Monitor for Key Vault and Azure Monitor for Azure Cache for Redis, providing out of the box insights for these resources using rich platform telemetry.

- Integration of Application Change Analysis with Azure Monitor for VMs, enabling you to correlate issues with changes on that VM.

- End-to-end monitoring of AKS Kube State is now generally available in Azure Monitor for Containers. There is also a preview of Azure Monitor for Network Policy Manager for AKS.

- Azure Monitor for Networks now provides easy access to Traffic Analytics and Network Diagnostics tools for all your networking resources from one place.
Log Analytics Dedicated Clusters
- Dedicated clusters help you to handle large scale deployments better by taking advantage of data encryption at rest (with Customer Managed Keys) & Lockbox, and even configure cluster level capacity reservation with discounted pricing.
General Availability of workspace-based Application Insights
- Azure Monitor Application Insights now integrates deeply with Log Analytics using a unified workspace-based mode enabling you to store your app logs and your platform/infrastructure logs together in one place. Some of the enterprise readiness capabilities you can now take advantage of:
- Data encryption at rest with Customer Managed Keys
- Network isolation via Private Links
- Capacity Reservation with discounted pricing
- Data access control with LockBox
- Continuous Export of App Logs to Azure Storage/Event Hub via Diagnostic Settings
- Bring-your-own-Storage (BYOS) for code-level profiler/debugger diagnostics
Alerting Enhancements
- Resource-centric log alerts in Azure Monitor are now in preview, supporting any resource in Azure that has logs enabled, with a new experience that allows you to create alerts on multiple resources using subscription and resource group scopes.

- Secure Export is a new preview version of Azure Monitor ITSM Connector, allowing you to automatically send Azure AD authenticated alerts to an ITSM tool (partnering with BMC Helix as the first native integration).
- Native health monitoring with Azure Deployment Manager by integrating Azure Monitor alerts for health checks during deployments.
To learn more about Azure Monitor and monitoring best practices, check out the documentation and how-to videos. If you have any questions or suggestions, reach out to us through our Tech Community forum.
by Contributed | Sep 22, 2020 | Azure, Technology, Uncategorized
This article is contributed. See the original author and article here.
This blog post is a collaboration between @JulianGonzalez and @ZhipengZhao
For those that have wanted to get into the Azure Sentinel notebooks, but are more comfortable with PowerShell than Python, we have news for you. Using the latest version of the Azure Sentinel notebooks, you can now enable PowerShell notebooks via .Net Interactive Public Preview.
To get started, you will need to install .Net Interactive Public Preview on your notebook server and enable the PowerShell kernel. This article also includes a companion Azure Sentinel PowerShell notebook to get you started and be sure to check out the Azure Sentinel notebook official documentation for details on configuring the environment.
What are PowerShell Jupyter notebooks?
The Jupyter notebook is an interactive open source programming tool for data analytics and visualizations. A notebook is divided into cells. Each cell is a section that can combine the programming code and its output along with markdown, graphs, comments, API results, and other powerful visuals. An analyst can traverse between cells, execute them individually and adjust them on the fly and re-run them if changes are required.
Why PowerShell Jupyter notebooks for threat hunting and investigation?
The interactive nature of notebooks results in iterative and rapid development, as well as code sharing and reuse, thus making notebooks an increasingly popular choice for data scientists and analysts. Notebooks have increasingly become adopted by security analysts to automate frequent mundane tasks, incorporate APIs and visualize and provide context for security datasets. In addition, security analysts can share the code/logic and outcome of a given hunt or investigation which can be run as-is or improved over time. Review this article for a more comprehensive list of capabilities.
Since many security analysts are already comfortable with PowerShell and may already have several go-to scripts for their daily work, PowerShell Jupyter notebooks will help those users embrace Jupyter notebooks to supercharge their threat hunts and investigations!
Leverage charts for your incident and/or hunting data:

Access your hunting queries:

Run KQL queries with interactive input:

Retrieve scan results from Virus Total:


What is .Net Interactive Public Preview and how do I install it?
.Net Interactive Public Preview is a group of tools and APIs that enables users to create embedded .Net Interactive experiences across the web, markdown and notebooks. This includes the ability to author and run notebooks in C#, F# and PowerShell.
Prerequisites
The instructions below assume you have already deployed your Azure Machine Learning (AML) workspace and compute. If you have not already done so, follow the instructions here.
Installing .Net Interactive on your notebook server
Open terminal window on your notebook server:

Once you see the terminal window, you are ready to start:

Check Ubuntu version
cat /etc/*release
Install the .Net SDK and the runtime based on your version
These instructions work for version 16.04. Refer to the .Net Core on Ubuntu documentation (article) for definitive guidance.
wget https://packages.microsoft.com/config/ubuntu/16.04/packages-microsoft-prod.deb -O packages-microsoft-prod.deb
sudo dpkg -i packages-microsoft-prod.deb
sudo apt-get update;
sudo apt-get install -y apt-transport-https &&
sudo apt-get update &&
sudo apt-get install -y dotnet-sdk-3.1
Install dotnet interactive tool source
dotnet tool install -g --add-source "https://dotnet.myget.org/F/dotnet-try/api/v3/index.json" Microsoft.dotnet-interactive
Create a symlink between the installed location of dotnet interactive and your local bin directory:
sudo ln -s /home/azureuser/.dotnet/tools/dotnet-interactive /usr/local/bin/dotnet-interactive
Install Jupyter interactive
dotnet interactive jupyter install
Run Jupyter kernelspec list to verify that PowerShell is listed as a kernel
jupyter kernelspec list
The output should look like this:

Now you will need to clone the Azure Sentinel GitHub repository to your notebook server. (In the near future this step will not be required as this notebook will be added to the Azure Sentinel notebook portal)
git clone https://github.com/Azure/Azure-Sentinel-Notebooks sentinel-notebooks
Important:
!! Before you proceed, if you had the notebook UI open, you must refresh your browser to see the .Net kernel options in the dropdown. (yes, they are cached) !!
Click ‘Refresh’ in the notebook UI to see the files you cloned:

Go to the folder with your cloned files and select the sample PowerShell notebook:

Your notebook is now ready to go, select the PowerShell kernel from the drop down to start:

by Contributed | Sep 22, 2020 | Azure, Technology, Uncategorized
This article is contributed. See the original author and article here.
This blog post is a collaboration between @JulianGonzalez and @ZhipengZhao
For those that have wanted to get into the Azure Sentinel notebooks, but are more comfortable with PowerShell than Python, we have news for you. Using the latest version of the Azure Sentinel notebooks, you can now enable PowerShell notebooks via .Net Interactive Public Preview.
To get started, you will need to install .Net Interactive Public Preview on your notebook server and enable the PowerShell kernel. This article also includes a companion Azure Sentinel PowerShell notebook to get you started and be sure to check out the Azure Sentinel notebook official documentation for details on configuring the environment.
What are PowerShell Jupyter notebooks?
The Jupyter notebook is an interactive open source programming tool for data analytics and visualizations. A notebook is divided into cells. Each cell is a section that can combine the programming code and its output along with markdown, graphs, comments, API results, and other powerful visuals. An analyst can traverse between cells, execute them individually and adjust them on the fly and re-run them if changes are required.
Why PowerShell Jupyter notebooks for threat hunting and investigation?
The interactive nature of notebooks results in iterative and rapid development, as well as code sharing and reuse, thus making notebooks an increasingly popular choice for data scientists and analysts. Notebooks have increasingly become adopted by security analysts to automate frequent mundane tasks, incorporate APIs and visualize and provide context for security datasets. In addition, security analysts can share the code/logic and outcome of a given hunt or investigation which can be run as-is or improved over time. Review this article for a more comprehensive list of capabilities.
Since many security analysts are already comfortable with PowerShell and may already have several go-to scripts for their daily work, PowerShell Jupyter notebooks will help those users embrace Jupyter notebooks to supercharge their threat hunts and investigations!
Leverage charts for your incident and/or hunting data:
Access your hunting queries:
Run KQL queries with interactive input:
Retrieve scan results from Virus Total:
What is .Net Interactive Public Preview and how do I install it?
.Net Interactive Public Preview is a group of tools and APIs that enables users to create embedded .Net Interactive experiences across the web, markdown and notebooks. This includes the ability to author and run notebooks in C#, F# and PowerShell.
Prerequisites
The instructions below assume you have already deployed your Azure Machine Learning (AML) workspace and compute. If you have not already done so, follow the instructions here.
Installing .Net Interactive on your notebook server
Open terminal window on your notebook server:
Once you see the terminal window, you are ready to start:
Check Ubuntu version
cat /etc/*release
Install the .Net SDK and the runtime based on your version
These instructions work for version 16.04. Refer to the .Net Core on Ubuntu documentation (article) for definitive guidance.
wget https://packages.microsoft.com/config/ubuntu/16.04/packages-microsoft-prod.deb -O packages-microsoft-prod.deb
sudo dpkg -i packages-microsoft-prod.deb
sudo apt-get update;
sudo apt-get install -y apt-transport-https &&
sudo apt-get update &&
sudo apt-get install -y dotnet-sdk-3.1
Install dotnet interactive tool source
dotnet tool install -g --add-source "https://dotnet.myget.org/F/dotnet-try/api/v3/index.json" Microsoft.dotnet-interactive
Create a symlink between the installed location of dotnet interactive and your local bin directory:
sudo ln -s /home/azureuser/.dotnet/tools/dotnet-interactive /usr/local/bin/dotnet-interactive
Install Jupyter interactive
dotnet interactive jupyter install
Run Jupyter kernelspec list to verify that PowerShell is listed as a kernel
jupyter kernelspec list
The output should look like this:
Now you will need to clone the Azure Sentinel GitHub repository to your notebook server. (In the near future this step will not be required as this notebook will be added to the Azure Sentinel notebook portal)
git clone https://github.com/Azure/Azure-Sentinel-Notebooks sentinel-notebooks
Important:
!! Before you proceed, if you had the notebook UI open, you must refresh your browser to see the .Net kernel options in the dropdown. (yes, they are cached) !!
Click ‘Refresh’ in the notebook UI to see the files you cloned:
Go to the folder with your cloned files and select the sample PowerShell notebook:
Your notebook is now ready to go, select the PowerShell kernel from the drop down to start:
by Scott Muniz | Sep 22, 2020 | Azure, Technology, Uncategorized
This article is contributed. See the original author and article here.
For several years, Red Hat and Microsoft have partnered to create cloud solutions that enable enterprises to achieve more. Azure Red Hat Openshift, released in 2019, brought a jointly-managed enterprise-grade Kubernetes solution to Azure. Since 2016, Azure has offered Red Hat Enterprise Linux (RHEL) on virtual machines.
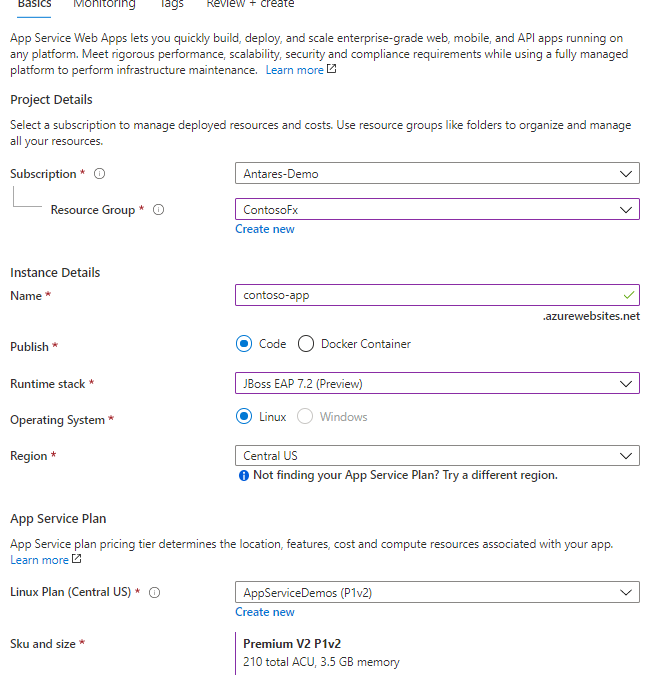
You can now run JBoss EAP on Azure App Service. For readers who are not familiar, Azure App Service is a managed hosting service for web and API applications, providing features for auto-scaling, networking, authorization, and more. With App Service, you can deploy WAR and EAR applications using App Service’s deployment API’s or CI/CD integration. Once your apps are deployed, set up auto-scaling to handle periods of higher load.

Whether your organization is running a heavily customized, clustered JBoss EAP deployment or has embraced container technologies, Azure has a cloud service to fit your needs. With RHEL on Azure Virtual Machine Scale Sets (VMSS), you can easily lift-and-shift your on-prem JBoss EAP deployments. Azure Red Hat OpenShift combines the innovation of enterprise Kubernetes with the world’s leading enterprise Linux platform, Red Hat Enterprise Linux. App Service now gives Jakarta EE developers the option to leverage a managed Platform-as-a-Service (PaaS) for their cloud migrations.
The JBoss EAP on Azure App Service experience has been jointly developed and supported by Red Hat and Azure. Once JBoss EAP on Azure App Service becomes generally available, any support cases concerning the JBoss server will be handled by the experts at Red Hat. Any cases concerning the App Service platform will be resolved by Azure support. In other words, your cases will be handled by the leading experts.
During the public preview, JBoss EAP 7.2 is offered on Red Hat Enterprise Linux 7 using OpenJDK 8. A version of JBoss EAP on Java 11 will be available later during the public preview. JBoss EAP on Azure App Service is at current prices. As a preview release, there is no commercial support offering and use of the preview is limited to development and testing of your applications. The General Availability release of JBoss EAP on App Service will include a service fee for the integrated technical support. If you create a JBoss EAP instance on App Service, you will receive an email notice prior to the GA release with more details on the pricing changes.
Get started today – try JBoss EAP on Azure App Service.
Resources:

Recent Comments