by Scott Muniz | Aug 11, 2020 | Azure, Microsoft, Technology, Uncategorized
This article is contributed. See the original author and article here.
by @Edwin Hernandez
In this article, I will describe the implementation of a logger for UI Test automation and the integration with test execution from an Azure DevOps Release pipeline. This article and the demo solution are standalone articles; however, I do build on concepts we reviewed on previous articles, specifically:
You may want to read through those articles before starting with this one. Having said that, let us get started describing what the logger does.
Purpose
UI Test automation and Regression are time-consuming expensive tasks because of their initial time investment and their maintenance effort. Even if a test suite is well maintained, once Automated Regression is executed, you still need a QA Automation Engineer to analyze the results and investigate any errors.
The purpose of this logger is to provide a detailed log of the flow of the UI script, including test case steps and screenshots. The QA Engineer or a Business Analyst can use the information from the logger to follow the business logic of the UI test and more easily validate if the intended work was completed or the reason for failure if an error occurred. A descriptive log can be more useful than even an actual video recording of the test.
Logger Features
- The logger creates a single HTML file that contains all messages and embedded images.
- This class is meant to be used in a Page Object Model project, when the LogMessage method is called it reflects itself to get the calling method and class and it uses this information to write a message into the HTML log.
- There are 4 log levels to help filtering how much information you want to log (error, warning, passed, info). This and other configurations are exposed as global variables. You can also specify the level up to which you want screenshots to be taken.
- Screenshots are saved as binary strings and embed into the HTML file so that you end up with a single file. This greatly helps the integration with Azure DevOps.
- This logger is adaptable since it is a standalone class. You can plug it into several types of UI Test projects. I have personally used it with WinAppDriver, CodedUI, Selenium WebDriver, and Xamarin.UITests projects with minimal changes, pretty much all that needs to be changed is the type of session object that is passed as an argument and the screenshot method.
Logger Requirements
- Given the frameworks I just mentioned, you can guess that this Logger class was written in C# and is meant to be used on Visual Studio for UI Test projects running over MSTest or NUnit projects. You could adapt it to other types of frameworks, but it would require more work.
- As I said this logger is meant to be used as part of a Page Object Model (POM), it is not that you couldn’t use it with a straight Top to Bottom test but you would take more advantage of it in a POM project.
Other than that, the log method needs to be specifically called every time something needs to be logged. I explored the option of using the constructor or interfaces, but it would require the class to be more coupled with the test solution and I wanted it to be more portable.
Configuration Variables
The logger configuration variables should be put for example on the Class Initialize method:

A log level of 4 would log all messages, a log level of 3 would log only messages level 1 to 3. You can change the labels of the labels in the HTMLLogFile class itself.
Logging Messages from the Test Method
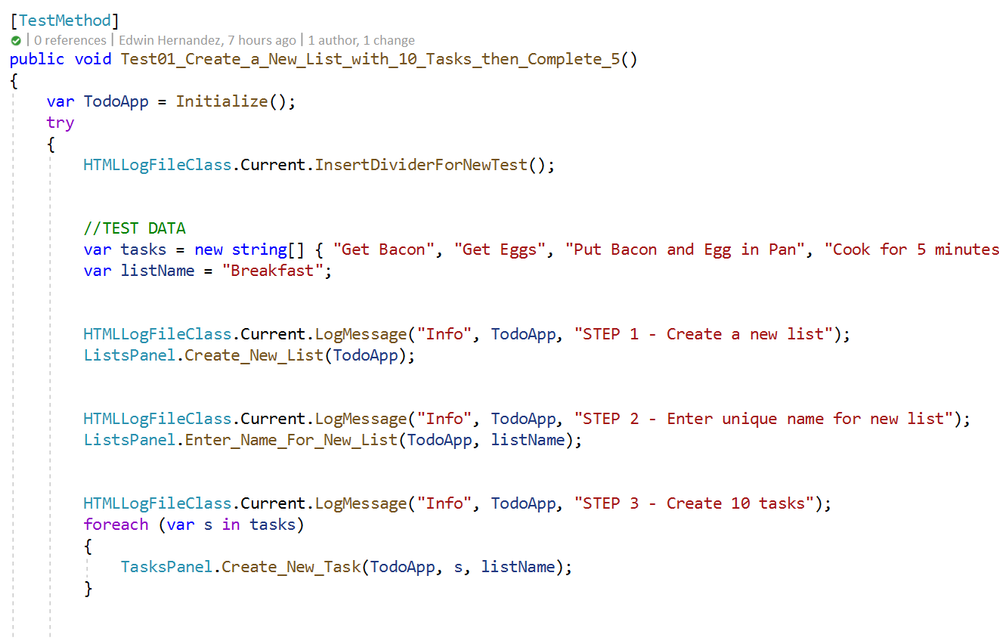
As I mentioned earlier, the LogMessage method needs to be called every time something is to be logged into the file. I recommend that only “Info” level messages should be logged from the Test Method, mostly to log comments and business step details that would make the HTML report easier to read, for example:

The InsertDividerForNewTest creates a header for the report, then every “Info” step is logged with or without screenshots depending on the configured level.
Logging Messages from the Page Class Methods
This may be the most interesting part, every time you use LogMessage from the Page Class Methods, the HTMLLogFile class will use reflection to get the calling method/class information and it will include this information into the HTML report, take the following for example:

By including LogMessage “Passed” at the end, the HTML log will print the following:
Thus, by having well-constructed Page Object Classes, the log would build itself with very few additional comments.

Finding the Log for Local Test Executions
To have this HTML file to be uploaded to Azure DevOps it must be part of the Test Context. This part is included in this demo in the Class Cleanup Method:

If the UI test is executed from Visual Studio (make sure you have WinAppDriver installed, please check my other post about this on the top). The Test Detail Summary should show additional output already part of the Test Context, and inside of that you can see the HTML file:

.

If you open that, the HTML log should have a header, then every Log Message. Please note that screenshots are expandable on hover.

Integration with Azure DevOps Release Pipeline
Now for the next part, I will only show what the result would look like. Setting up a Release Pipeline in Azure DevOps for UI Test Regression is not in the scope of this article. I intend to cover that in a future article, there are several ways to accomplish that depending on what you need to do.
For now, the screenshot below is a simple Release Pipeline that takes the Test Assemblies as an artifact, executes the Tests on a Private (Self-Hosted) Build Agent set on interactive mode.
MSTest automatically uploads to the Release Pipeline test results information (# of test passed, pass %, duration, etc.) and if you expand a specific test and navigate to the Attachments panel, the HTML Log file should be there already associated with that test. Every test will get a unique HTML file:

The benefits of running Regression from a Release Pipeline are related to traceability against a Build/Environment and even user stories and test cases. For deployment approval and for historical purposes since tests are saved into the cloud instead of local files.
Download Demo Project and HTMLLogFIle class
You can find at the bottom of this post, a file containing a Visual Studio solution that has a demo POM library project, a test project, and the HTMLLogFIle class, as well as a demo HTML report file as a reference.
If you have any comments/concerns, please reach out or comment below.
by Scott Muniz | Aug 11, 2020 | Azure, Microsoft, Technology, Uncategorized
This article is contributed. See the original author and article here.
This installment is part of a broader series to keep you up to date with the latest enhancements to the Azure Sentinel Devops template.
This blog is a collaboration between @Cristhofer Munoz & @Matt_Lowe.
Introduction
Threats are evolving just as quickly as data-volume growth, with bad actors exploiting every possibility and technique to gain access to the corporate network. At the same time, the risk surface has widened as companies shift to hybrid-cloud environments, adopt DevOps and Internet of Things (IoT) technologies, and expand their remote workforces.
Amid this landscape, organizations require a bird’s-eye view of security posture across the enterprise, hence a security information and event management (SIEM) system is a critical element.
Frankly, deploying a SIEM is not a trivial task. Organizations struggle with the number of tasks to adopt a SIEM due to the lack of an agile methodology to plan, execute, and validate its initial success and deploy into production.
To help alleviate this challenge, we’ve developed an Azure Sentinel DevOps Board Template which serves as a blueprint to understand the tasks and activities to deploy Azure Sentinel following recommended practices. By leveraging the Azure Sentinel DevOps Boards one can quickly start tracking user stories, backlog items, task, features, and bugs associated with your Azure Sentinel deployment. The Azure Sentinel DevOps Board is not a static template, it can be modified to reflect your distinctive needs. You will have the ability to quickly add and update the status of work using the Kanban board. You can also assign work to team members and tag with labels to support queries and filtering.
For additional information on Azure Boards, please refer the public documentation.
In this template we provide prescriptive guidance for the following Azure Sentinel use cases:
- Define Use Cases
- Get Started with Azure Sentinel | Tutorials
- Onboard Azure Sentinel | Prerequisites
- Azure Sentinel Architecture
- Setup Azure Sentinel
- Data Collection
- Visualize your security data with Workbooks
- Enabling Analytics
- Respond to threats
- Proactive threat hunting
- Advanced Topics

Getting Access | Azure DevOps Generator
The purpose of this initiative is to simplify the process and provide tactical guidance to deploy Azure Sentinel by providing an Azure Sentinel DevOps board template that provides the prescriptive guidance you need to get going with your deployment. To populate the Azure Sentinel board, we utilized the Azure DevOps Demo generator service to create pre-populated content.
To get started:
1. Browse to the Azure DevOps Demo Generator site by selecting the link, or copy https://azuredevopsdemogenerator.azurewebsites.net/ into your browser’s URL field.
2. Click Sign In and provide the Microsoft or Azure AD account credentials associated with an organization in Azure DevOps Services. If you don’t have an organization, click on Get Started for Free to create one and then log in with your credentials.
3. After signing in, you will arrive at the “Create New Project” page.

4. Provide a name for your project (such as “AzSentinelDeployment”) that you and other contributors can use to identify the project.
5. Next, Select the organization you will use to host the project created by the Azure DevOps Demo Generator. (You may have multiple accounts of which you are a member, and which are associated with your login, so choose carefully.)
6. Lastly, select the demo project template you want to provision by clicking … (Choose Template) button.

7. A new pane will populate providing you the ability to select a pre-populated template. Click on the Azure Community tab, there you will find the Azure Sentinel Devops template.

8. Select the Azure Sentinel Devops template and create the project. Your project may take a couple of minutes for the Demo Generator to provision. When it completes, you will be provided with a link to the demo project.

9. Select the link to go to the new demo Azure DevOps Services project and confirm it was successfully provisioned. You should arrive at the following page:

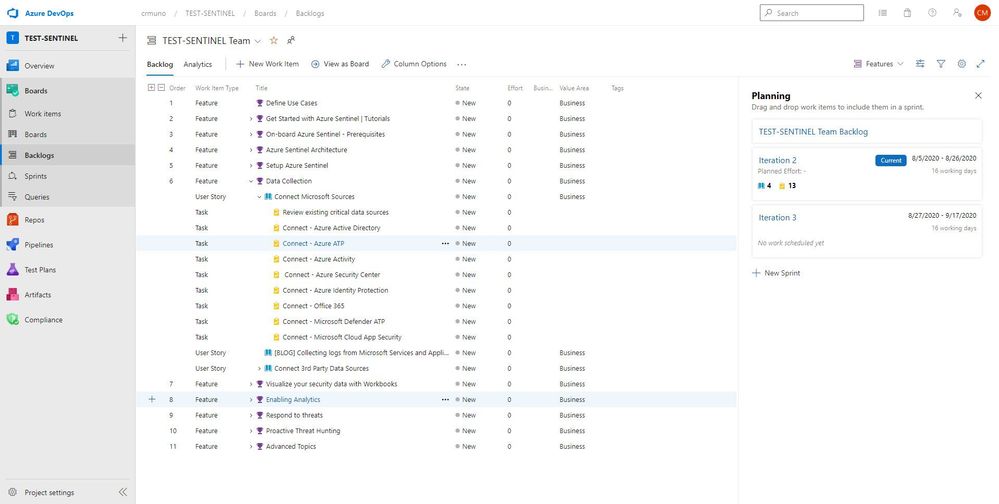
10. To access the Azure Sentinel backlog where you will find the features, user stories, and tasks to deploy Azure Sentinel, hover over Boards, and select Backlogs. Make sure that you are viewing the Features hierarchy. The backlog page will be the main page you will visit to consume the recommended practices and detailed steps to deploy Azure Sentinel.
.

Adding Team Members
1. Open your project, and then select Project settings > Teams. Then, select your project.

2. Select Add to invite members to your project.

3. Add users or groups, and then choose Save.

Enter the email addresses of the new users, separated by semicolons, or enter the display names of existing users. Add them one at a time or all at once.
How to Use
The template is comprised of features, user stories, and tasks providing guidance and recommended practices for your Azure Sentinel deployment. The template should help your team to discuss, agree on acceptance criteria, delegate ownership, create iterations, track the progress and efficiently deploy Azure Sentinel.
Note: Please remember that the template is not static, it can be modified to your reflect distinctive needs. You have the ability to add your own features, user stories, and tasks to reflect your custom use cases.
In this template we provide prescriptive guidance for the following Azure Sentinel use cases:
- Define Use Cases
- Get Started with Azure Sentinel | Tutorials
- Onboard Azure Sentinel | Prerequisites
- Azure Sentinel Architecture
- Setup Azure Sentinel
- Data Collection
- Visualize your security data with Workbooks
- Enabling Analytics
- Respond to threats
- Proactive threat hunting
- Advanced Topics
The use cases above are listed as Features, comprised of user stories and tasks providing detailed steps to satisfy the use case. The user stories and tasks are nested within each feature. Each task under the user stories includes important information such as links to public documentation, blogs, and webinars that provide you the necessary information complete the task.

In total, there are 11 features that have been listed above. Features 1 through 4 cover any initial steps and pre-requisites for preparing your Azure Sentinel deployment. Features 5 through 11 cover the actual steps for setting up and exploring features with Azure Sentinel.
Feature 1: Define Use Cases
Defining use cases is the most important step for this entire process. There must be a need and use when pursuing the deployment of a product. To provide some ideas or guidance, Gartner has created an article that covers how to determine and build great use cases when deploying a SIEM.
Feature 2: Get Started with Azure Sentinel | Tutorials
To help introduce and prepare you for the deployment of Azure Sentinel, this feature includes the well put together Azure Sentinel Ninja Training with additional Kusto training to assist. This training is to help introduce the concepts and features of the product with materials to help educate and prepare your users for day to day usage of Azure Sentinel.
Feature 3: Onboard Azure Sentinel | Prerequisites
It is important to identify and understand what the prerequisites are for deploying and using Azure Sentinel. To assist with this, this feature in the template provides a list of prerequisites as well as any associated documents that provide additional information that will help with addressed them.
Feature 4: Azure Sentinel Architecture
The design of a SIEM is as important as the SIEM itself. When deploying, it is essential to anticipate design, architecture, and best practices. To provide some guidance and advice, a blog that covers the best practices for implementing Azure Sentinel and Azure Security Center is included.
Along with the best practices for implementing Azure Sentinel, it is essential to understand the costs associated with using the product. Azure Sentinel as a service is mostly free but it is important to understand where the costs are coming from and how you can project costs when reviewing data ingestion options and volume. The Azure Calculator is an invaluable tool that assists with this process and can provide insight into how much it will cost to ingest data that is not free.
Feature 5: Setup Azure Sentinel
The use cases have been determined. The learning material has been reviewed. The prerequisites are understood. The architecture is set and the costs are projected. It is time to begin to take action and deploy the resources to set up Azure Sentinel. As covered in the Ninja training, Azure Sentinel is built on top of the Azure Log Analytics service. This service will serve as the main point for ingestion and log retention. The Azure Log Analytics is where one will collect, process, and store data at cloud scale. For reference, documentation for creating a new workspace is listed in this feature. Once the workspace is ready to go, it is time to onboard it to Azure Sentinel. The documentation for onboarding the workspace is also included in the feature.
Once the service is set up, it is time to determine the permissions that are needed for the users that will be using it. Azure Sentinel has 3 different roles backed by Azure role-based access control (Azure RBAC) to provide built-in roles that can be assigned to users, groups, and services in Azure. The document with the roles is listed in the feature. Additionally, permissions can be assigned on the table level for data in order to prevent users from seeing certain data types if desired.
Feature 6: Data Collection
Data ingestion is the oxygen of Azure Sentinel. Azure Sentinel improves the ability to collect and use data from a variety of sources to unblock customer deployments and unlock full
SIEM value.
Setting up data collection begins not only the data ingestion, but also the machine learning capabilities of Azure Sentinel. When exploring the dozens of connectors that are available out of the box, we recommend to enable the Microsoft security data connectors first. Once first part connectors are chosen, it is time to explore the 3rd party connectors. Each connector listed in this feature includes a description and a reference to the associated document.


Feature 7: Visualize your security data with Workbooks
Once data begins to be ingested, it is time to visualize the data to monitor trends, identify anomalies, and present useful information within Azure Workbooks. Out of the box, there are dozens of built-in Workbooks to choose from as well as several from the Azure Sentinel GitHub community page. Within the feature for Workbooks are a few sample Workbooks to consider. Not every data source or connector will have a Workbook but there are quite a few that can be useful.
Feature 8: Enabling Analytics
One of the main features of Sentinel is its ability to detect malicious or suspicious behaviors based on the MITRE attack framework. Out of the box, there are over 100 different detections built in that were made by Microsoft Security Professionals. These are simple to deploy and the feature in the template provides documentation for deploying the template detection rules, as well as the document for creating your own custom detection rules.
Feature 9: Respond to threats
To compliment its SIEM capabilities, Azure Sentinel also has SOAR capabilities. This feature contains helpful documents for setting up Playbooks for automated response, deploying Playbooks from the GitHub repository, and how to integrate ticket managing services via Playbooks.
Feature 10: Proactive threat hunting
To go along with the reactive features, Azure Sentinel also provides proactive capabilities that provide you the ability to proactively search, review, and respond to undetected or potentially malicious activities that may indicate a sign of intrusion/compromise. Azure Sentinel offers dozens out of the box hunting queries that identify potentially exploitable or exploited areas and activities within your environment. This feature within the template provides links and information to ignite your proactive threat hunting journey with out the box threat hunting queries, bookmarks, Azure Notebooks, and livestream.
Feature 11: Advanced Topics
If desired, Azure Sentinel can be deployed and managed as code. To help provide context and guidance, this feature within the template includes a blog post that covers how one can deploy and managed Azure Sentinel as code.
Assign work items to a team member
You can only assign a work item to one person at a time. The Assigned To field is a person-name field designed to hold an user identity recognizable by the system. Within the work item form, choose the Assigned To field to select a project member. Or, you can begin typing the name of a project member to quickly focus your search to a select few.

Tracking Progress with Boards
Azure DevOps utilizes a progress tracking approach that is similar to Agile project management. Boards lists each task, the state of progress, and the individuals that are assigned to the tasks. As the tasks are worked on, they will move within the Board until they are closed. The tasks can also be clicked and dragged around the Board as desired. This will provide you the blueprint understanding the completed and outstanding tasks for your Azure Sentinel deployment.

What’s Next
The current version of the Azure Devops Board template provides you the blueprint to understand the tasks and recommended practices to onboard to Azure Sentinel. The next iteration will incorporate a CI/CD pipeline that will enhance and automate the tasks/phases covered in the Azure Devops Board template. The CI/CD pipeline will automate your Azure Sentinel deployment so you spend less time with the nuts and bolts and more time securing your environment.
Get started today!
Supercharge your cloud SIEM today!
We encourage you to leverage the Azure Sentinel Devops Board template to accelerate your Azure Sentinel deployment following recommended practices.
Try it out, and let us know what you think!
by Scott Muniz | Aug 11, 2020 | Azure, Microsoft, Technology, Uncategorized
This article is contributed. See the original author and article here.
We are bringing this blog post to continue the learning about the protection that Azure Security Center offers for the SQL IaaS VMs. As you learnt in this blog post, Azure Security Center protects SQL servers hosted on either Azure VMs, Azure Arc and on-premises.
SQL Server on Azure Arc
While hybrid approaches bring greater power and flexibility, they also present greater complexity. Azure Arc was announced at Ignite 2019 to better address these challenges. Using Azure Arc, organizations can deliver a broader range of services while simplifying matters of management and security. Azure Arc provides deeper integration across all your Azure environment. Essentially Azure Arc allows organizations to use Azure’s management technologies (“control plane”) to centrally administer public cloud resources along with on-premises servers, virtual machines, and containers. All of Azure’s AI, automation, compliance and security best practices are now available to manage all of their distributed cloud resources, and their underlying infrastructure, which is known as “connected machines.” Additionally, several of Azure’s AI and data services can now be deployed on-premises and centrally managed through Azure Arc, enhancing local and offline management and offering greater data sovereignty.
Utilize Azure Security Center to produce a comprehensive report of vulnerabilities in SQL Servers and get advanced, real-time security alerts for threats to SQL Servers and the OS. Azure Security Center centralizes all security policies and protects the entire managed environment. When Security Center is enabled, the Azure monitoring agents will report data back from the servers, networks, virtual machines, databases, and applications. The Azure Security Center analytics engines will ingest the data and use AI to provide guidance. It will recommend a broad set of improvements to enhance security, such as closing unnecessary ports or encrypting disks and more. Azure Arc extends these security features to connected machines and services to protect all registered resources.
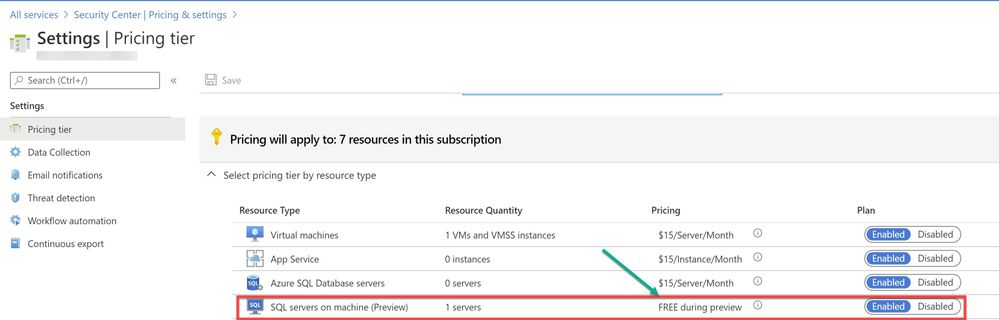
To use this threat detection capability, you need to enable the SQL servers on machine threat bundle in Azure Security Center pricing tier as shown in ‘Image 1’:

Image 1: Azure Security Center Pricing Tier
If your SQL server is hosted on Azure Arc machine and if you have auto-provisioning option enabled, Log Analytics agent will be automatically installed in your machine. If Otherwise, you can deploy the Log Analytics agent using the Security Center recommendation “Log Analytics agent should be installed on your Windows-based Azure Arc machines (Preview)”. Alternatively, you can install the agent manually in two easy steps by adding the Log Analytics VM extension. Refer to this article for step-by-step procedure to enable extension from portal/JSON/PowerShell.
A PowerShell script was used in this case to simulate a SQL injection attack scenario on the SQL server running on Azure Arc.
Injection flaws allow attackers to relay malicious code through an application to another system. These attacks include calls to the operating system via system calls, the use of external programs via shell commands, as well as calls to backend databases via SQL (i.e., SQL injection). Attackers can go around authentication and authorization of a web page or web application and retrieve the content of the entire SQL database. SQL injection is a particularly widespread and dangerous form of injection. The consequences are particularly damaging, as an attacker can obtain, corrupt, or destroy database contents. Security Center detects unusual and potentially harmful attempts to access SQL servers based on behavior analysis using machine learning.
In this scenario, Azure Security Center detected the threat and provided an alert with details of the machine, attacker activity, host information and more as shown in ‘Image 2 & Image 3’

Image 2: Security Alert, Alert details

Image 3: Security Alert, Take Action
NOTE: As of June 2020 release, Two new recommendations have been added to help deploy the Log Analytics Agent to your Azure Arc machines and ensure they’re protected by Azure Security Center:
- Log Analytics agent should be installed on your Windows-based Azure Arc machines (Preview)
- Log Analytics agent should be installed on your Linux-based Azure Arc machines (Preview)
These new recommendations will appear in the same four security controls as the existing (related) recommendation, Monitoring agent should be installed on your machines: remediate security configurations, apply adaptive application control, apply system updates, and enable endpoint protection. The recommendations also include the Quick fix capability to help speed up the deployment process.
In the next blog posts, we will discuss on how you can leverage Azure Security Center to protect your SQL IaaS VMs hosted On-premises. Stay Tuned!!
Special thanks to:
Yuri Diogenes, Senior PM, CxE Security – ASC Team for reviewing this post.
by Scott Muniz | Aug 11, 2020 | Azure, Microsoft, Technology, Uncategorized
This article is contributed. See the original author and article here.
With the recent release by HashiCorp and Microsoft of the Azure DevOps Provider 0.0.1 for Terraform we look at how to use these new features to create repeatable standardized projects into Azure DevOps.
Introduction.
In this article we are going to look at the new Terraform Provider for Azure DevOps. Firstly, lets provide some useful links:
At the time of authoring this article the provider is at version 0.0.1. Functionality is still a little limited and some of the documentation needs more detail, but all the basics are there.
So What Can I Do With This?
One question that has been asked many times is “Can I automate and template Azure DevOps Projects?”. Well, the answer is now yes.
The Terraform Azure DevOps Provider allows us to be able to create a standard Terraform deployment that creates a Project inside a DevOps Organization. We can use the resources to then describe what features we want enabled, disabled, or configured.
I have created a sample GitHub repo that holds the code examples we are going to look at below.
Ok, So Let’s Get Started.
Like many others, I tend to break my Terraform files up into smaller sub files to make things a little easier to navigate. In the GitHub Repo I have five .tf files:
- main.tf
- variables.tf (used to set my var. options cleanly)
- outputs.tf
- ado_repository.tf (we will cover this in more detail in the article)
- github_service_connection.tf (we will use this to setup a connection to the GitHub Repo)
I’m not going to cover what all of the files do in this article (there are some great blog posts out there already for that), but if you are interested in getting a detailed understanding of Terraform I recommend you check out our very own Adin Ermie.
Let’s start by taking a look at the main.tf file. The first area to note is that we need to define the org_service_url for Azure DevOps and personal_access_token we are going to use within the Provider Block.
The Organization Service URL is just the address to your DevOps org, for example https://dev.azure.com/myorg
Have a look at the following Microsoft document for detailed steps on how to setup a Personal Access Token in Azure DevOps.
main.tf
provider "azuredevops" {
  version = ">= 0.0.1"
  # Remember to specify the org service url and personal access token details below
  org_service_url = "xxxxxxxxxxxxxxxxxxxx"
  personal_access_token = "xxxxxxxxxxxxxxxxxxxx"
}

resource "azuredevops_project" "terraform_ado_project" {
  project_name       = var.project_name
  description        = var.description
  visibility         = var.visibility
  version_control    = var.version_control
  work_item_template = var.work_item_template
  # Enable or desiable the DevOps fetures below (enabled / disabled)
  features = {
      "boards" = "enabled"
      "repositories" = "enabled"
      "pipelines" = "enabled"
      "testplans" = "enabled"
      "artifacts" = "enabled"
  }
}
The rest of the arguments here are self-explanatory. we provide the basic options to setup the project and select to enable or disable the feature we require.
Next, we will look at the github_service_connection.tf. What we are doing here is defining a service connection into GitHub using GitHub Personal Access Tokens. Configuring GitHub PATs is documented here.
github_service_connection.tf
resource "azuredevops_serviceendpoint_github" "serviceendpoint_github" {
  project_id            = azuredevops_project.terraform_ado_project.id
  service_endpoint_name = "Sample GithHub Personal Access Token"

  auth_personal {
    # Also can be set with AZDO_GITHUB_SERVICE_CONNECTION_PAT environment variable
    personal_access_token = "xxxxxxxxxxxxxxxxxxxx"
  }
}
Finally, I am using an outputs.tf to return the newly created Project ID and Project URL.
outputs.tf
output "Project_ID" {
  value = azuredevops_project.terraform_ado_project.id
}

output "Project_URL" {
  value = azuredevops_project.terraform_ado_project.id
}
A Note About Repos.
Something that has been noted by a few people is that the Import option on the azuredevops_git_repository resource does not seem to work. Although documented as Import being a supported option (for public repos only at this time), it returns an error message.
Demo
Here is a quick demo of the code in action.
Wrap Up!
So thats it! A straightforward way to create Azure DevOps Projects within your Organization, simple and repeatable.


Recent Comments