by Scott Muniz | Jul 21, 2020 | Alerts, Microsoft, Technology, Uncategorized
This article is contributed. See the original author and article here.
Lifting and shifting your application to the cloud is extremely easy, on paper. The hard truth is that the only way to know for sure how it is going to perform is to test it. Benchmarking on-premises is hard enough, but benchmarking in the cloud can get really tricky due to changes in what’s exposed in PaaS environments. WorkloadTools is a set of open-source tools that can help you capture, analyze, and replay your workload, on-premises, and in the cloud. In this episode of Data Exposed: MVP Edition, Gianluca Sartori introduces the tool and its capabilities.
Watch on Data Exposed
Additional Resources:
WorkloadTools on GitHub:
Learn more about Microsoft Most Valuable Professionals (MVPs)
View/share our latest episodes on Channel 9 and YouTube!
by Scott Muniz | Jul 21, 2020 | Alerts, Microsoft, Technology, Uncategorized
This article is contributed. See the original author and article here.
We released System Center Operations Manager Management Pack for Azure SQL Managed Instance recently. It provides comprehensive monitoring capabilities for SQL Managed Instance. If you have a hybrid data environment, you can use a single monitoring solution, SCOM, to monitor all your data assets as we already have management packs for SQL Server and Azure SQL DB.
Discovery
After you install the management pack (MP), there are two templates to get you started: Manual and Automatic Discovery. As the names suggest, you can either discover your instances by adding them manually or automatically discover instances in a given subscription. Both options have wizards that walk you through this setup. We will not explore them in this post as the instructions in the MP guide are very detailed. I just want to point out that you can use either Azure Active Directory (AAD) or SQL Authentication to connect to the instances. You can use a connection with sysadmin rights or there is an option to use the least amount of privileges to monitor the product just like SQL Server MP. This is also explained in detail in the MP guide.
Monitoring
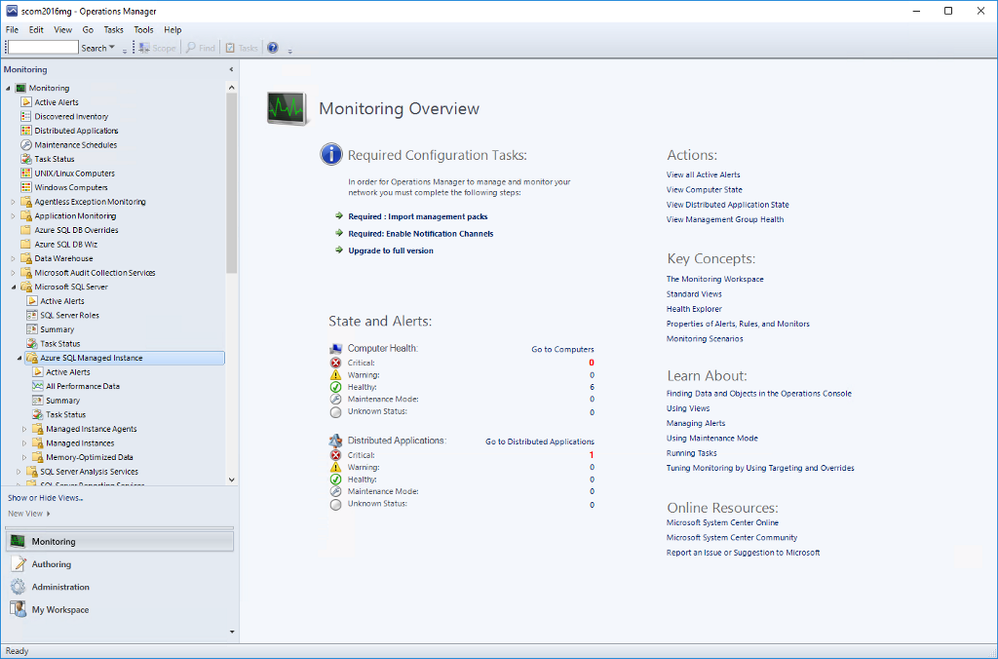
Once you complete all the steps in the wizard, you will be able to see the instances in the SCOM dashboard under Monitoring. Under Microsoft SQL Server folder, you’ll see a subfolder for Microsoft Azure SQL Managed Instance.

Navigate to Microsoft Azure SQL Managed Instance -> Managed Instances -> Database Engines
You can see the instances listed with some details. You can select which columns to display here by right-clicking and selecting Personalize View from the list. If you are using geo-replication, you will see that Geo-Replication Replica Role is listed in Detailed View. It can be Primary or Secondary (or blank if this instance is not participating in geo-replication).

As usual, you can drill down by double-clicking on the instance rows. This will take you to the list of individual monitors and their status. Most of these are the monitors you are familiar with from SQL Server MP.
There is a brand new monitor called Instance Free Storage Space Left. It uses percentages and is set to warn if it goes below 20% but, of course, it is customizable just like all the other monitors. It also shows the actual data in MB.

Navigate to Microsoft Azure SQL Managed Instance -> Managed Instances -> Databases
If you double-click on a geo-replicated database, you will see the new monitor, Geo-Replication Status, under Availability. All the information is on the right hand side. As you can see it can be in one of three states:
- CATCH_UP: This is the healthy state.
- SEEDING: Seeding is happening but until it competes, you can’t connect to the secondary database.
- PENDING: Not in an active continuous-copy relationship. Usually indicates bandwidth related issues.

Also on the Databases view, right-click on a geo-replicated database and select Open->Performance View. You will find the new counter Geo-Replication Lag (sec) along with other counters. This rule collects performance metric for the primary database only and shows the time difference between transactions committed on primary database and persisted on secondary database.
Other Views
You can also explore Managed Instance Agents and Memory-Optimized Data folders for monitors specific to those areas. We will not explore those in this post.
Summary Dashboard under Microsoft Azure SQL Managed Instance provides the usual status-at-a-glance view of everything. Just like other SQL MPs, you can drill down to get to specific monitors/rules and customize it by adding or removing tiles to fit your needs.

Active Alerts view under Microsoft Azure SQL Managed Instance lets you view all your active alerts in a single place just like other SQL MPs.

Summary
Azure SQL Managed Instance Management Pack is very similar to other SQL MPs but also introduces product specific monitors and rules.
by Scott Muniz | Jul 21, 2020 | Alerts, Microsoft, Technology, Uncategorized
This article is contributed. See the original author and article here.
Azure Activity logs provides insight into any subscription-level or management group level events that have occurred in Azure, there are three main categories covered under Azure Activity and a bunch of resource types, for more details click here:
- Azure Resources
- Audit
- Security
Each event in the Activity Log has a particular category . See the sections below for more detail on each category and its schema when you access the Activity log from the portal, PowerShell, CLI, and REST API. The schema is different when you stream the Activity log to storage or Event Hubs:
| Category |
Description |
| Administrative |
Contains the record of all create, update, delete, and action operations performed through Resource Manager. Examples of Administrative events include create virtual machine and delete network security group.
Every action taken by a user or application using Resource Manager is modeled as an operation on a particular resource type. If the operation type is Write, Delete, or Action, the records of both the start and success or fail of that operation are recorded in the Administrative category. Administrative events also include any changes to role-based access control in a subscription. |
| Service Health |
Contains the record of any service health incidents that have occurred in Azure. An example of a Service Health event SQL Azure in East US is experiencing downtime.
Service Health events come in Six varieties: Action Required, Assisted Recovery, Incident, Maintenance, Information, or Security. These events are only created if you have a resource in the subscription that would be impacted by the event. |
| Resource Health |
Contains the record of any resource health events that have occurred to your Azure resources. An example of a Resource Health event is Virtual Machine health status changed to unavailable.
Resource Health events can represent one of four health statuses: Available, Unavailable, Degraded, and Unknown. Additionally, Resource Health events can be categorized as being Platform Initiated or User Initiated. |
| Alert |
Contains the record of activations for Azure alerts. An example of an Alert event is CPU % on myVM has been over 80 for the past 5 minutes. |
| Autoscale |
Contains the record of any events related to the operation of the autoscale engine based on any autoscale settings you have defined in your subscription. An example of an Autoscale event is Autoscale scale up action failed. |
| Recommendation |
Contains recommendation events from Azure Advisor. |
| Security |
Contains the record of any alerts generated by Azure Security Center. An example of a Security event is Suspicious double extension file executed. |
| Policy |
Contains records of all effect action operations performed by Azure Policy. Examples of Policy events include Audit and Deny. Every action taken by Policy is modeled as an operation on a resource. |
Our hunting library for today will shed more lights on “Administrative” category which contains the record of all create, update, delete, and action operations performed through Resource Manager, this means an auditing & reporting activities have to be in place and hence there are a set of operations (Operation Name) which defines a resource types.
Hunting such kind of activities (aka: Demons) require defining the category, operation name “value” & activity value. Before sharing couple of hunting use-cases let’s have a look at a set of administrative operations as a sample:
| Operation name |
Resource type |
| Create or update workbook |
Microsoft.Insights/workbooks |
| Delete Workbook |
Microsoft.Insights/workbooks |
| Set Workflow – Playbook |
Microsoft.Logic/workflows |
| Delete Workflow – Playbook |
Microsoft.Logic/workflows |
| Create Saved Search |
Microsoft.OperationalInsights/workspaces/savedSearches |
| Delete Saved Search |
Microsoft.OperationalInsights/workspaces/savedSearches |
| Update Alert – Analytics Rules |
Microsoft.SecurityInsights/alertRules |
| Delete Alert – Analytics Rules |
Microsoft.SecurityInsights/alertRules |
| Update Alert Rule Response Actions |
Microsoft.SecurityInsights/alertRules/actions |
| Delete Alert Rule Response Actions |
Microsoft.SecurityInsights/alertRules/actions |
| Update Bookmarks |
Microsoft.SecurityInsights/bookmarks |
| Delete Bookmarks |
Microsoft.SecurityInsights/bookmarks |
| Update Cases |
Microsoft.SecurityInsights/Cases |
| Update Case Investigation |
Microsoft.SecurityInsights/Cases/investigations |
| Create Case Comments |
Microsoft.SecurityInsights/Cases/comments |
| Update Data Connectors |
Microsoft.SecurityInsights/dataConnectors |
| Delete Data Connectors |
Microsoft.SecurityInsights/dataConnectors |
| Update Settings |
Microsoft.SecurityInsights/settings |
| Update / Delete NSG |
Microsoft.Network/networkSecurityGroups |
| Create / Update / Delete Pubic IP Addresses |
Microsoft.Network/publicIPAddresses |
| Create / Update / Delete Network Interfaces |
Microsoft.Network/networkInterfaces |
| Route tables actions |
Microsoft.Network/routeTables |
| Create / Update / Delete Front door web app firewall policies |
Microsoft.Network/frontdoorwebapplicationfirewallpolicies |
| DDOS Protection Plans Actions |
Microsoft.Network/ddosProtectionPlans |
| Create / Update / Delete Virtual Networks |
Microsoft.Network/virtualNetworks |
| Create / Update / Delete Front doors |
Microsoft.Network/frontdoors |
| Create / Update / Delete Subnets |
Microsoft.Network/virtualNetworks/subnets |
| Create / Update / Delete Application Gateways |
Microsoft.Network/applicationGateways |
| Create / Update / Delete Update Virtual Network Peerings |
Microsoft.Network/virtualNetworks/virtualNetworkPeerings |
| Firewall Policies Rule Groups Actions |
Microsoft.Network/firewallPolicies/ruleGroups |
| Create / Update / Delete Azure Firewalls |
Microsoft.Network/azureFirewalls |
| Create / Update / Delete Firewall Policies |
Microsoft.Network/firewallPolicies |
| DNS Resources Actions |
Microsoft.Network/getDnsResourceReference |
Use- Cases:
#1 Creating a new Azure Sentinel Analytics – Rule:
AzureActivity
| where Category == "Administrative"
| where OperationNameValue == "Microsoft.SecurityInsights/alertRules/write"
| where ActivitySubstatusValue == "Created"
#2 Deleting an existing Azure Sentinel Analytics – Rule:
AzureActivity
| where Category == "Administrative"
| where OperationNameValue == "Microsoft.SecurityInsights/alertRules/delete"
| where ActivitySubstatusValue == "OK"
#3 Creating a new NSG:
// NSG : 201 Created status means "Created"
AzureActivity
| where Category == "Administrative"
| where OperationNameValue == "Microsoft.Network/networkSecurityGroups/write"
| where ActivitySubstatusValue == "Created"
#4 Updating an Existing NSG:
// NSG : 200 Ok status means "Updated"
AzureActivity
| where Category == "Administrative"
| where OperationNameValue == "Microsoft.Network/networkSecurityGroups/write"
| where ActivitySubstatusValue == "OK"
#5 Creating Virtual Network Subnets:
// Virtual Networks Subnets Creation
AzureActivity
| where Category == "Administrative"
| where OperationNameValue == "Microsoft.Network/virtualNetworks/subnets/write"
| where ActivitySubstatusValue == "Created"
And much more use-cases and hunting queries can be configured, we make it easy so check out the Azure Sentinel Administrative Suspicious Activities Library uploaded to gihub :
AnalyticsRulesAdministrativeOperations
AzureNSG_AdministrativeOperations
AzureSentinelWorkbooks_AdministrativeOperation
AzureVirtualNetworkSubnets_AdministrativeOperationset
Enjoy hunting the demons! and please share your feedback.
by Scott Muniz | Jul 20, 2020 | Alerts, Microsoft, Technology, Uncategorized
This article is contributed. See the original author and article here.
Recently I came across a scenario where someone had changed the time on a scheduled Azure virtual machine shut down, but the VM was not adhering to the shut down new time.. Learn how asking the wrong question can cause you to miss the answer!
Background – the change
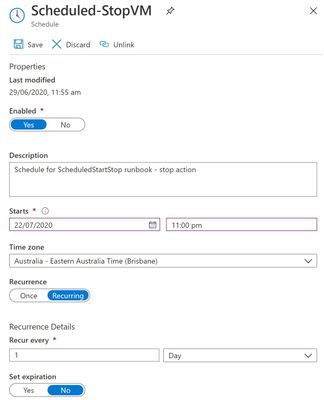
The systems administrator had an Azure Automation Runbook in place that told the Azure Windows Server virtual machine to shut down at 10pm each night. After changing the script to 11pm, the admin noticed that the server was still shutting down at 10pm.

So they started to investigate the wrong question …
“Why isn’t the VM acknowledging the changed time in the updated schedule?”
The importance of broader questions
With this question, we’re assuming part of the cause – that the VM is controlled by the Azure Automation Runbook but somehow doesn’t realize there has been an updated change to the schedule. We could wrack our brains & comb through logs for days, without answering this question. Why? Because it’s the wrong question to ask.
A better question
Instead, let’s rephrase the problem a little broader.
“WHY is the VM shutting down at 10pm?”
Notice I didn’t say “why is the VM still shutting down at 10pm”. I want to set aside for a moment any past behavior versus expected new behavior and instead go exploring some of the reasons why a virtual machine would shut down.
Shut down causes/triggers
Let’s brainstorm a few “usual suspects” that might shut down a VM:
1. Azure Automation – yes, that’s what we were first looking at. Has it saved correctly? Are there any other runbooks executing first?
2. Windows Update – settings on the server itself, Azure Update Management, or even a third party management tool (though in none of those scenarios would I expect it to happen every day, but I have seen stranger things!).
3. Azure Dev/Test Labs – These pre-configured Azure Resource Manager templates let you specify auto shutdown (and auto start) times and policies for your Azure VMs.
4. Something else controlling that server – think of a local script, application or third party management tool. Could the cause of the shut down be inside the VM itself and not related to Azure?
See if you can identify something I’ve left off this list, on purpose!
Analyzing the shut down event
Now I have a few ideas outside the scope of just that one script, it’s time to go and look at the facts.
Starting with the Windows Server event log, it tells me that a shut down event was initiated at 2200hrs. Yeah, no kidding. But it’s not very good at tell me what initiated it. This gives me a clue that it may be a factor outside of the server OS.
Next, I’ll check the VM’s Activity log in the Azure portal. This logs subscription-level events, including those triggered by Azure Policy. Now we can see that “Azure Lab Services” initiates our shut down events at 10:00pm daily – as well as our . That is not our Azure Automation Runbook.

This server is not part of an Azure Dev/Test Lab though, so what have we missed?
Auto-shutdown support for Azure VMs
One place we didn’t look was the Operations section of the Azure VM, in the Azure Portal. Nestled in with Azure Bastion connection, Backup, Policies etc. (relevant to this machine), is the Auto-shutdown section!
And here we’ve found the cause of our shutdowns.

The properties of the Virtual Machine had been configured to shut down the VM daily at 10pm.
Summary
If you’ve ever scratched your head over a problem, only to have someone else quickly find the cause … welcome to the human race! Sometimes our troubleshooting questions lead us in a defined direction, missing the clues that we actually need. So the next time you’re faced with a problem, step back and look at what questions you are asking to try and solve it, and what assumptions they may contain.
Learn more with our Introduction to Azure Virtual Machines, on Microsoft Learn.
by Scott Muniz | Jul 20, 2020 | Alerts, Microsoft, Technology, Uncategorized
This article is contributed. See the original author and article here.
ProxySQL have rich internal functioning metrics which could be accessed from its stats database through the Admin interface, and the stored metrics are the snapshot of a particular point of time when you select the metric table. When troubleshooting the problem, we need to review and accumulate the historical metrics data with powerful query functions like Azure Monitor Kusto Queries to help understand the overall status. In this blog, we will introduce how to post the metrics to Azure Monitor Log Analytics Workspace and leverage the powerful Kusto query language to monitor the ProxySQL statistics metrics.
Access the ProxySQL Metrics for Monitoring:
1. Connect the ProxySQL Admin interface through any client using MySQL protocol with the admin credential like below:
mysql -u admin -padmin -h 127.0.0.1 -P6032
2. Access the statistics metrics by select query like below example:
select Client_Connections_aborted from stats.stats_mysql_global
3. Please refer the metrics detail in https://proxysql.com/documentation/stats-statistics/, there are 18 stats tables storing important monitoring data viz the front end and backend connections, query digest, GTID, prepared statements and etc.
Note: ProxySQL is an open source community tool. It is supported by Microsoft on a best effort basis. In order to get production support with authoritative guidance, you can evaluate and reach out to ProxySQL Product support.
Ingest the Metrics to external monitoring tool – Azure Monitor:
1. Assume you have installed ProxySQL on a Linux VM already, as the Admin interface is only allowed to access locally, we need to run the ingestion code side by side on the same VM. The ingestion sample code will query the ProxySQL stats metrics then post the data to the Logical Workspace in a regular 1-minute interval.
2. Provision a Log Analytics Workspace to store the posted metrics. The Ingestion sample code performs POST Azure Monitor custom log through HTTP REST API: https://docs.microsoft.com/en-us/azure/azure-monitor/platform/data-collector-api
3. The ingestion sample code is developed with .NET Core 3.1, and you could check out from the GitHub repo https://github.com/Azure/azure-mysql/tree/master/ProxySQLMetricsIngest.
Detail usage instructions about the sample ingesting code:
1. Install .NET Core on the Linux VM where ProxySQL is located.
Refer to https://docs.microsoft.com/dotnet/core/install/linux-package-manager-ubuntu-1804
wget -q https://packages.microsoft.com/config/ubuntu/18.04/packages-microsoft-prod.deb -O packages-microsoft-prod.deb
sudo dpkg -i packages-microsoft-prod.deb
sudo add-apt-repository universe
sudo apt-get update
sudo apt-get install apt-transport-https
sudo apt-get update
sudo apt-get install dotnet-sdk-3.1
2. Get the Custom ID and Shared Key of the Log Analytics Workspace
1) In the Azure portal, locate your Log Analytics workspace.
2) Select Advanced Settings and then Connected Sources.
3) To the right of Workspace ID, select the copy icon, and then paste the ID as the value of the Customer ID input for the sample application input.
4) To the right of Primary Key, select the copy icon, and then paste the ID as the value of the Shared Key input for the sample application input.
3. Checkout the sample code and run:
git clone https://github.com/Azure/azure-mysql
cd ProxySQLMetricsIngest/
dotnet build
sudo dotnet run
Here are some details about the sample:
1) It is a console application which will ask for the input of the connection string for ProxySQL Admin Interface, (Log Workspace) custom ID and Shared key.
2) The sample currently register a 1-minute timer to periodically access the ProxySQL stats tables through MySQL protocol and post data into the Log Analytics Workspace
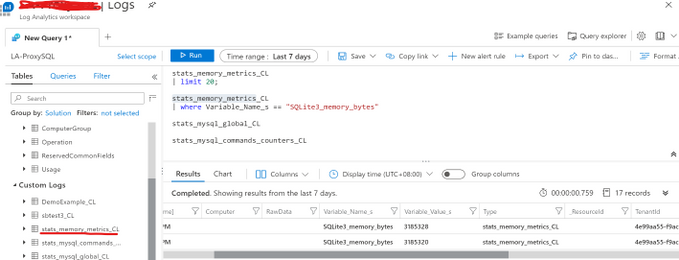
3) Each ProxySQL stats table name would be used as the Custom Log Type Name, and the Log Analytics will automatically add _CL suffix to generate the complete Custom Log Type Name. For example, the stats table stats_memory_metrics will become stats_memroy_metrics_CL in the Custom Logs list. Below is the example screenshot within the Log Analytics Workspace.

4) The sample code also post the error logs in /var/lib/proxysql/proxysql.log to the Log Analytics Workspace as Custom Log Type: PSLogs_CL, to get the file read permission, please execute “sudo dotnet run”.
4. Use Kusto query in Log Analytics Workspace to operate the ProxySQL metrics data.
Please be noticed that all the ProxySQL stats table values are set to string, so need convert it to number in Kusto query. Below is the example to render a time chart of the memory usage about ProxySQL internal module SQLLite.

Disclaimer: This sample code is available AS IS with no warranties and support from Microsoft. Please raise an issue in Github if you encounter any issues and I will try our best to address it.
If you have trouble setting up ProxySQL on Azure Database for MySQL, please contact the Azure Database for MySQL team at AskAzureDBforMySQL@service.microsoft.com

Recent Comments