
by Contributed | Jan 11, 2024 | Business, Microsoft 365, Technology, Walkie Talkie
This article is contributed. See the original author and article here.
In the race to deliver engaging in-store experiences, Microsoft is uniquely positioned to equip retailers with the tech they need to transform their store team’s workdays. At the National Retail Federation (NRF) 2024, we are announcing new solutions designed to enable store teams to efficiently meet customers’ expectations and improve the retail experience in this new era of AI.
The post Level up your retail workforce with smart, simple solutions from Microsoft Teams appeared first on Microsoft 365 Blog.
Brought to you by Dr. Ware, Microsoft Office 365 Silver Partner, Charleston SC.
by Contributed | Jan 10, 2024 | Technology
This article is contributed. See the original author and article here.
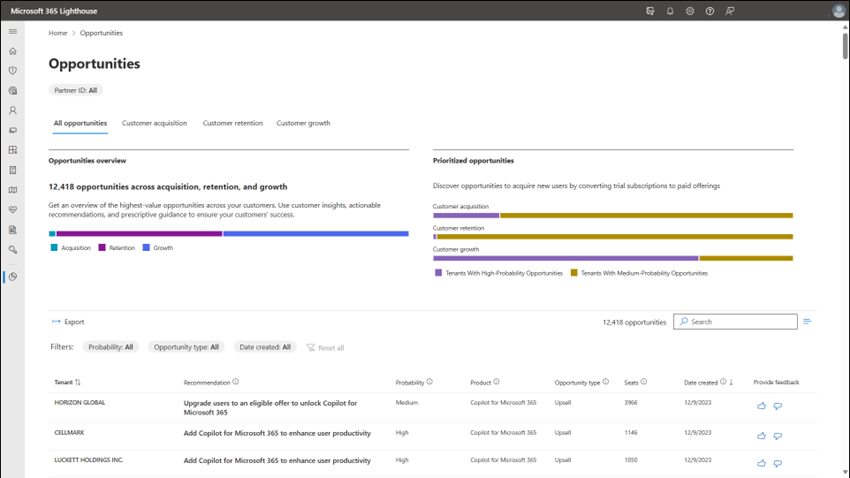
One of the common adoption blockers we have heard of from our partners is that they cannot standardize their security and management practices on Microsoft 365 Lighthouse because they cannot manage all their customers using it. This has made it challenging to standardize procedures such as resetting passwords, identifying risky users, or simply navigating a customer admin portal with delegated access. While we made it simple to search and discover users across the SMB customers you were managing in Microsoft 365 Lighthouse, you still needed a second process for the customers you were not managing in Microsoft 365 Lighthouse. This was primarily due to the requirement for Microsoft 365 Business Premium. While we have expanded support for a limited set of subscriptions to manage a customer in Lighthouse over the past couple of years, it was still limited to subscriptions that offered premium security value, preventing you from having a single solution.
Today, we expand support for all your commercial and educational SMB customers. This enables you as a partner to create standardized processes for managing all your SMB customers in Lighthouse. Here are a few of the scenarios you can do now with all your Microsoft 365 SMB customers using Lighthouse:
 Screenshot of Microsoft 365 Lighthouse showing how to search for a user and view the user’s details.
- Gain visibility into any Microsoft 365 incidents or advisories affecting your customers with a multi-tenant Service health dashboard.
 Screenshot of Microsoft 365 Lighthouse Service Health page.
One of the challenges of managing multiple customers is that you often need to use different admin portals, such as the Microsoft 365 admin center, the Azure portal, Microsoft Intune, or Exchange, to name a few. Lighthouse lets you quickly and securely access other Microsoft admin portals for each of your SMB customers in the context of your partner tenant credentials using GDAP. Lighthouse users can leverage our security and management scenarios and seamlessly jump to another Microsoft admin portal when necessary.
Learn more: Manage your customers with Microsoft 365 Lighthouse
 Screenshot of Microsoft 365 Lighthouse showing how to navigate into a customer’s Microsoft Entra admin portal.
We are just getting started and will continue to expand on the capabilities we offer to manage the breadth of customers you have in the coming months. So, check back often to learn what is new with Lighthouse.
Not able to manage a customer in Lighthouse?
Here are cases where you will still find that a customer has limited management capabilities in Lighthouse and how you can change it.
- By far, the most common cause a customer is “Limited” in that the customer tenant no longer has any active subscriptions and is no longer in use. If this is the case, the recommendation is to remove the reseller relationship (and GDAP relationships (Partner-led termination of a granular admin relationship – Partner Center | Microsoft Learn). It is a best practice to remove relationships that are no longer needed to reduce unnecessary exposure to your organization.
- The second most common cause a customer is “Limited” is that delegated permissions (GDAP) have not been setup. You can use the GDAP setup wizard within Lighthouse to resolve this (Set up GDAP for your customers in Microsoft 365 Lighthouse – Microsoft 365 Lighthouse | Microsoft Learn).
- customer tenant is in the Government Cloud. Unfortunately, we cannot support the management of this customer in Microsoft 365 Lighthouse.
- The customer is not an SMB and has more than 2,500 licensed users.
- You are not in the same geographic area as the customer. If you have customers in a different geographic area, you can set up Lighthouse in that region to manage them.
- Lastly, some cases exist where tenants are used for Azure and not Microsoft 365. In that case, we recommend you check out Azure Lighthouse: What is Azure Lighthouse? – Azure Lighthouse | Microsoft Learn
To know why a specific customer is limited, click on Tenants link from the left navigation within Lighthouse and click the “Limited” link to bring up details on why they are not fully managed in Lighthouse:
 Tenant list showing Contoso as “Limited” because delegated access has not been configured.
If you have a customer tenant using the Microsoft 365 services and you only have Limited management capabilities within Lighthouse, we want to know. You can leave comments below or use the feedback mechanism in Lighthouse. We want to enable you to manage all your active Microsoft 365 SMB customer tenants in Lighthouse.
If you already have Lighthouse, sign in and check out the links to other Microsoft admin centers at lighthouse.microsoft.com. If you don’t have Lighthouse, Sign up for Microsoft 365 Lighthouse to get started today.
by Contributed | Jan 9, 2024 | Technology
This article is contributed. See the original author and article here.
The start of a new year is often seen as a time to reflect on the past, plan for the future, and set New Year’s resolutions for ourselves. It is also a key time for business leaders to set goals to help their organizations and teams accomplish more in the new year, whether those goals are a new product release, business growth, or workplace culture improvement.
Furthermore, we know that simply writing down your goals is often not enough to achieve them! You also need to communicate your goals with key stakeholders, track your progress, and measure your results. This can be challenging, especially if your organization has multiple goals, competing priorities, or cross-team dependencies.
This is where Viva Goals and Microsoft Copilot can help.
Viva Goals is Microsoft’s solution for creating, managing, and tracking organizational goals. It is founded on the Objective and Key Result (OKR) framework, yet can be customized to meet other goal-setting strategies. To learn more about changing your goal terms from “Objectives and Key Results” to other frameworks or labels, visit our page on customizing terminology in Viva Goals.
With the content generation and summarization capabilities in Copilot in Viva Goals, creating and tracking your goals is becoming even easier.
Quickly create your goals with Copilot in Viva Goals
One challenge we frequently hear from customers is uncertainty about getting started with writing actionable, outcome-driven goals. Setting appropriate and ambitious goals can be daunting, but using Copilot can make the process easier.
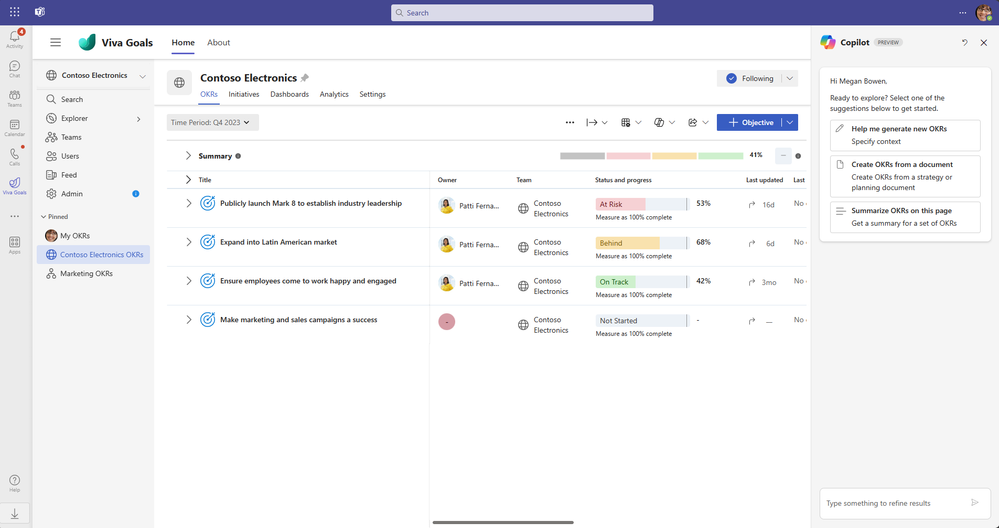
From a quick click of the “Copilot” button in the Viva Goals app (available on Microsoft Teams or in your browser), Copilot is ready to help you generate new goals or OKRs:
Copilot in Viva Goals can be accessed from the tool bar or the Copilot icon within Viva Goals.
Copilot in Viva Goals can help you generate goals in two different ways:
Generating new goals based on context you provide (ex: industry, roles, business mission)
Clicking “Help me generate new OKRs” means Copilot will help you in crafting OKRs, using the conversational interface and its repository of sample OKRs.
Copilot in Viva Goals will generate goals based on prompts or information you provide in the chat.
By asking Copilot to “Write an OKR for this year’s plans to roll out Microsoft Copilot to employees across my organization,” you may get a result like:
Objective: Roll out Microsoft Copilot to employees across the organization
Key Result (KR): Train 60% of our employees on the basics of taking the “Copilot for Microsoft 365” training in Viva Learning
KR: Set up all required infrastructure and hardware to support Microsoft Copilot for these employees
KR: Ensure 60% all newly hired employees have used Microsoft Copilot in their first month of onboarding
Note that this content is AI-generated and will change based on inputs / sample data.
Using the Copilot interface, you can ask Copilot to regenerate these OKRs, refine them (“be more conservative,” “increase the adoption rate,” etc.), or publish them to your Viva Goals instance.
Generating goals from a document you provide (ex: business plan, strategy paper)
Oftentimes, business leaders will already have strategy or business planning documents they have been circulating with their leadership teams. This can be a great place to get started: by uploading these strategy documents to Viva Goals , Copilot can then identify potential goals from the document and format into actionable OKRs. This capability is currently available for local .docx files, and will be expanding file types and file sources in the coming months.
Copilot in Viva Goals can use content from your existing documents to suggest outcome-based goals.
One thing to remember: using Copilot means that you, as the user, are always in control of what gets saved, published, and shared.
Copilot in Microsoft 365 can also be helpful in writing goals
For users that are not currently using Viva Goals, or are looking for suggestions on annual goals elsewhere, Copilot in M365 can be a great place to get started. Copilot in Word or in the Microsoft Copilot web experience can be great resources for creating the right goals for you and your organization. You can use prompts like “Write 3 OKRs for building a new (product/service) in the new year” or “Provide some goal suggestions for boosting employee morale” and work with Microsoft Copilot to refine these goals.
Furthermore, at Ignite last November (2023), we also announced that Microsoft 365 Copilot will be enhanced with Viva in early 2024. This means users will have access to Viva functionality within the Copilot for Microsoft 365 experience, including a chat experience that works across Viva data and apps to support employees, managers, and leaders. To learn more, check out the announcement from our blog in November, New ways Microsoft Copilot and Viva are transforming the employee experience.
Just make sure that after creating your goals, you are communicating these goals to your stakeholders and tracking your progress!
Summarizing your goals with Copilot
With Copilot, it is even easier to summarize and share your goal progress. Copilot uses context from your goal status updates and check-ins to generate summaries of your progress, making it even easier to share your current status with other teams and leadership.
Copilot in Viva Goals will quickly summarize your goals for easy sharing.
You can work with Copilot to tailor the update messages to your audience by asking the conversational AI to make the summary content more succinct, detailed, or professional. Looking to quickly share these updates with your teams, audiences or stakeholders? Use functionality within Viva Goals to broadcast your updates to email via Outlook or to post on Viva Engage with just a few clicks.
With the Viva Goals integration into Viva Engage, it’s easier than ever to share your team goals with your community.
It has never been easier to get started with setting and tracking your goals with Microsoft and Viva Goals, especially with the power of AI. Always make sure to review Copilot’s responses to make sure the suggestions and content it presents are relevant to your organization and your goals.
Set your 2024 Goals with Copilot today
Copilot in Viva Goals is available to Viva suite customers in public preview since December 2023 and will be Generally Available in early 2024. NOTE: Customers with Viva suite licenses interested in using Copilot in Viva Goals should work with their IT Admins to enable public preview of Copilot for users from their Microsoft Admin Center. To learn more about enabling Copilot in Viva Goals, please visit our Copilot in Viva Goals documentation.
Microsoft will also be hosting a webinar session on January 31st, 8am US-PT, for those interested in a live demo and to hear how Copilot in Viva Goals is helping address goal-setting and tracking challenges. More details available at Microsoft Virtual Event “Discovering the Power of Copilot in Viva Goals”.
Have feedback about Copilot in Viva Goals? Use the feedback tool in Viva Goals to let us know your thoughts.
From the Microsoft Viva Goals team to yours, we wish you success in achieving your goals in the new year!
by Contributed | Jan 8, 2024 | Technology
This article is contributed. See the original author and article here.
One of the best practices for securing your organization’s data is to follow the principle of least privilege, which means granting users the minimum level of permissions they need to perform their tasks. Microsoft Entra ID helps you apply this principle by offering a wide range of built-in roles as well as allowing you to create custom roles and assign them to users or groups based on their responsibilities and access needs. You can also use Entra ID to review and revoke any role assignments that are no longer needed or appropriate.
It can be easy to lose track of role assignments if admin activities are not carefully audited and monitored. Routine checks of role assignments and generating alerts on new role assignments are one way to track and manage privileged role assignment.
Chances are that when a user with privileged roles is approached, they’ll say they need the role. This may be true; however, many times users will unknowingly say they need those permissions to carry out certain tasks when they could be assigned a role with lower permissions. For example, a user will be able to reset user passwords as a Global Administrator, but that does not mean they can’t do that with another role with far less permissions.
Defining privileged permissions
Privileged permissions in Entra ID can be defined as “permissions that can be used to delegate management of directory resources to other users, modify credentials, authentication or authorization policies, or access restricted data.” Entra ID roles each have a list of permissions defined to them. When an identity is granted the role, the identity also inherits the permissions defined in the role.
It’s important to check the permissions of these roles. The permissions defined in all built-in roles can be found here. For example, there are a few permissions that are different for the Privileged Authentication Administrator role than the Authentication Administrator role, giving the former more permissions in Entra ID. The differences between the authentication roles can be viewed here.
Another example of having differences between similar roles is for the end user administration roles. The differences and nuances between these roles are outlined in detail here.
Auditing activity
To decide if a user really needs a role, it’s crucial to monitor their activities and find the role with the least privilege that allows them to carry out their work. You’ll need Entra ID audit logs for this. Entra ID audit logs can either be sent to a Log Analytics Workspace or connected to a Sentinel instance.
There are two methods that can be used to get the events of carried out by admin accounts. The first will make use of the IdentityInfo table, which is only available in Sentinel after enabling User and Entity Behavior Analytics (UEBA). If you aren’t using UEBA in Sentinel or if you’re querying a Log Analytics Workspace, then you’ll need to use the second method in the next heading.
Using Microsoft Sentinel
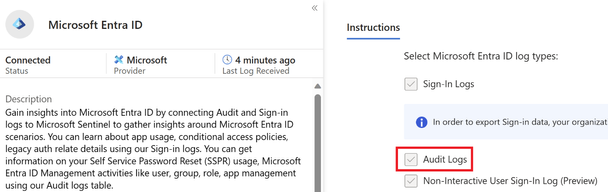
To ingest Entra ID audit logs into Microsoft Sentinel, the Microsoft Entra ID data connector must be enabled, and the Audit Logs must be ticked as seen below.
Figure 1 Entra ID data connector in Sentinel with Audit logs enabled
The IdentityInfo table stores user information gathered by UEBA. Therefore, it also includes the Entra ID roles a user has been assigned. This makes it very simple to get a list of accounts that have been assigned privileged roles.
The query below will give a unique list of activities an account has taken, as well as which roles the account has been assigned:
AuditLogs
| where TimeGenerated > ago(90d)
| extend ActorName = iif(
                         isnotempty(tostring(InitiatedBy["user"])),
                         tostring(InitiatedBy["user"]["userPrincipalName"]),
                         tostring(InitiatedBy["app"]["displayName"])
                     )
| extend ActorID = iif(
                       isnotempty(tostring(InitiatedBy["user"])),
                       tostring(InitiatedBy["user"]["id"]),
                       tostring(InitiatedBy["app"]["id"])
                   )
| where isnotempty(ActorName)
| join (IdentityInfo
    | where TimeGenerated > ago(7d)
    | where strlen(tostring(AssignedRoles)) > 2
    | summarize arg_max(TimeGenerated, *) by AccountUPN
    | project AccountObjectId, AssignedRoles)
    on $left.ActorID == $right.AccountObjectId
| summarize Operations = make_set(OperationName) by ActorName, ActorID, Identity, tostring(AssignedRoles)
| extend OperationsCount = array_length(Operations)
| project ActorName, AssignedRoles, Operations, OperationsCount, ActorID, Identity
| sort by OperationsCount desc
This will give results for all accounts that carried out tasks in Entra ID and may generate too many operations that were not privileged. To filter for specific Entra ID roles, the following query can be run where the roles are defined in a list. Three roles have been added as examples, but this list can and should be expanded to include more roles:
let PrivilegedRoles = dynamic(["Global Administrator",
                               "Security Administrator",
                               "Compliance Administrator"
                              ]);
AuditLogs
| where TimeGenerated > ago(90d)
| extend ActorName = iif(
                         isnotempty(tostring(InitiatedBy["user"])),
                         tostring(InitiatedBy["user"]["userPrincipalName"]),
                         tostring(InitiatedBy["app"]["displayName"])
                     )
| extend ActorID = iif(
                       isnotempty(tostring(InitiatedBy["user"])),
                       tostring(InitiatedBy["user"]["id"]),
                       tostring(InitiatedBy["app"]["id"])
                   )
| where isnotempty(ActorName)
| join (IdentityInfo
    | where TimeGenerated > ago(7d)
    | where strlen(tostring(AssignedRoles)) > 2
    | summarize arg_max(TimeGenerated, *) by AccountUPN
    | project AccountObjectId, AssignedRoles)
    on $left.ActorID == $right.AccountObjectId
| where AssignedRoles has_any (PrivilegedRoles)
| summarize Operations = make_set(OperationName) by ActorName, ActorID, Identity, tostring(AssignedRoles)
| extend OperationsCount = array_length(Operations)
| project ActorName, AssignedRoles, Operations, OperationsCount, ActorID, Identity
| sort by OperationsCount desc
Once the query is run, the results will give insights into the activities performed in your Entra ID tenant and what roles those accounts have. In the example below, the top two results don’t pose any problems. However, the third row contains a user that has the Global Administrator role and has created a service principal. The permissions needed to create a service principal can be found in roles less privileged than the Global Administrator role. Therefore, this user can be given a less privileged role. To find out which role can be granted, check this list, which contains the least privileged role required to carry out specific tasks in Entra ID.

Figure 2 Actions taken by users in Entra ID
Using Log Analytics Workspace

Figure 3 Configuring the forwarding of Entra ID Audit logs to a Log Analytics Workspace
To ingest Entra ID audit logs into a Log Analytics Workspace follow these steps.
Because there is no table that contains the roles an identity has been granted, you’ll need to add the list of users to the query and filter them. There are multiple ways to get a list of users who have been assigned a specific Entra ID role. A quick way to do this is to go to Entra ID and then select Roles and administrators. From there, select the role and export the identities that have been assigned to it. It’s important to have the User Principal Names (UPNs) of the privileged users. You’ll need to add these UPNs, along with the roles the user has, to the query. Some examples have been given in the query itself. If the user has more than one role, then all roles must be added to the query.
datatable(UserPrincipalName:string, Roles:dynamic) [
    "admin@contoso.com", dynamic(["Global Administrator"]),
    "admin2@contoso.com", dynamic(["Global Administrator", "Security Administrator"]),
    "admin3@contoso.com", dynamic(["Compliance Administrator"])
]
| join (AuditLogs
        | where TimeGenerated > ago(90d)
        | extend ActorName = iif(
                                isnotempty(tostring(InitiatedBy["user"])),
                                tostring(InitiatedBy["user"]["userPrincipalName"]),
                                tostring(InitiatedBy["app"]["displayName"])
                            )
        | extend ActorID = iif(
                            isnotempty(tostring(InitiatedBy["user"])),
                            tostring(InitiatedBy["user"]["id"]),
                            tostring(InitiatedBy["app"]["id"])
                        )
        | where isnotempty(ActorName) ) on $left.UserPrincipalName == $right.ActorName
| summarize Operations = make_set(OperationName) by ActorName, ActorID, tostring(Roles)
| extend OperationsCount = array_length(Operations)
| project ActorName, Operations, OperationsCount, Roles, ActorID
| sort by OperationsCount desc
Once you run the query, the results will give insights into the activities performed in your Entra ID tenant by the users you have filtered for. In the example below, the top two results can cause problems. Both have the Global Administrator role, but their operations don’t necessitate to have that role. The permissions needed for these operations can be found in roles less privileged than the Global Administrator role. Therefore, these users can be given a less privileged role. To find out which role can be granted, check this list, which contains the least privileged role required to carry out specific tasks in Entra ID.

Figure 4 Actions taken by users in Entra ID
If this user still requires the Global Administrator role then the Security Administrator role will become redundant as the Global Administrator contains more permissions than the Security Administrator role.
Conclusion
Keeping accounts with privileges that are not required is keeping your attack surface greater than it needs to be. By ingesting Entra ID Audit logs, you can query and identify users who have unnecessary and over-privileged roles. You can then find a suitable alternative role for them.
Timur Engin
LinkedIn Twitter
Learn more about Microsoft Entra:
by Contributed | Jan 7, 2024 | Technology
This article is contributed. See the original author and article here.
Overview
Azure Video Indexer (AVI) offers a comprehensive suite of models that extract diverse insights from the audio, transcript, and visuals of videos. Recognizing the boundless potential of AI models and the unique requirements of different domains, AVI now enables integration of custom models. This enhances video analysis, providing a seamless experience both in the user interface and through API integrations.
The Bring Your Own (BYO) capability the process of integrating custom models. Users can provide AVI with the API for calling their model, define the input via an Azure Function, and specify the integration type. Detailed instructions are available here.
Demonstrating this functionality, a specific example involves the automotive industry: Users with numerous car videos can now detect various car types more effectively. Utilizing AVI’s Object Detection insight, particularly the Car class, the system has been expanded to recognize new sub-classes: Jeep and Family Car. This enhancement employs a model developed in Azure AI Vision Studio using Florence, based on a few-shots learning technique. This method, leveraging the foundational Florence Vision model, enables training for new classes with a minimal set of examples – approximately 15 images per class.
The BYO capability in AVI allows users to efficiently and accurately generate new insights by building on and expanding existing insights such as object detection and tracking. Instead of starting from scratch, users can begin with a well-established list of cars that have already been detected and tracked along the video, each with a representative image. Users can then use only numerous requests for the new Florence-based model to differentiate between the cars according to their model.
Note: This article is accompanied by a step-by-step code-based tutorial. Please visit the official Azure Video Indexer “Bring Your Own” Sample under the Video Indexer Samples Github Repository.
High Level Design and Flow
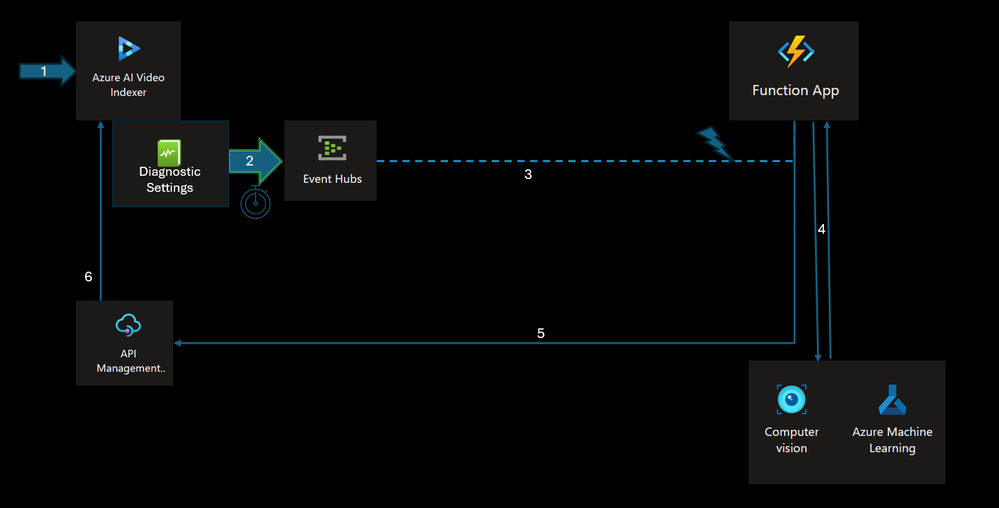
To demonstrate the usage of building customized AI pipeline, we will be using the following pipeline that leverages several key aspects of Video Indexer components and integrations:
1. Users employ their existing Azure Video Indexer account on Azure to index a video, either through the Azure Video Indexer Portal or the Azure Video Indexer API.
2. The Video Indexer account integrates with a Log Analytics workspace, enabling the publication of Audit and Events Data into a selected stream. For additional details on video index collection options, refer to: Monitor Azure Video Indexer | Microsoft Learn.
3. Indexing operation events (such as “Video Uploaded,” “Video Indexed,” and “Video Re-Indexed”) are streamed to Azure Event Hubs. Azure Event Hubs enhances the reliability and persistence of event processing and supports multiple consumers through “Consumer Groups.”
4. A dedicated Azure Function, created within the customer’s Azure Subscription, activates upon receiving events from the EventHub. This function specifically waits for the “Indexing-Complete” event to process video frames based on criteria like object detection, cropped images, and insights. The compute layer then forwards selected frames to the custom model via Cognitive Services Vision API and receives the classification results. In this example it sends the crops of the representative image for each tracked car in the video.
Note: The integration process involves strategic selection of video frames for analysis, leveraging AVI’s car detection and tracking capabilities, to only process representative cropped images of each tracked car in the custom model.
5. The compute layer (Azure Function) then transmits the aggregated results from the custom model back to the Azure API to update the existing indexing data using the Update Video Index API Call.
6. The enriched insights are subsequently displayed on the Video Indexer Portal
 Figure 2: New Insight widget in AVI for the custom model results
Note: for more in-depth step-by-step tutorial accomplished with code sample, please consult the official Azure Video Indexer GitHub Sample under the “Bring-Your-Own” Section.
Result Analysis
The outcome is a novel insight displayed in the user interface, revealing the outcomes from the custom model. This application allowed for the detection of a new subclass of objects, enhancing the video with additional, user-specific insights. In the examples provided below, each car is distinctly classified: for instance, the white car is identified as a family car (Figure 3), whereas the red car is categorized as a jeep (Figure 4).
 Figure 3: Azure Video Indexer with the new custom insight for the white car classified as family car.
 Figure 4: Azure Video Indexer with the new custom insight for the red car classified as family jeep.
Conclusions
With only a handful of API calls to the bespoke model, the system effectively conducts a thorough analysis of every car featured in the video. This method, which involves the selective use of certain images for the custom model combined with insights from AVI, not only reduces expenses but also boosts overall efficiency. It delivers a holistic analysis tool to users, paving the way for endless customization and AI integration opportunities.


Recent Comments