This article is contributed. See the original author and article here.
Introduction
Azure Sentinel Github contains out of the box detections, exploration queries, hunting queries, workbooks, playbooks and much more to help you get ramped up with Azure Sentinel and provide you security content to secure your environment and hunt for threats. In this blog, we will look at various Detections and Hunting Queries published in our public GitHub Repo , analyze and visualize the output to understand current MITRE ATT&CK® coverage, identify gaps etc. The goal is not necessarily to fill every gap but strategically identify opportunities to increase coverage to additional tactics, identify new data sources and develop detections to increase the coverage drastically.
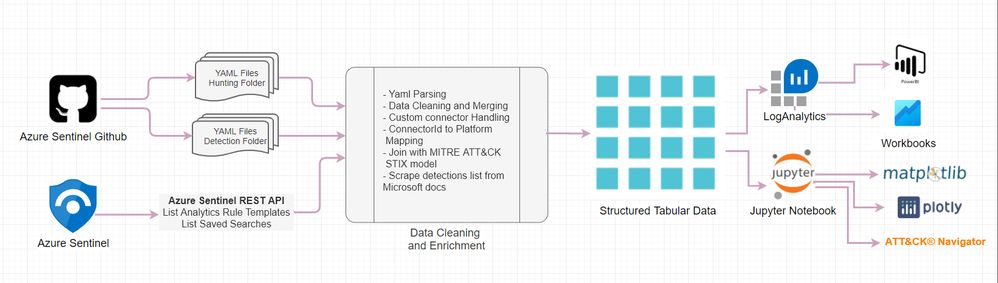
The entire workflow of the process can be visualized as shown in below diagram.

We will start with data acquisition which can be either directly from public community GitHub or you can also point to your private GitHub repository with queries if you have one. Another option is to use Azure Sentinel REST API to query your Azure Sentinel instance for Rule templates and Saved Searches which contains Hunting Queries. Once the data has been acquired, you can load into a dataframe for further cleaning and enrichment with MITRE dataset to finally receive some structured tabular data. The resulting dataset is structured into tabular format which you can also send it back to LogAnalytics into a custom logs table or simply access via externaldata operator from accessible storage.
The datasets can also be visualized via following tools.
- PowerBI
- Workbooks
- Python libraries (Plotly, matplotlib).
With the structured datasets, you can also create ATT&CK navigation layer json files to visualize it as an embedded iFrame within a Jupyter notebook or in independently in a browser.
Data Acquisition
You can retrieve Detections and hunting Queries via below 2 methods:
Download from GitHub.
In the first method, you can directly download template from the public Azure Sentinel GitHub repo. The templates are available within the Analytics pane and must be explicitly enabled and onboarded. Alternatively, you can also point it to your private GitHub repository if available. If you want to read more about Azure Sentinel DevOps process, refer the blog Deploying and Managing Azure Sentinel as Code.
Jupyter notebook will start with Setup section where it will check pre-requisite, install missing packages and set up the environment. Initial cells contains function definitions which will be sequentially executed at later stages. Later you will come at Data Acquisition section.
In this section, you will be prompted for folder location to store the extracted files (Detections and Hunting Queries). By default, it will create a folder named mitre-attack under current folder. You can customize and specify location if you want.
Jupyter notebook will start with Setup section where it will check pre-requisite, install missing packages and set up the environment. Initial cells contains function definitions which will be sequentially executed at alter stages. Later you will come at Data Acquisition section. In this section, you will be prompted for folder location to store the extracted files (Detections and Hunting Queries). By default, it will store in current folder. You can customize and specify location if you want

A python function named get_sentinel_queries_from_github() is created which can be invoked to download the entire repository and only extract selected folder (Detection and Hunting Queries) in previously mentioned location. If you are using your private repo, provide the archived path to your repo in azsentinel_git_url containing Detections and Hunting Queries as child folders.

You can also validate the operation is successful by manually running %ls in both the folders.

Retrieve via Azure Sentinel REST API – Experimental
In this method, you can use Azure Sentinel REST API to query your existing sentinel instance. For more information on using REST API, refer bog Azure Sentinel API 101. This section is currently marked as Experimental, as there are some limitations with output received from API so you won’t be able to get same level of granular details as from above first step. You will have to first authenticate via az login. Refer docs Sign in with Azure CLI if you need more details. Once successfully authenticated, you can generate refresh token and use it with API headers to send REST API query to AlertRuleTemplates and SavedSeaches.
Known API Limitations:
- Hunting Query is currently not part of REST API which is GA, but you can use LogAnalytics REST API saved searches and then filter out Hunting Queries.
- In both cases, the data retrieved from savedSearches and AlertRuleTemplates, only Tactics is available and not techniques. You may have to pull techniques by joining with Github Dataset if rule template is available.
Below is stripped section of sample output retrieved from REST API – AlertRuleTemplates and hunting queries.


Data Cleaning and Enrichment
Once you acquire the data, you will have to perform various data cleaning steps to be eligible for analysis. All the published rule templates are in YAML format, which is already structured, but the values are often multiple in array or array of dictionary format. You will have to flatten these values to create dataset.
YAML Parsing
In the first step, we will parse all the YAML files and load it into dataframe. The Dataframe is nothing but a Python data structure similar to a spreadsheet in rows and column format. You can read more about dataframe datastructure at Intro to data structures – DataFrame. We have created a Python function named parse_yaml() which will take a folder containing YAML files. We will parse the files from both Detections and Hunting Queries and join both datasets. While doing this operation, we will also create additional columns to extend the YAML schema, such as GithubURL , IngestedDate, Detection Type, Detection Service etc. Finally, when you run this function, with some additional cleanup, it will display status similar to below.

Clean and Preprocess Data
Once you have parsed the yaml files and load it into dataframe, we will further clean and preprocess the data. Example operations in this step can be as detailed below.
- Separate existing columns and derive new columns such as ConnectorId, DataTypes.
- Separating Null and valid ConnectorId values.
- Expanding the columns (ConnectorId, DataTypes, Tactics, relevantTechniques ) which have multiple values assigned as array into separate rows for easier analysis.
- Populate new column as Platform which will be based on custom mapping based on ConnectorId values e.g. AWSCloudTrail to AWS etc. Snippet of example mapping is shown as below. This mapping can be changed to customize to your environment.

You can then invoke function clean_and_preprocess_data() to execute this step. This function will return the dataset after cleaning and pre-processing original yaml files. We will also join the fusion dataset to the result dataset to create final dataset.
Below is example output from this step.

Enrich with MITRE Matrix
To find gaps in coverage , our original dataset needs to be joined with master dataset from MITRE ATT&CK matrix . We have created a function get_mitre_matrix_flat() that uses the Python library attackcti underneath with an additional data wrangling steps to return flat table as dataframe.
Below is example output from this function.

Merge preprocessed dataset with mitre datasets
In this step, we will merge our cleaned preprocessed dataset with the Mitre dataset. The resulting dataset will have our detections and hunting queries mapped to existing tactics & techniques, and will have blank lines where there are no matches.

After renaming columns and normalizing the datasets, output will look like the one below.
Remember you can have multiple rows for single detection if it has different values in Platform, ConnectorId, DataTypes. The resulting dataset will have single value in these columns so that it can be effectively analyzed and visualized. You can always aggregate them back into list/array to single row per detection.

Scraping Detection List of Microsoft Threat Protection Portfolio
Microsoft has a variety of threat protection solutions in its portfolio. Depending upon licenses you may have one or multiple of these enabled in your environment. Azure Sentinel natively integrates with these solutions and ingests rules once connected under SecurityAlerts table. Some of these solutions have published documentation on available rules under each on Microsoft docs website. These details can be easily scraped programmatically and create a result dataset. As we find more documentation, we will add other products to this list. Currently below services have rules published.
We have created python function for each of these and sample output are as shown below.
- Azure Defender (previously ASC)
https://docs.microsoft.com/en-us/azure/security-center/alerts-reference

- Azure Identity Protection Center

- Azure Defender for Identity (previously AATP)

- Microsoft Cloud Application Security (MCAS)
https://docs.microsoft.com/en-us/cloud-app-security/investigate-anomaly-alerts

You can later combine all above datasets into single dataframe, and display results as shown below.
This dataframe can be further used in visualization section.

Data Visualization
Now, we have all the data into a structured format, we can visualize it in a number of different ways and tools. The data can be sent back to LogAnalytics into custom table and later be visualized via either PowerBI or native Azure Sentinel Workbooks. Or you can also leverage the power of various Python visualization libraries within a Jupyter notebook. In the below screenshots, we have used matplotlib to visualize it as a heatmap, and used Plotly to visualize it into radar plots, donut charts etc. From the structured dataset, we can also automatically create ATT&CK navigation layer json files. These json files can be visualized as embedded iFrames within a Jupyter notebook or independently in a browser window. Check out below gif walkthrough of visualizations. You can also check the notebook directly for more static and interactive view.
Alerts Table Viewer – Jupyter Widget

Heatmaps using Matplotlib.

ATT&CK Navigator Embedded Iframe view

Radar Plots with Plotly

Donut Plots with Plotly

MITRE ATT&CK Workbook
This is an early version of the workbook available in GitHub which will be updated further for a more mature version and recommended instructions based on the workspace and datasources.

Uploading Results to Azure Sentinel
The data generated by data analysis (Alerts from Microsoft Services and Normalized Azure Sentinel Detections) can be uploaded back to Azure Sentinel. You can use data uploader feature of Msticpy for this. You can read more about it Uploading data to Azure Sentinel/Log Analytics.

Conclusion
Azure Sentinel provides out-of-the box detection and hunting query templates via its public GitHub repo. Currently the repository holds around 362 queries for defenders. Depending on the environment and onboarded data sources, customer can choose these and enable it in their respective Azure Sentinel instance. As all the templates are already mapped to the MITRE ATT&CK Tactics and Techniques, you can analyze and visualize the detection coverage and identify potential gaps. The goal or outcome of this analysis is not necessarily to fill every gap but understand the coverage ,identify blind spots and strategically make decisions to create new detections or onboard new data sources to increase the coverage.
Special thanks to @ianhelle for Sentinel API and @Cyb3rWard0g for ATT&CK Navigation layer section in the notebook.
References
- MITRE ATT&CK for Azure Sentinel Resources (Notebook, Supporting Files)
https://github.com/Azure/Azure-Sentinel/tree/master/Sample%20Data/MITRE%20ATT%26CK
- MITRE ATT&CK Workbook
https://github.com/Azure/Azure-Sentinel/blob/master/Workbooks/MITREAttack.json
- ATT&CK Navigator
https://github.com/mitre-attack/attack-navigator
- Sign in with Azure CLI
https://docs.microsoft.com/en-us/cli/azure/authenticate-azure-cli
- Intro to Data Structures – DataFrame
https://pandas.pydata.org/pandas-docs/stable/user_guide/dsintro.html#dataframe
- Automate the Creation of ATT&CK Navigator Group Layer Files with Python
- Deploying and Managing Azure Sentinel as Code
- Azure Sentinel REST API 101
https://techcommunity.microsoft.com/t5/azure-sentinel/azure-sentinel-api-101/ba-p/1438928
- Plotly – Radar Charts in Python
https://plotly.com/python/radar-chart/
- Plotly – Donut Chart
https://plotly.com/python/pie-charts/
Brought to you by Dr. Ware, Microsoft Office 365 Silver Partner, Charleston SC.

Recent Comments